paper - Odeon
paper - Odeon
paper - Odeon
Create successful ePaper yourself
Turn your PDF publications into a flip-book with our unique Google optimized e-Paper software.
5 COMPARISON OF SIMULATED AND MEASURED RESULTS<br />
5.1 Auditorium 21<br />
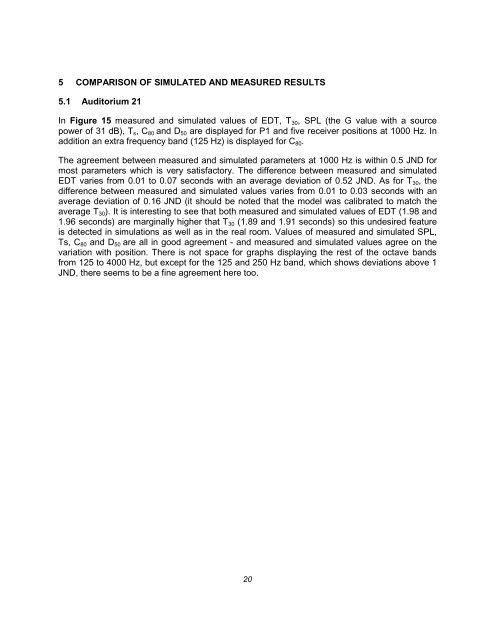
In Figure 15 measured and simulated values of EDT, T 30 , SPL (the G value with a source<br />
power of 31 dB), T s , C 80 and D 50 are displayed for P1 and five receiver positions at 1000 Hz. In<br />
addition an extra frequency band (125 Hz) is displayed for C 80 .<br />
The agreement between measured and simulated parameters at 1000 Hz is within 0.5 JND for<br />
most parameters which is very satisfactory. The difference between measured and simulated<br />
EDT varies from 0.01 to 0.07 seconds with an average deviation of 0.52 JND. As for T 30 , the<br />
difference between measured and simulated values varies from 0.01 to 0.03 seconds with an<br />
average deviation of 0.16 JND (it should be noted that the model was calibrated to match the<br />
average T 30 ). It is interesting to see that both measured and simulated values of EDT (1.98 and<br />
1.96 seconds) are marginally higher that T 30 (1.89 and 1.91 seconds) so this undesired feature<br />
is detected in simulations as well as in the real room. Values of measured and simulated SPL,<br />
Ts, C 80 and D 50 are all in good agreement - and measured and simulated values agree on the<br />
variation with position. There is not space for graphs displaying the rest of the octave bands<br />
from 125 to 4000 Hz, but except for the 125 and 250 Hz band, which shows deviations above 1<br />
JND, there seems to be a fine agreement here too.<br />
20


