paper - Odeon
paper - Odeon
paper - Odeon

Create successful ePaper yourself
Turn your PDF publications into a flip-book with our unique Google optimized e-Paper software.
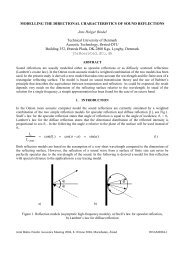
In Figure 16 measured and simulated values of EDT, T 30 , T s , C 80 and D 50 are displayed for P1<br />
and 11 receiver positions at 1000 Hz. In addition an extra frequency band (125 Hz) is displayed<br />
for C 80 .<br />
The difference between measured and simulated parameters at 1000 Hz are larger in terms of<br />
JND’s for Hagia Sofia than was the case for Auditorium 21 however the span for some of the<br />
parameters are also much larger than is the case for a normal auditorium.<br />
For EDT the difference between measured and simulated values differs between 0.01 and 3.49<br />
JND’s. The biggest deviation is found at the receiver point where source and receiver are very<br />
close to each other which is 16 meters in this large room! Indeed the first 8 dB of the measured<br />
backwards integrated curve is very steep because it is influenced by direct sound. The average<br />
deviation between measured and simulated EDT for the 11 positions is 1.15 JND.<br />
As for T 30 , the difference between measured and simulated values differs between 0.11 and<br />
0.54 JND’s with an average difference of 0.22 JND’s. Both simulations and measurements<br />
shows that T 30 is almost a constant throughout the whole volume although the space consists<br />
many coupled volumes and some of the receivers are located at very remote positions.<br />
The measured and simulated values of Ts in the 11 positions follow the same trends with<br />
position and vary substantially in the volume from 233 to 975 milliseconds. Using the JND of 10<br />
ms for Ts as given in ISO 3382-1 would suggest that there are large deviations between<br />
measured and simulated values of Ts however this value is highly questionable for a room with<br />
this volume and reverberation time – maybe a relative value of 5 % would be more meaningful.<br />
The D 50 parameter is within 1.19 JND for eight of the eleven positions. The three last positions<br />
are within 2.28 JND’s.<br />
C 80 has a deviation ranging from 0.47 to 4.66 JND’s with an average deviation of 2.27. One may<br />
say that this deviation is very high however considering that C 80 in the 11 positions ranges from<br />
-18.8 to 4.8 dB it shows a much higher fluctuation than in a normal auditorium. In any case one<br />
should be careful using parameters such as C 80 for evaluation of C 80 in coupled spaces such as<br />
Hagia Sofia as the buildup of the squared impulse response by far exceeds the 80 milliseconds<br />
time limit used for the C 80 parameter.<br />
There is not space for graphs displaying the rest of the octave bands from 125 to 4000 Hz, but<br />
the agreement between measured and simulated values are fairly similar to those of the 1000<br />
Hz band.<br />
23