paper - Odeon
paper - Odeon
paper - Odeon

Create successful ePaper yourself
Turn your PDF publications into a flip-book with our unique Google optimized e-Paper software.
wavelength of audible sound, the degree of geometrical detail in the room model is generally not<br />
the main source of uncertainty in the simulations. The acoustical data representing the<br />
materials, i.e. the absorption coefficients (α) and the scattering coefficients (s) are often more<br />
important for the uncertainty. The available data for a well defined highly absorbing material,<br />
which has been tested in the laboratory, come with a significant uncertainty (see Table 2 and<br />
Table 3).<br />
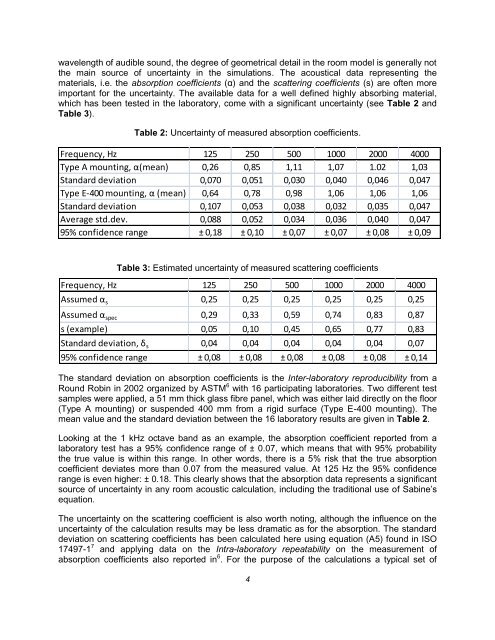
Table 2: Uncertainty of measured absorption coefficients.<br />
Frequency, Hz 125 250 500 1000 2000 4000<br />
Type A mounting, α(mean) 0,26 0,85 1,11 1,07 1.02 1,03<br />
Standard deviation 0,070 0,051 0,030 0,040 0,046 0,047<br />
Type E-400 mounting, α (mean) 0,64 0,78 0,98 1,06 1,06 1,06<br />
Standard deviation 0,107 0,053 0,038 0,032 0,035 0,047<br />
Average std.dev. 0,088 0,052 0,034 0,036 0,040 0,047<br />
95% confidence range ± 0,18 ± 0,10 ± 0,07 ± 0,07 ± 0,08 ± 0,09<br />
Table 3: Estimated uncertainty of measured scattering coefficients<br />
Frequency, Hz 125 250 500 1000 2000 4000<br />
Assumed α s 0,25 0,25 0,25 0,25 0,25 0,25<br />
Assumed α spec 0,29 0,33 0,59 0,74 0,83 0,87<br />
s (example) 0,05 0,10 0,45 0,65 0,77 0,83<br />
Standard deviation, δ s 0,04 0,04 0,04 0,04 0,04 0,07<br />
95% confidence range ± 0,08 ± 0,08 ± 0,08 ± 0,08 ± 0,08 ± 0,14<br />
The standard deviation on absorption coefficients is the Inter-laboratory reproducibility from a<br />
Round Robin in 2002 organized by ASTM 6 with 16 participating laboratories. Two different test<br />
samples were applied, a 51 mm thick glass fibre panel, which was either laid directly on the floor<br />
(Type A mounting) or suspended 400 mm from a rigid surface (Type E-400 mounting). The<br />
mean value and the standard deviation between the 16 laboratory results are given in Table 2.<br />
Looking at the 1 kHz octave band as an example, the absorption coefficient reported from a<br />
laboratory test has a 95% confidence range of ± 0.07, which means that with 95% probability<br />
the true value is within this range. In other words, there is a 5% risk that the true absorption<br />
coefficient deviates more than 0.07 from the measured value. At 125 Hz the 95% confidence<br />
range is even higher: ± 0.18. This clearly shows that the absorption data represents a significant<br />
source of uncertainty in any room acoustic calculation, including the traditional use of Sabine’s<br />
equation.<br />
The uncertainty on the scattering coefficient is also worth noting, although the influence on the<br />
uncertainty of the calculation results may be less dramatic as for the absorption. The standard<br />
deviation on scattering coefficients has been calculated here using equation (A5) found in ISO<br />
17497-1 7 and applying data on the Intra-laboratory repeatability on the measurement of<br />
absorption coefficients also reported in 6 . For the purpose of the calculations a typical set of<br />
4