paper - Odeon
paper - Odeon
paper - Odeon

Create successful ePaper yourself
Turn your PDF publications into a flip-book with our unique Google optimized e-Paper software.
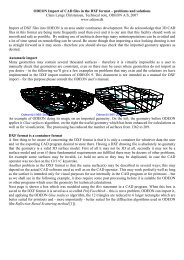
SPL / Noise (dB)<br />
an indicator whether sufficient S/N was present during the impulse response measurement. The<br />
S/N can be increased either by using a higher output on the loudspeaker, by increasing the<br />
sweep length or by using better equipment (cables, sound card etc.). As can be seen the graph<br />
forms an almost straight line indicating an increase in S/N by 3 dB per doubling of sweep length,<br />
which is expected from the sweep-method theory 15 .<br />
105<br />
100<br />
95<br />
90<br />
85<br />
80<br />
75<br />
70<br />
65<br />
60<br />
0,04 0,16 0,63 2,50 10,00 40,00 160,00 640,00<br />
Length of sweep (s)<br />
Figure 8: Measured Signal to Noise ratio with varying length of sweep.<br />
4.2 Uncertainty of position<br />
In practice it is not possible to position the microphone (nor the source) at an exact position<br />
when conducting room acoustic measurements. So, if reproducing the measurement at a later<br />
time slightly different results in terms of ISO3382-1 parameters should be expected. When a<br />
person is sitting in the auditorium the position will not be exact either. In order to give an idea of<br />
the uncertainty of measured parameters if the receiver position is not exact, measurements in a<br />
region close to receiver position 5 in the middle of the audience area was repeated with position<br />
offsets 30 cm right, 30 cm left, 15 cm front, 15 cm back, 10 cm up, and 10 cm down – a total of<br />
7 positions including the original position. The graphs below (Figure 9 to Figure 14) show<br />
statistics for the 7 positions for each of the parameters EDT, T 30 , Ts, D 50 and C 80 . Measured as<br />
well as simulated results are included for comparison. As can be seen the simulated values in<br />
receiver positions that are close to each other only show minor deviations, much less than<br />
deviations between the measured results, probably because phase is not included in the<br />
simulation model. However, as will be seen later, the simulated results do indeed differ between<br />
the significantly spaced receiver positions 1-5.<br />
15