Powering the Future Summary Report - Parsons Brinckerhoff
Powering the Future Summary Report - Parsons Brinckerhoff
Powering the Future Summary Report - Parsons Brinckerhoff

Create successful ePaper yourself
Turn your PDF publications into a flip-book with our unique Google optimized e-Paper software.
<strong>Powering</strong> <strong>the</strong> <strong>Future</strong> <strong>Summary</strong> <strong>Report</strong><br />
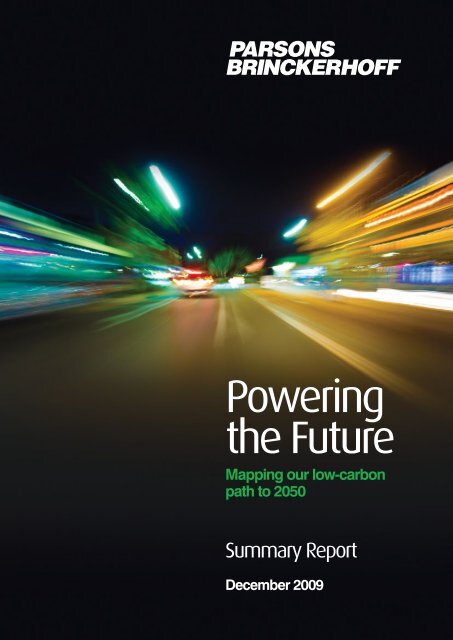
<strong>Powering</strong><br />
<strong>the</strong> <strong>Future</strong><br />
Mapping our low-carbon<br />
path to 2050<br />
<strong>Summary</strong> <strong>Report</strong><br />
December 2009
<strong>Powering</strong> <strong>the</strong> <strong>Future</strong> <strong>Summary</strong> <strong>Report</strong><br />
Contents<br />
Introduction....................................................................................04<br />
Findings...........................................................................................05<br />
Approach.........................................................................................08<br />
Objectives.......................................................................................08<br />
Scope...............................................................................................08<br />
Basic assumptions.......................................................................08<br />
Methodology..................................................................................08<br />
UK energy consumption by sector.........................................10<br />
1. Transport...................................................................................14<br />
2. Domestic....................................................................................18<br />
3. Industry......................................................................................22<br />
4. Commercial...............................................................................26<br />
5. Electricity...................................................................................30<br />
Scenario analysis..........................................................................36<br />
Scenario comparison..................................................................40<br />
© <strong>Parsons</strong> <strong>Brinckerhoff</strong> Ltd 2009.<br />
All rights reserved. The moral rights of <strong>the</strong> author have been asserted.<br />
01:02
<strong>Powering</strong> <strong>the</strong> <strong>Future</strong> <strong>Summary</strong> <strong>Report</strong><br />
<strong>Powering</strong> <strong>the</strong> <strong>Future</strong> <strong>Summary</strong> <strong>Report</strong><br />
Introduction<br />
To protect <strong>the</strong> wellbeing of future generations,<br />
immediate action is vital to manage carbon dioxide<br />
(CO 2 ) emissions worldwide and minimise <strong>the</strong> impact of<br />
climate change. The UK government has adopted a<br />
position of leadership, committing to an 80% reduction<br />
in emissions by 2050 compared with 1990 levels.<br />
Such a commitment presents a major challenge to<br />
<strong>the</strong> UK and its economy. We are already facing a<br />
serious shortfall in electricity generating capacity,<br />
given that many of our power stations are scheduled<br />
to retire in <strong>the</strong> next decade. Addressing this shortfall<br />
while trying to reduce CO 2 emissions could result in<br />
an overdependence on a single technology or fuel,<br />
affecting future security of supply.<br />
The UK government has consulted on various<br />
strategies necessary to deliver <strong>the</strong> climate change<br />
commitment, initiating work by <strong>the</strong> Climate Change<br />
Committee and prompting contributions from a wide<br />
range of interest groups and consultancies. The<br />
recently published UK Low Carbon Transition Plan<br />
and <strong>the</strong> UK Renewable Energy Strategy define a way<br />
forward to delivering <strong>the</strong> 34% reduction required to<br />
meet <strong>the</strong> first carbon budget for 2020. A roadmap for<br />
<strong>the</strong> period from 2020 to 2050 is being developed within<br />
government. Changes will be required in all sectors<br />
of <strong>the</strong> economy to deliver <strong>the</strong> major reductions in CO 2<br />
emissions by 2050. <strong>Powering</strong> <strong>the</strong> <strong>Future</strong> has been<br />
prepared as a contribution to this debate, evaluating<br />
opportunities in each sector for emission reduction<br />
while taking a holistic approach to energy consumption<br />
and CO 2 emissions in <strong>the</strong> UK economy.<br />
A key feature of <strong>Powering</strong> <strong>the</strong> <strong>Future</strong> is <strong>the</strong><br />
recognition of potential interactions between sectors.<br />
Acknowledging and exploiting <strong>the</strong> opportunities<br />
afforded by <strong>the</strong>se interactions is fundamental to <strong>the</strong> UK<br />
achieving its CO 2 emissions targets in an economically<br />
efficient manner. For example, if <strong>the</strong> UK began to<br />
produce significant amounts of its electricity from<br />
intermittent renewable sources without compensatory<br />
actions, <strong>the</strong> reliability of electricity supply would be<br />
degraded. However, wide adoption of electric vehicles<br />
in <strong>the</strong> transport sector would provide opportunities for<br />
<strong>the</strong> control of demand to maximise <strong>the</strong> value of <strong>the</strong><br />
renewable generation without degrading reliability.<br />
In moving forward its strategy, <strong>the</strong> UK has to deliver:<br />
• compliance with 2050 CO 2 reduction commitments<br />
• compliance with <strong>the</strong> 15% renewable energy target<br />
agreed with <strong>the</strong> EU by 2050<br />
• reliable electricity supply throughout <strong>the</strong> period to<br />
2050 and beyond<br />
• technically feasible changes in each sector, including<br />
those needed to take account of interactions<br />
between sectors<br />
• diversity of electricity generation technologies to<br />
minimise risks of overreliance on any one technology<br />
• diversity of energy supplies, keeping imported fuels<br />
to a reasonable minimum<br />
The adopted strategy has to consider <strong>the</strong> future<br />
availability of fuels. The security of fuel supply is clearly<br />
affected by <strong>the</strong> finite nature of many of <strong>the</strong> resources. It is<br />
also affected by commercial and political pressure, with<br />
<strong>the</strong> UK continuing to import most of its fossil fuel supplies<br />
for <strong>the</strong> foreseeable future. Sustainable fuel resources,<br />
such as biomass derived from plant materials and animal<br />
waste, will play a major role in reducing CO 2 emissions<br />
despite <strong>the</strong> modest scale of <strong>the</strong> available resource.<br />
As a leading international consultancy, <strong>Parsons</strong><br />
<strong>Brinckerhoff</strong> recognised <strong>the</strong> essential need for a<br />
comprehensive strategic approach to reducing CO 2<br />
emissions. Our involvement in major infrastructure<br />
projects in all sectors enabled us to adopt a broad<br />
view in assessing <strong>the</strong> implications to <strong>the</strong> UK economy<br />
of meeting <strong>the</strong> 80% CO 2 reduction commitment. In<br />
particular, we wanted to assess <strong>the</strong> effectiveness<br />
of alternative strategies in achieving <strong>the</strong> reduction<br />
commitment while minimising risks from excess<br />
dependence on critical technologies or fuels.<br />
<strong>Powering</strong> <strong>the</strong> <strong>Future</strong> evaluates options for CO 2<br />
emissions reduction across all sectors of <strong>the</strong> UK<br />
economy. Incorporating government published<br />
statistics on <strong>the</strong> current energy consumption and<br />
CO 2 emissions of each sector, it creates models that<br />
allow each improvement option to be analysed and<br />
evaluated. A scenario analysis is used to apply a<br />
consistent set of measures across all <strong>the</strong> sectors to<br />
evaluate CO 2 emissions and to compare <strong>the</strong> value of<br />
<strong>the</strong> different options.<br />
This summary report gives an overview of <strong>the</strong> scope,<br />
methodology and findings of our study. Fur<strong>the</strong>r details<br />
of <strong>the</strong> analyses, modelling work and more extensive<br />
findings are included in <strong>the</strong> full report 1 .<br />
1<br />
<strong>Parsons</strong> <strong>Brinckerhoff</strong> Ltd, ‘<strong>Powering</strong> <strong>the</strong> <strong>Future</strong>, Full <strong>Report</strong>’ 2009.<br />
03:04
<strong>Powering</strong> <strong>the</strong> <strong>Future</strong> <strong>Summary</strong> <strong>Report</strong><br />
<strong>Powering</strong> <strong>the</strong> <strong>Future</strong> <strong>Summary</strong> <strong>Report</strong><br />
Findings<br />
1. The scale and urgency of <strong>the</strong> challenge.<br />
Achieving <strong>the</strong> 80% reduction in CO 2 emissions<br />
mandated by <strong>the</strong> Climate Change Act 2008 is<br />
feasible but extraordinarily challenging. It will<br />
require urgent and large-scale effort in every sector<br />
of <strong>the</strong> UK, and a delay in any sector will jeopardise<br />
<strong>the</strong> commitment.<br />
2. Leadership. The scale and rate of change<br />
required across all sectors to achieve <strong>the</strong> desired<br />
reductions in CO 2 emissions are such that market<br />
mechanisms will require strong leadership from<br />
government to be effective.<br />
3. UK generation capacity trends. UK electricity<br />
generating capacity is forecast to fall to half of its<br />
current value by 2023, but it is unlikely that <strong>the</strong>re<br />
will be a significant reduction in demand (see<br />
figure 1). In order to maintain adequate capacity<br />
from 2020 onwards, new plant would have to be<br />
built at a rate that is at least equal to <strong>the</strong> highest<br />
historical rate achieved by <strong>the</strong> UK – this at a time<br />
when <strong>the</strong> capacity of <strong>the</strong> indigenous UK power<br />
plant industry is greatly reduced.<br />
4. Sector coordination. Analysing <strong>the</strong> alternative<br />
solutions shows <strong>the</strong>re are strong interactions<br />
between sectors and measures. All sectors must<br />
<strong>the</strong>refore be addressed in a coordinated way to<br />
avoid wasted investments and failed commitments.<br />
5. Sequence of interventions. There is a risk that<br />
decisions and actions taken now to meet <strong>the</strong> EU<br />
2020 renewables target will have undesired and<br />
adverse impacts on <strong>the</strong> UK’s ability to meet <strong>the</strong><br />
2050 carbon targets. For example, <strong>the</strong> early and<br />
widespread adoption of wind power could severely<br />
undermine <strong>the</strong> viability of o<strong>the</strong>r low-carbon<br />
technologies, making it more difficult to meet<br />
carbon targets and longer-term commitments.<br />
6. Maintaining industrial competitiveness.<br />
Funding <strong>the</strong> requirements for substantial<br />
reductions in CO 2 emissions and improvements<br />
in energy efficiency necessary from UK industry<br />
– without undermining its competitiveness – will<br />
require significant interventions at both <strong>the</strong> UK and<br />
European levels.<br />
7. Primary reduction measures. Comparing <strong>the</strong><br />
main CO 2 reduction options shown in figure 2<br />
indicates that <strong>the</strong> following measures are essential:<br />
• rapid and large-scale switch of cars and light<br />
goods vehicles to electric battery power<br />
• radical improvement in industrial energy efficiency<br />
• large-scale application of renewable heat using<br />
solar energy and making maximum use of<br />
available biomass<br />
• intensive and substantial improvement in <strong>the</strong><br />
insulation of new and existing homes and<br />
buildings<br />
• development and application of carbon capture<br />
and storage (CCS) for large emitters in <strong>the</strong><br />
industry sector, in addition to its application for<br />
coal-burning power plant<br />
8. Secondary reduction measures. Wind power,<br />
nuclear power and solar photovoltaic (PV) are<br />
collectively essential to <strong>the</strong> decarbonisation of<br />
electricity production, reducing CO 2 emissions by<br />
over 100 MtCO 2 /yr from current levels. However,<br />
as electricity will be largely decarbonised by 2050,<br />
<strong>the</strong> value of any individual low-carbon power<br />
generating measure will be low, as shown in<br />
figure 2. The choice between <strong>the</strong>se alternatives<br />
must <strong>the</strong>refore be made on operational, economic<br />
and energy security grounds.<br />
9. Avoiding technology dependence. Choices<br />
between alternative measures can result in<br />
excessive dependence on key technologies. For<br />
example, <strong>the</strong> omission of a nuclear programme<br />
would result in heavy dependence on CCS<br />
technology, which is currently unproven at <strong>the</strong><br />
scale required for a major power plant.<br />
10. Avoiding fuel dependence. Fuel diversity issues<br />
can be managed if a holistic view of UK energy use<br />
is taken. The reference scenario (<strong>the</strong> base case<br />
for evaluation of alternative options) achieves a<br />
good diversity of fuels by substituting electricity for<br />
oil in <strong>the</strong> transport sector and by having a flexible<br />
electricity generation mix.<br />
11. Quick wins. Because of <strong>the</strong> scale of <strong>the</strong><br />
measures, improved building insulation, improved<br />
industry energy efficiency and greater use of<br />
electric vehicles all offer valuable reductions in<br />
carbon emissions by 2020. Early action is needed<br />
to deliver <strong>the</strong>se reductions.<br />
Figure 1 UK forward capacity gap<br />
Figure 2 Value of measures to 2050 CO 2 emission reductions<br />
05:06
<strong>Powering</strong> <strong>the</strong> <strong>Future</strong> <strong>Summary</strong> <strong>Report</strong><br />
<strong>Powering</strong> <strong>the</strong> <strong>Future</strong> <strong>Summary</strong> <strong>Report</strong><br />
Approach<br />
Objectives<br />
The main objectives of <strong>Powering</strong> <strong>the</strong> <strong>Future</strong> are to:<br />
• provide a coherent response to <strong>the</strong> UK government<br />
on <strong>the</strong> implications of <strong>the</strong> climate change<br />
commitments across <strong>the</strong> economy<br />
• assess <strong>the</strong> types and scale of change required in<br />
each sector to meet <strong>the</strong> commitments<br />
• compare <strong>the</strong> impact of alternative strategies for<br />
emissions reduction, to identify which are critical to<br />
achieving compliance<br />
• identify <strong>the</strong> implications of adopting alternative<br />
strategies, with regard to UK dependence on critical<br />
technologies or fuels<br />
Scope<br />
The intent of <strong>Powering</strong> <strong>the</strong> <strong>Future</strong> is to assess <strong>the</strong><br />
impact of adopting different sets of technologies and<br />
measures to achieve <strong>the</strong> targeted CO 2 reductions<br />
across <strong>the</strong> whole of <strong>the</strong> UK economy, so that fur<strong>the</strong>r<br />
work can be directed towards delivering results<br />
consistently across all sectors.<br />
<strong>Powering</strong> <strong>the</strong> <strong>Future</strong> addresses <strong>the</strong> major emitting<br />
sectors to assess <strong>the</strong> potential CO 2 reduction<br />
measures. However it nei<strong>the</strong>r examines in detail <strong>the</strong><br />
implications of <strong>the</strong> alternative strategies on energy<br />
security, nor attempts to compare costs. Costs have<br />
already been covered in publications such as <strong>the</strong> Stern<br />
Review 2 and McKinsey 3 . In 2006, <strong>Parsons</strong> <strong>Brinckerhoff</strong><br />
published a report entitled <strong>Powering</strong> <strong>the</strong> Nation which<br />
provided detailed costs for alternative power generation<br />
technologies. This report will be updated and reissued<br />
in early 2010 to take account of <strong>the</strong> significant changes<br />
in <strong>the</strong> costs of fuels and plant since 2006.<br />
Basic assumptions<br />
<strong>Powering</strong> <strong>the</strong> <strong>Future</strong> makes <strong>the</strong> following assumptions:<br />
• <strong>the</strong> 2050 commitment is <strong>the</strong> appropriate target for<br />
CO 2 reduction<br />
• <strong>the</strong> effects of climate change on heating or cooling<br />
demand will be limited<br />
• <strong>the</strong>re will be no radical changes in lifestyle, ie most<br />
people will live in houses and will travel to work<br />
outside <strong>the</strong> home; families will have an average<br />
of two children; life expectancies will not change<br />
significantly<br />
• economic growth will average 1.5% over <strong>the</strong> period<br />
• <strong>the</strong> limitations of <strong>the</strong> electricity transmission and<br />
distribution networks do not restrict <strong>the</strong> outcomes of<br />
particular scenarios<br />
Readers should also note that <strong>the</strong> options considered<br />
only use technologies that are ei<strong>the</strong>r currently<br />
established or are close to large-scale application.<br />
Methodology<br />
<strong>Powering</strong> <strong>the</strong> <strong>Future</strong> divides <strong>the</strong> UK economy into five<br />
sectors:<br />
• transport<br />
• domestic<br />
• industry<br />
• commercial<br />
• electricity<br />
It analyses <strong>the</strong>se sectors for potential responses to<br />
<strong>the</strong> CO 2 emissions reduction target. Drawing upon<br />
government published statistics, it reviews <strong>the</strong> current<br />
energy consumption and CO 2 emissions of each<br />
sector and prepares a forecast to 2050. The resulting<br />
information is incorporated into a sector model that<br />
allows each improvement option to be analysed and<br />
evaluated. These options fall into four general types:<br />
• demand reduction<br />
• efficiency improvement<br />
• substitution of alternative fuels or energy source<br />
• capture and storage of CO 2 emissions<br />
Each type of solution can contribute to a reduction in<br />
CO 2 emissions. The first three types can be applied to<br />
every sector, while CCS is more appropriate for large<br />
fixed-point sources of CO 2 emissions such as a steel<br />
works or power plant.<br />
Following <strong>the</strong> analyses of each sector, a scenario<br />
analysis applies a consistent set of measures across<br />
<strong>the</strong> sectors (for example improved insulation of<br />
buildings or <strong>the</strong> application of renewable heat) to<br />
evaluate <strong>the</strong> overall impact on <strong>the</strong> UK. This analysis<br />
allows <strong>the</strong> alternative strategies to be compared and<br />
critical measures to be identified.<br />
The next section describes energy consumption for<br />
each sector of <strong>the</strong> UK economy. Potential measures<br />
are <strong>the</strong>n considered for each sector. ‘Scenario analysis’<br />
describes our approach of using scenarios to assess<br />
groups of measures and <strong>the</strong>ir impact on CO 2 emissions.<br />
The final section of this report, ‘scenario comparison’,<br />
presents <strong>the</strong> results of <strong>the</strong> scenario analysis.<br />
2<br />
Stern N, ‘The Economics of Climate Change’ 2006.<br />
3<br />
McKinsey & Company, ‘Pathways to a Low-Carbon Economy, version 2 of <strong>the</strong> Global Greenhouse Gas Abatement Cost Curve’ 2009.<br />
07:08
<strong>Powering</strong> <strong>the</strong> <strong>Future</strong> <strong>Summary</strong> <strong>Report</strong><br />
<strong>Powering</strong> <strong>the</strong> <strong>Future</strong> <strong>Summary</strong> <strong>Report</strong><br />
UK energy consumption by sector<br />
The breakdown of energy consumption and trend of<br />
CO 2 emissions 4 of <strong>the</strong> five sectors of <strong>the</strong> UK economy<br />
considered in <strong>Powering</strong> <strong>the</strong> <strong>Future</strong> are shown in figures<br />
3 and 4. The currently limited emissions from aviation<br />
and marine transport involve more complex issues and<br />
are not considered in this report.<br />
CO 2 emissions depend strongly on <strong>the</strong> sector fuel mix,<br />
as natural gas emits less than 65% of <strong>the</strong> CO 2 emitted<br />
by coal per unit energy released and generally can be<br />
used much more efficiently. The changing emissions<br />
in <strong>the</strong> electricity sector have primarily resulted from <strong>the</strong><br />
development of gas-fired combined cycle gas turbine<br />
(CCGT) plant during <strong>the</strong> 1990s, but <strong>the</strong>re has been an<br />
operational swing back towards coal-fired generation<br />
with <strong>the</strong> increase in gas prices. The consumption of<br />
<strong>the</strong> different fuels in <strong>the</strong> UK economy in 2006 is shown<br />
in figure 5.<br />
The fuels are not used equally by each sector. Coal<br />
is used predominantly in <strong>the</strong> electricity sector, which<br />
also uses all of <strong>the</strong> nuclear energy and most of <strong>the</strong><br />
renewable energy. Transport consumes most of <strong>the</strong><br />
oil, with gas divided between <strong>the</strong> non-transport sectors.<br />
Availability of energy resources<br />
<strong>Future</strong> fossil fuel use will be significantly affected<br />
by limitations in <strong>the</strong> availability of energy resources<br />
internationally. Availability is limited by <strong>the</strong> amount<br />
of naturally occurring fuel that is both economic<br />
and technically feasible to extract and exploit. Fuel<br />
availability can also be restricted by commercial and<br />
political pressures. For this reason it is important<br />
to maintain a diverse fuels policy that avoids<br />
overdependency on single-fuel sources.<br />
The USA and <strong>the</strong> UK have already reached <strong>the</strong>ir oil<br />
peaks and <strong>the</strong> production of oil in <strong>the</strong>se countries is on<br />
<strong>the</strong> decline at a time when demand is still increasing.<br />
The timing of a worldwide oil peak is contentious, but<br />
most experts agree that it will occur within <strong>the</strong> next<br />
decade.<br />
A respected source of data on reserves of oil, gas and<br />
coal is <strong>the</strong> BP Statistical Review of World Energy 6 . In<br />
its 2009 report, BP indicates that <strong>the</strong> Middle East has<br />
ano<strong>the</strong>r 80 years of production while Europe has just<br />
20 years. The worldwide total reserve/production (R/P)<br />
ratio is 40 years.<br />
Figure 3 Breakdown of primary energy consumption by sector 2006 5<br />
4<br />
For <strong>the</strong> purposes of <strong>Powering</strong> <strong>the</strong> <strong>Future</strong>, <strong>the</strong> 1990 reference value was defined as <strong>the</strong> total emissions from <strong>the</strong>se sectors of<br />
561.5 MtCO 2/yr. This excludes emissions of 31 MtCO 2/yr that resulted from activities outside <strong>the</strong> sectors considered here.<br />
5<br />
Derived from: Department for Business, Enterprise and Regulatory Reform, ‘DUKES Table 1.3: Supply and use of fuels’ 2008.<br />
6<br />
BP, ‘Statistical Review of World Energy’ 2009.<br />
09:10
<strong>Powering</strong> <strong>the</strong> <strong>Future</strong> <strong>Summary</strong> <strong>Report</strong><br />
<strong>Powering</strong> <strong>the</strong> <strong>Future</strong> <strong>Summary</strong> <strong>Report</strong><br />
BP reports that <strong>the</strong> R/P ratio for worldwide natural gas<br />
is 63 years; for Europe it is also 63 years.<br />
Coal has a worldwide R/P ratio of 122 years, with<br />
Europe having 51 years. The UK is shown to have<br />
155 million tonnes of coal reserve. At <strong>the</strong> current rate<br />
of production, this would last just nine years (from <strong>the</strong><br />
end of 2008), giving <strong>the</strong> UK an R/P ratio of nine.<br />
In 2006, <strong>the</strong> OECD published information concerning<br />
uranium reserves 7 , stating that known resources would<br />
last 85 years at <strong>the</strong> current rate of use. There are<br />
o<strong>the</strong>r sources of nuclear fuel, such as thorium which<br />
occurs naturally at three times <strong>the</strong> level of uranium.<br />
Technology to use thorium in existing nuclear reactors<br />
is not mature, but <strong>the</strong>re is potential for at least <strong>the</strong>ir<br />
partial conversion to use this fuel.<br />
Biomass – non-fossil fuels derived from plant<br />
materials and animal waste – is a key resource<br />
but it is inconsistently defined, creating inevitable<br />
discrepancies between available data. In 2005, <strong>the</strong><br />
Carbon Trust produced a review 8 that shows that<br />
UK-sourced biomass has energy equal to 3.5 million<br />
tonnes of oil equivalent (MTOE) at current levels of<br />
production, with a potential to supply twice this value.<br />
By contrast, Defra suggests 9 that <strong>the</strong> current level of<br />
UK-sourced biomass energy is 5.6 to 6.7 MTOE. With<br />
imports, <strong>the</strong> maximum available biomass in <strong>the</strong> UK<br />
is likely to be limited to around 20 MTOE. Biogas is<br />
produced from <strong>the</strong> biological decay of organic matter<br />
and can generally be used as an alternative means of<br />
delivery of biomass energy, but it is unlikely to radically<br />
increase <strong>the</strong> available biomass energy resource.<br />
Figure 4 CO 2 emissions from primary energy sources by sector 10<br />
Figure 5 Breakdown of UK economy fuel use 2006 11<br />
7<br />
Organisation for Economic Co-operation and Development, Nuclear Energy Agency, International Atomic Energy Agency, ‘Uranium<br />
2005: Resources, Production and Demand’ 2005.<br />
8<br />
Paul Arwas Associates, Black & Veatch Ltd, ‘Biomass Sector Review for <strong>the</strong> Carbon Trust’ 2005.<br />
9<br />
Department for Environment, Food and Rural Affairs, ‘UK Biomass Strategy’ 2007.<br />
10<br />
Department for Environment, Food and Rural Affairs, ‘Table 5b: Estimated emissions of carbon dioxide (CO 2) by National<br />
Communication source category, type of fuel and end user: 1970-2007’ 2008.<br />
11<br />
Derived from: Department for Business, Enterprise and Regulatory Reform, ‘DUKES Table 1.3: Supply and use of fuels’ 2008.<br />
11:12
<strong>Powering</strong> <strong>the</strong> <strong>Future</strong> <strong>Summary</strong> <strong>Report</strong><br />
<strong>Powering</strong> <strong>the</strong> <strong>Future</strong> <strong>Summary</strong> <strong>Report</strong><br />
UK energy consumption by sector<br />
1. Transport<br />
The transport sector consumes about 26% (59 MTOE)<br />
of <strong>the</strong> fossil fuel supply to <strong>the</strong> UK economy. Road<br />
transport dominates UK transport energy consumption<br />
and any transfer of traffic from road to rail will strongly<br />
affect energy consumption in <strong>the</strong> rail sector. Since<br />
rail represents a small proportion of passenger and<br />
freight movements, it would be radically affected by<br />
any significant transfers from road transport. Because<br />
of <strong>the</strong> modest scale of rail energy consumption and<br />
its sensitivity to road transport strategy, detailed<br />
consideration of this part of <strong>the</strong> transport sector is not<br />
attempted pending clearer definition of overall transport<br />
strategy.<br />
In order to reduce CO 2 emissions from road transport,<br />
<strong>the</strong> energy currently delivered from fossil petroleum<br />
fuels will have to be substantially replaced by<br />
alternatives.<br />
Table 1 illustrates <strong>the</strong> main options considered for <strong>the</strong><br />
transport sector and shows which ones are included in<br />
<strong>the</strong> reference scenario, <strong>the</strong> base case for evaluation of<br />
alternative options.<br />
We assessed measures to improve <strong>the</strong> performance<br />
of internal combustion engines. While <strong>the</strong>se would be<br />
useful transition measures, none can deliver <strong>the</strong> radical<br />
reductions in fuel consumption needed to meet <strong>the</strong><br />
2050 commitment.<br />
Figure 6 shows <strong>the</strong> overall CO 2 reduction effects of<br />
<strong>the</strong> options, including changes of emissions in <strong>the</strong><br />
electricity sector, where appropriate, compared to <strong>the</strong><br />
‘business as usual’ case. Electricity sector emissions<br />
are based on indicative levels of 0.4 tCO 2 /MWh in 2020<br />
and 0.1 tCO 2 /MWh in 2050.<br />
Table 1 Selected measures for transport sector response to CO 2 emissions<br />
13:14
<strong>Powering</strong> <strong>the</strong> <strong>Future</strong> <strong>Summary</strong> <strong>Report</strong><br />
<strong>Powering</strong> <strong>the</strong> <strong>Future</strong> <strong>Summary</strong> <strong>Report</strong><br />
Large-scale conversion of road transport to biofuels<br />
is restricted by <strong>the</strong> available biomass that can be<br />
employed without affecting food production or causing<br />
environmental damage. We believe a limit of 5%<br />
biofuel content of transport fuels to be <strong>the</strong> highest<br />
sustainable level.<br />
Hydrogen storage with fuel cell electric power is<br />
an alternative to battery electric power for vehicles,<br />
although it offers a smaller CO 2 reduction and is not yet<br />
as advanced in development or readiness for largescale<br />
application. Hydrogen can be produced ei<strong>the</strong>r<br />
by electrolysis of water or by chemical processing of a<br />
hydrocarbon fuel, conventionally coal, for <strong>the</strong> scale of<br />
production needed for use as a transport fuel.<br />
Our analysis shows that hydrogen produced by<br />
electrolysis to supply vehicles using efficient fuel<br />
cells and electric drives requires two to three times<br />
<strong>the</strong> electricity needed to deliver <strong>the</strong> same energy to a<br />
battery-powered vehicle. This alternative is <strong>the</strong>refore<br />
not viable.<br />
Production of hydrogen by gasification of coal is a<br />
complex and energy-intensive process which includes<br />
<strong>the</strong> separation of a large proportion of <strong>the</strong> by-product<br />
CO 2 for storage. The hydrogen produced needs to<br />
be distributed through a new network of high-pressure<br />
pipelines to vehicle fuelling stations across <strong>the</strong> country.<br />
This costly infrastructure would commit <strong>the</strong> UK to<br />
increased dependency on fossil fuels and additional<br />
CO 2 emissions. This option is <strong>the</strong>refore excluded from<br />
fur<strong>the</strong>r consideration.<br />
Figure 6 Transport measures - net CO 2 reduction on sector emissions<br />
15:16
<strong>Powering</strong> <strong>the</strong> <strong>Future</strong> <strong>Summary</strong> <strong>Report</strong><br />
<strong>Powering</strong> <strong>the</strong> <strong>Future</strong> <strong>Summary</strong> <strong>Report</strong><br />
UK energy consumption by sector<br />
2. Domestic<br />
The domestic residential sector consumes about 16%<br />
(36 MTOE) of <strong>the</strong> fossil fuel supply to <strong>the</strong> UK economy.<br />
It is a diverse sector, with different types and ages<br />
of housing in urban and rural contexts, and varying<br />
degrees of access to energy sources.<br />
Table 2 illustrates <strong>the</strong> main options considered for <strong>the</strong><br />
domestic sector and shows which ones are included in<br />
<strong>the</strong> reference scenario.<br />
Table 2 Selected measures for domestic sector response to CO 2 emissions<br />
12<br />
Boardman B, Darby S, Killip G, Hinnells M, ‘40% House’ 2005.<br />
17:18
<strong>Powering</strong> <strong>the</strong> <strong>Future</strong> <strong>Summary</strong> <strong>Report</strong><br />
<strong>Powering</strong> <strong>the</strong> <strong>Future</strong> <strong>Summary</strong> <strong>Report</strong><br />
Figure 7 shows <strong>the</strong> overall CO 2 reduction effects of<br />
<strong>the</strong> options, including changes of emissions in <strong>the</strong><br />
electricity sector, where appropriate. Electricity sector<br />
emissions are based on indicative levels of 0.4 tCO 2 /<br />
MWh in 2020 and 0.1 tCO 2 /MWh in 2050.<br />
Figure 7 Domestic measures - net CO 2 reduction on sector emissions<br />
19:20
<strong>Powering</strong> <strong>the</strong> <strong>Future</strong> <strong>Summary</strong> <strong>Report</strong><br />
<strong>Powering</strong> <strong>the</strong> <strong>Future</strong> <strong>Summary</strong> <strong>Report</strong><br />
UK energy consumption by sector<br />
3. Industry<br />
The industry sector consumes about 17% (39 MTOE) of<br />
<strong>the</strong> fossil fuel supply to <strong>the</strong> UK economy. The diversity<br />
of <strong>the</strong> industry sector is a key part of its character,<br />
making it more difficult to produce broad assessments<br />
of potential improvements in CO 2 emissions.<br />
Table 3 illustrates <strong>the</strong> main options considered for <strong>the</strong><br />
industry sector and shows which ones are included in<br />
<strong>the</strong> reference scenario.<br />
Table 3 Selected measures for industry sector response to CO 2 emissions<br />
21:22
<strong>Powering</strong> <strong>the</strong> <strong>Future</strong> <strong>Summary</strong> <strong>Report</strong><br />
<strong>Powering</strong> <strong>the</strong> <strong>Future</strong> <strong>Summary</strong> <strong>Report</strong><br />
Figure 8 shows <strong>the</strong> overall CO 2 reduction effects of<br />
<strong>the</strong> options, including changes of emissions in <strong>the</strong><br />
electricity sector, where appropriate, compared to <strong>the</strong><br />
‘business as usual’ case. Electricity sector emissions<br />
are based on indicative levels of 0.4 tCO 2 /MWh in 2020<br />
and 0.1 tCO 2 /MWh in 2050.<br />
Certain measures are excluded from <strong>the</strong> reference<br />
scenario. Biomass CHP, while offering useful CO 2<br />
reductions, is not included as <strong>the</strong>re is insufficient<br />
biomass available for <strong>the</strong> large energy demands of<br />
industry. Electrical efficiency and conversion to gas<br />
have only a small impact which could be considered<br />
part of <strong>the</strong> continuous process of energy efficiency<br />
improvement in industry.<br />
The large process efficiency improvement required to<br />
reduce industry sector emissions by 2050 represents<br />
a major financial challenge to industry. Funding <strong>the</strong><br />
development and application of <strong>the</strong> necessary new<br />
technologies could undermine <strong>the</strong> competitiveness of<br />
UK industry.<br />
While we were preparing <strong>Powering</strong> <strong>the</strong> <strong>Future</strong>, major<br />
UK businesses voiced <strong>the</strong>ir concern to us that <strong>the</strong><br />
inadvertent costs of carbon trading and improvement<br />
programmes could force producers offshore. This<br />
would damage <strong>the</strong> UK economy directly by <strong>the</strong> loss of<br />
employment and indirectly by increasing imports. The<br />
latter would increase global CO 2 emissions through<br />
<strong>the</strong> use of less advanced processes and international<br />
transport – <strong>the</strong> exact reverse of <strong>the</strong> intent of such<br />
measures.<br />
Figure 8 Industry measures - net CO 2 reduction on sector emissions<br />
23:24
<strong>Powering</strong> <strong>the</strong> <strong>Future</strong> <strong>Summary</strong> <strong>Report</strong><br />
<strong>Powering</strong> <strong>the</strong> <strong>Future</strong> <strong>Summary</strong> <strong>Report</strong><br />
UK energy consumption by sector<br />
4. Commercial<br />
The commercial sector only consumes about 5%<br />
(11 MTOE) of <strong>the</strong> fossil fuel supply to <strong>the</strong> UK economy.<br />
The diversity of <strong>the</strong> sector means that only a partial<br />
assessment of emission reduction measures can<br />
be quantified. We have focused primarily on <strong>the</strong><br />
commercial and public administration elements,<br />
which represent over 80% of <strong>the</strong> energy consumption<br />
(and hence CO 2 emissions) of <strong>the</strong> sector.<br />
Table 4 illustrates <strong>the</strong> main options considered for <strong>the</strong><br />
commercial sector and shows which ones are included<br />
in <strong>the</strong> reference scenario.<br />
Table 4 Selected measures for commercial sector response to CO 2 emissions<br />
25:26
<strong>Powering</strong> <strong>the</strong> <strong>Future</strong> <strong>Summary</strong> <strong>Report</strong><br />
<strong>Powering</strong> <strong>the</strong> <strong>Future</strong> <strong>Summary</strong> <strong>Report</strong><br />
Table 4 Selected measures for commercial sector response to CO 2 emissions continued<br />
Figure 9 shows <strong>the</strong> overall CO 2 reduction effects of<br />
<strong>the</strong> options, including changes of emissions in <strong>the</strong><br />
electricity sector, where appropriate, compared to <strong>the</strong><br />
‘business as usual’ case. Electricity sector emissions<br />
are based on indicative levels of 0.4 tCO 2 /MWh in 2020<br />
and 0.1 tCO 2 /MWh in 2050.<br />
Convert to biomass is excluded from fur<strong>the</strong>r analysis<br />
as <strong>the</strong> demand is considered too large for available<br />
biomass. Gas CHP and heat pumps are included for<br />
those years when <strong>the</strong>y are beneficial.<br />
Figure 9 Commercial measures - net CO 2 reduction on sector emissions<br />
27:28
<strong>Powering</strong> <strong>the</strong> <strong>Future</strong> <strong>Summary</strong> <strong>Report</strong><br />
<strong>Powering</strong> <strong>the</strong> <strong>Future</strong> <strong>Summary</strong> <strong>Report</strong><br />
UK energy consumption by sector<br />
5. Electricity<br />
The UK electricity sector consumes about 37%<br />
(85 MTOE) of <strong>the</strong> fossil fuel supply to <strong>the</strong> UK economy.<br />
The electricity sector comprises three levels: large<br />
generating stations that provide a high proportion<br />
of <strong>the</strong> power; <strong>the</strong> transmission network that links<br />
toge<strong>the</strong>r <strong>the</strong> generating stations and major substations<br />
at high voltage (to minimise energy losses); and <strong>the</strong><br />
distribution network, supplied from <strong>the</strong> high-voltage<br />
substations and ultimately connected to every home<br />
and business in <strong>the</strong> country.<br />
The electricity sector is a major fuel consumer and one<br />
of <strong>the</strong> largest emitters of CO 2 . The scale and operation<br />
of <strong>the</strong> electricity sector is determined by <strong>the</strong> demands<br />
of <strong>the</strong> o<strong>the</strong>r sectors for a reliable supply of electricity to<br />
meet <strong>the</strong>ir energy needs.<br />
As can be seen from figure 10, over 90% of electricity<br />
is produced from just three types of fuel: coal, gas and<br />
nuclear. Smaller amounts of power are contributed<br />
by a wide range of o<strong>the</strong>r plant types, with <strong>the</strong> input<br />
from renewable generation, particularly wind, rising<br />
significantly but still representing only 1.8% of <strong>the</strong> total<br />
in 2006.<br />
Much of <strong>the</strong> power plant in <strong>the</strong> UK is approaching <strong>the</strong><br />
end of its life and <strong>the</strong> need to replace that capacity in a<br />
timely way presents a significant challenge. Figure 11<br />
shows <strong>the</strong> forward capacity of existing plant and plant<br />
already committed for construction, excluding any<br />
future new construction.<br />
The forward capacity forecast shows that nuclear<br />
generation will be minimal after 2025 and that existing<br />
coal-burning units are all likely to be shut down by<br />
<strong>the</strong> same date. Few existing CCGT units will still be in<br />
operation by 2035. The only existing plant to remain in<br />
service beyond 2050 will be <strong>the</strong> hydroelectric units that<br />
represent about 2.5% of total current capacity.<br />
The options for major future generating plant to meet<br />
future electricity demands are listed in Table 5.<br />
These types of plant each have different characteristics<br />
for construction, with different lead times for major<br />
equipment and duration of construction work on site.<br />
In addition, <strong>the</strong> capability of industry to design, supply,<br />
construct and commission such plant is limited by<br />
technical resources such as large forging facilities and<br />
<strong>the</strong> availability of skilled and experienced staff. Such<br />
Figure 10 Electricity production according to fuel source 2006 13<br />
13<br />
Department for Business, Enterprise and Regulatory Reform, ‘DUKES Table 5.6: Electricity fuel use, generation and supply’ 2008.<br />
29:30
<strong>Powering</strong> <strong>the</strong> <strong>Future</strong> <strong>Summary</strong> <strong>Report</strong><br />
<strong>Powering</strong> <strong>the</strong> <strong>Future</strong> <strong>Summary</strong> <strong>Report</strong><br />
limitations on <strong>the</strong> rate of construction are profound and<br />
are difficult to change quickly.<br />
The electricity sector is unusual in that it has minimal<br />
inherent energy consumption, unlike <strong>the</strong> o<strong>the</strong>r<br />
sectors, but instead must meet <strong>the</strong> demands of <strong>the</strong><br />
o<strong>the</strong>r sectors for electrical energy. In matching <strong>the</strong>se<br />
demands in each scenario, <strong>the</strong> mix of new generating<br />
capacity is selected to maintain a reliable electricity<br />
supply with minimum CO 2 emissions to 2050, ensuring<br />
that <strong>the</strong>re is sufficient capacity to meet <strong>the</strong> aggregated<br />
peak demand of <strong>the</strong> sectors. The plant mix also allows<br />
for <strong>the</strong> intermittency of many renewable sources, while<br />
recognising that each plant type must have sufficient<br />
utilisation for new investment to be viable. The<br />
matching of capacity with demand is illustrated for <strong>the</strong><br />
reference scenario in figure 12.<br />
<strong>Powering</strong> <strong>the</strong> <strong>Future</strong> addresses <strong>the</strong> specific issue of<br />
how to integrate into <strong>the</strong> electricity supply system <strong>the</strong><br />
large amounts of wind capacity likely to be required<br />
to meet <strong>the</strong> EU Renewables Directive. The inherent<br />
variability of wind generation needs to be corrected<br />
by o<strong>the</strong>r forms of generation to maintain a reliable<br />
continuous supply to consumers. Building on work<br />
which evaluated <strong>the</strong> hour-by-hour generation of 25 GW<br />
of wind capacity widely distributed across <strong>the</strong> UK 15 ,<br />
we created a model to assess <strong>the</strong> ability of <strong>the</strong> UK<br />
electricity system to handle <strong>the</strong> predicted variations in<br />
power caused by increasing scales of wind capacity.<br />
The results show that <strong>the</strong> current mix of generating<br />
plant will be unable to ensure reliable electricity<br />
supply with significantly more than 10 GW of wind<br />
capacity. For larger wind capacity to be managed<br />
successfully, up to 10 GW of fast-response generating<br />
plant or controllable load will be needed to balance<br />
<strong>the</strong> electricity system. Electricity interconnection with<br />
mainland Europe would offer some fast-response<br />
capability, but would be unlikely to offer predictable<br />
support. Without additional fast-response balancing<br />
facilities, significant numbers of UK electricity<br />
consumers could regularly experience interruptions or<br />
a drop in voltage.<br />
If a large wind contribution is introduced early in <strong>the</strong><br />
period, <strong>the</strong>n significant fast-response generating<br />
capacity must also be installed. Later in <strong>the</strong> period,<br />
<strong>the</strong>re is a synergy with <strong>the</strong> large controllable demands<br />
of vehicle battery charging, so that very little additional<br />
balancing capacity would be required.<br />
Table 5 Potential major power plant types for installation in <strong>the</strong> UK to 2050<br />
Figure 11 Forward capacity of existing and committed plant 14<br />
14<br />
Derived from: Department for Business, Enterprise and Regulatory Reform, ‘DUKES Table 5.11: Power Stations in <strong>the</strong> United<br />
Kingdom (operational at <strong>the</strong> end of May 2008)’ 2008 and National Grid Company, ‘Transmission Entry Capacity (TEC) Data’ 2008.<br />
15<br />
Oswald J, Raine M, Ashraf-Ball H, ‘Will British Wea<strong>the</strong>r Provide Reliable Electricity?’ 2008.<br />
31:32
<strong>Powering</strong> <strong>the</strong> <strong>Future</strong> <strong>Summary</strong> <strong>Report</strong><br />
<strong>Powering</strong> <strong>the</strong> <strong>Future</strong> <strong>Summary</strong> <strong>Report</strong><br />
The second unavoidable consequence of higher levels<br />
of intermittent generation is its interaction with <strong>the</strong><br />
despatch of o<strong>the</strong>r power plant to match <strong>the</strong> varying<br />
daily demand for electricity. The demand pattern is<br />
characterised by three regimes: baseload (steady<br />
day and night), mid-merit (day-time only) and peak<br />
(shorter periods of high demand). A high penetration<br />
of intermittent renewable generation drastically reduces<br />
<strong>the</strong> baseload regime, undermining <strong>the</strong> economic<br />
case for more-efficient plant types with lower carbon<br />
emissions. This means that <strong>the</strong> most economic power<br />
plant will be those types with <strong>the</strong> lowest capital cost,<br />
favouring technologies with higher carbon emissions,<br />
such as open cycle gas turbines. But when operating<br />
with limited, irregular and less-predictable hours, such<br />
plant types are incompatible with <strong>the</strong> limitations of <strong>the</strong><br />
gas network, and would <strong>the</strong>refore need to use liquid<br />
fuel, probably diesel or kerosene, fur<strong>the</strong>r increasing<br />
CO 2 emissions.<br />
These findings indicate that a very high early<br />
penetration of wind generation is likely to have adverse<br />
effects on <strong>the</strong> rest of <strong>the</strong> generating fleet, undermining<br />
<strong>the</strong> benefits of an increased contribution of renewable<br />
electricity. They also highlight <strong>the</strong> problem faced<br />
by <strong>the</strong> industry, as private investment in new power<br />
plant must be guided by <strong>the</strong> appropriate economic<br />
signals to ensure that it meets <strong>the</strong> needs of a reliable,<br />
economic and low-carbon electricity system.<br />
In selecting <strong>the</strong> mix of plant for each scenario,<br />
<strong>Powering</strong> <strong>the</strong> <strong>Future</strong> takes account of <strong>the</strong> impact<br />
of higher proportions of intermittent renewable<br />
generation. Where <strong>the</strong>re are higher penetrations,<br />
fast-response generating plant is added to ensure that<br />
<strong>the</strong> system operates reliably. A minimum average<br />
utilisation of load-following plant is imposed to ensure<br />
that <strong>the</strong>re is sufficient revenue to cover <strong>the</strong> necessary<br />
investment.<br />
The second element of matching <strong>the</strong> power generation<br />
model to <strong>the</strong> needs of <strong>the</strong> o<strong>the</strong>r sectors is to ensure<br />
that annual electricity production covers demand and<br />
<strong>the</strong> modest losses in transmission and distribution. To<br />
achieve this balance of energy supply and demand for<br />
each year to 2050, we adjusted <strong>the</strong> utilisation of loadfollowing<br />
plant – typically CCGT plant. The resulting<br />
contributions of <strong>the</strong> various types of generating plant<br />
are illustrated for <strong>the</strong> reference scenario in figure13.<br />
Connecting new generating stations to <strong>the</strong> grid<br />
network and to consumers is a key element of adding<br />
new capacity to <strong>the</strong> UK electrical system. Most of<br />
<strong>the</strong> existing transmission networks were constructed<br />
more than 40 years ago and have been progressively<br />
uprated and reinforced since that time. Spare capacity<br />
is limited, and connections for new generating capacity<br />
in many areas of <strong>the</strong> country cannot be provided<br />
in less than five years as new transmission lines<br />
and substations must first be designed, permitted,<br />
purchased and installed. This issue is accentuated<br />
by <strong>the</strong> growth of coastal and offshore intermittent<br />
renewable generating capacity which is often remote<br />
from <strong>the</strong> main transmission network.<br />
Although <strong>the</strong> transmission and distribution networks<br />
face serious issues, <strong>the</strong>y can be resolved by<br />
appropriate investment. For <strong>the</strong> purpose of this<br />
study it has been assumed that <strong>the</strong> timing and<br />
scale of development of <strong>the</strong> electrical networks will<br />
not constrain <strong>the</strong> benefits from <strong>the</strong> CO 2 reduction<br />
measures.<br />
Figure 12 Installed compared with required capacity for <strong>the</strong> reference scenario<br />
Figure 13 Electricity production by generation technology<br />
33:34
<strong>Powering</strong> <strong>the</strong> <strong>Future</strong> <strong>Summary</strong> <strong>Report</strong><br />
<strong>Powering</strong> <strong>the</strong> <strong>Future</strong> <strong>Summary</strong> <strong>Report</strong><br />
Scenario analysis<br />
There is a wide range of potential outcomes to <strong>the</strong><br />
efforts to reduce CO 2 emissions in <strong>the</strong> different sectors.<br />
In order to provide a coherent assessment of some of<br />
<strong>the</strong> major directions that might be selected, <strong>Powering</strong><br />
<strong>the</strong> <strong>Future</strong> adopts a scenario approach. The overall<br />
assumptions made for each scenario are applied<br />
consistently across all sectors. The scenario analysis<br />
identifies those measures which are critical if <strong>the</strong> UK<br />
is to meet its climate change commitments. The<br />
consequences in terms of <strong>the</strong> scale and mix of power<br />
plant, <strong>the</strong> overall level of CO 2 emissions, and <strong>the</strong><br />
extent to which <strong>the</strong> UK would <strong>the</strong>n depend on critical<br />
technologies or fuels, are evaluated and compared for<br />
each scenario.<br />
Table 6 Scenario outcomes<br />
The scenario analysis evaluates <strong>the</strong> impacts of <strong>the</strong><br />
following measures:<br />
• renewable heat<br />
• large-scale application of CHP in industry<br />
• radical energy efficiency improvement in industry<br />
• nuclear power programme<br />
• CCS in industry and power generation<br />
• large-scale wind generation by 2020<br />
• extensive PV generation<br />
• improvement in building insulation<br />
• adoption of electric vehicles for transport<br />
The sensitivity of <strong>the</strong> level of CO 2 emissions to different<br />
rates of economic growth is tested in a fur<strong>the</strong>r scenario<br />
to provide a yardstick for <strong>the</strong> scale of improvement<br />
offered by <strong>the</strong> measures.<br />
35:36
<strong>Powering</strong> <strong>the</strong> <strong>Future</strong> <strong>Summary</strong> <strong>Report</strong><br />
<strong>Powering</strong> <strong>the</strong> <strong>Future</strong> <strong>Summary</strong> <strong>Report</strong><br />
Table 6 shows <strong>the</strong> scenarios considered in this<br />
report toge<strong>the</strong>r with <strong>the</strong> effect of <strong>the</strong> scenario on CO 2<br />
emissions and electricity production in 2050.<br />
The behaviour of each sector is modelled, with a base<br />
case modified by CO 2 emission reduction options.<br />
The sector behaviour in terms of fuel and electricity<br />
consumption and CO 2 emissions is calculated<br />
according to <strong>the</strong> CO 2 emission reduction options<br />
applicable in each scenario. The comparison of<br />
<strong>the</strong> measures in each sector review showed <strong>the</strong>ir<br />
individual impacts. In <strong>the</strong> analysis of each scenario,<br />
<strong>the</strong> interaction between <strong>the</strong> various measures is fully<br />
modelled. In this way, <strong>the</strong> effect that one measure has<br />
in reducing part of <strong>the</strong> sector energy consumption is<br />
properly reflected in <strong>the</strong> savings calculated for fur<strong>the</strong>r<br />
measures affecting <strong>the</strong> same energy consumption. For<br />
example, improved <strong>the</strong>rmal insulation in a commercial<br />
building will reduce <strong>the</strong> benefit of also applying a more<br />
efficient heating system.<br />
For each scenario, electricity sector CO 2 emissions<br />
are calculated from <strong>the</strong> utilisation of <strong>the</strong> various power<br />
plant types and aggregated with <strong>the</strong> emissions of <strong>the</strong><br />
consuming sectors to derive an overall CO 2 emission<br />
for <strong>the</strong> UK economy. The resulting curves of declining<br />
CO 2 emissions are typified by <strong>the</strong> reference scenario<br />
shown in figure 14.<br />
A similar aggregation of fuel consumptions by <strong>the</strong> five<br />
sectors allows <strong>the</strong> UK energy consumption profile to be<br />
derived for each scenario as shown in figure 15.<br />
Figure 14 Overall CO 2 emissions trend for UK by sector for reference scenario<br />
Figure 15 Overall fuel consumption trends for UK for reference scenario<br />
37:38
<strong>Powering</strong> <strong>the</strong> <strong>Future</strong> <strong>Summary</strong> <strong>Report</strong><br />
<strong>Powering</strong> <strong>the</strong> <strong>Future</strong> <strong>Summary</strong> <strong>Report</strong><br />
Scenario comparison<br />
As <strong>the</strong> baseline for <strong>the</strong> scenario analysis, <strong>the</strong> reference<br />
scenario delivers <strong>the</strong> following outcome:<br />
• achieves <strong>the</strong> 80% CO 2 reduction by 2050, with<br />
reductions of 34% by 2020 and 65% by 2030<br />
• applies lower confidence and potentially more costly<br />
carbon abatement technologies (such as CCS) at<br />
<strong>the</strong> lowest feasible level<br />
• requires historically high rates of construction of<br />
new generating plant to maintain reliable electricity<br />
supplies<br />
• requires <strong>the</strong> largest credible implementation of all<br />
selected measures across <strong>the</strong> different sectors<br />
• reduces consumption of all fossil fuels and depends<br />
on none for more than 25% or less than 12% of total<br />
primary energy consumption<br />
Considering first a straightforward comparison of <strong>the</strong><br />
outcomes of <strong>the</strong> scenarios, figure 16 shows <strong>the</strong> carbon<br />
emissions in 2050 for each scenario, while figure<br />
17 shows <strong>the</strong> total 2050 fuel consumption for each<br />
scenario.<br />
Comparison of <strong>the</strong> CO 2 emissions in figure 16 shows<br />
that <strong>the</strong> scenarios fall into two groups: those with CO 2<br />
emissions close to <strong>the</strong> commitment level, and those<br />
with significantly higher values. The scenarios with<br />
higher emissions warrant fur<strong>the</strong>r comment.<br />
The review of <strong>the</strong> results of <strong>the</strong> scenario analysis can<br />
be considered from two perspectives: as a test of <strong>the</strong><br />
acceptability of each scenario as an alternative to <strong>the</strong><br />
reference case, and as a means of evaluating each<br />
measure for its effectiveness. Both of <strong>the</strong>se alternative<br />
methods will be used to highlight significant results of<br />
<strong>the</strong> scenario analysis.<br />
Figure 16 CO 2 emissions in 2050 for <strong>the</strong> scenarios<br />
39:40
<strong>Powering</strong> <strong>the</strong> <strong>Future</strong> <strong>Summary</strong> <strong>Report</strong><br />
<strong>Powering</strong> <strong>the</strong> <strong>Future</strong> <strong>Summary</strong> <strong>Report</strong><br />
Scenario 2 – reduced renewable heat<br />
This scenario assumes reduced application of<br />
renewable heat technologies – biomass and solar<br />
heating. The consequence of this is an increase of<br />
16 MtCO 2 /yr in CO 2 emissions from <strong>the</strong> combustion of<br />
additional fossil fuel.<br />
Scenario 4 – no new nuclear programme<br />
With no new nuclear power plant, <strong>the</strong> electricity<br />
sector would substitute additional coal CCS and gasfuelled<br />
CCGT plant to replace <strong>the</strong> nuclear capacity.<br />
Despite <strong>the</strong> increased use of carbon capture, <strong>the</strong><br />
scenario exceeds <strong>the</strong> 80% CO 2 emissions reduction<br />
commitment by 12 MtCO 2 /yr as a result of an increase<br />
in coal consumption of over 60%.<br />
Scenario 5 – no CCS<br />
This scenario assumes that <strong>the</strong> electricity no longer<br />
available from carbon capture coal plant is met by<br />
increasing nuclear and gas-fired CCGT capacity. The<br />
scenario analysis shows that without CCS <strong>the</strong> CO 2<br />
emissions from <strong>the</strong> industry sector and electricity<br />
sector in 2050 exceed <strong>the</strong> commitment level by<br />
27 MtCO 2 /yr, ie by more than 24%.<br />
Scenario 7 – economic growth rate<br />
The increased economic activity pushes <strong>the</strong> CO 2<br />
emissions above <strong>the</strong> 2050 commitment level,<br />
increasing <strong>the</strong>m by nearly 20% above those of <strong>the</strong><br />
reference scenario, with coal consumption increased<br />
by 70% and oil by 30%.<br />
Scenario 8 – building insulation<br />
The omission of 50% of <strong>the</strong> improvement in building<br />
insulation included in <strong>the</strong> reference case results in<br />
significantly increased fuel and electricity consumption<br />
and CO 2 emissions. Despite <strong>the</strong> measures adopted,<br />
<strong>the</strong> scenario exceeds <strong>the</strong> CO 2 emission reduction<br />
commitment level by 12%.<br />
Scenario 9 – battery power adoption by cars<br />
and vans<br />
This scenario assumes a reduced adoption of electric<br />
vehicles, <strong>the</strong> effect of which is to reduce by 28% <strong>the</strong><br />
amount of fossil fuel displaced by electricity in <strong>the</strong><br />
transport sector. Despite <strong>the</strong> small reduction in CO 2<br />
emissions from <strong>the</strong> electricity sector, <strong>the</strong> increase in<br />
transport emissions causes <strong>the</strong> overall CO 2 emissions in<br />
2050 to exceed <strong>the</strong> commitment level by 39 MtCO 2 /yr<br />
or 35%. The additional fossil fuel consumption in<br />
<strong>the</strong> transport sector radically alters <strong>the</strong> profile of fuel<br />
consumption for this scenario in 2050, so that while<br />
coal and gas consumption falls, oil consumption<br />
doubles. Fuel dependence is increased, with oil<br />
representing 30% of primary energy consumption.<br />
Scenario 12 – unspecified industrial<br />
efficiency improvements<br />
In this scenario <strong>the</strong> 50% improvement in industrial<br />
process energy efficiency by 2050 assumed in <strong>the</strong><br />
reference scenario is excluded. CO 2 emissions are<br />
increased by 50 MtCO 2 /yr, exceeding <strong>the</strong> commitment<br />
level by 42%. The fuel consumption profile is<br />
significantly affected: coal consumption increases by<br />
105%, oil by 50% and gas by 30%. Fuel dependence<br />
rises, with coal increasing to over one third of primary<br />
energy supply.<br />
Review of effectiveness of measures<br />
The scenarios test <strong>the</strong> effect of selected changes in <strong>the</strong><br />
penetration of particular measures on CO 2 emissions<br />
and fuel consumption patterns. Since <strong>the</strong> changes in<br />
penetration of <strong>the</strong> measures are not <strong>the</strong> same, a fur<strong>the</strong>r<br />
stage of analysis is applied to normalise <strong>the</strong> results.<br />
This allows a proper comparison of <strong>the</strong> value of <strong>the</strong><br />
measures tested in <strong>the</strong> scenario analysis in reducing<br />
CO 2 emissions. The results of this analysis for 2050 are<br />
shown graphically in figure 18.<br />
This analysis highlights those individual measures<br />
which are critical to delivering <strong>the</strong> desired emission<br />
reductions. Since <strong>the</strong> reference case applies CO 2<br />
emission reduction measures at <strong>the</strong> maximum credible<br />
level in each sector, <strong>the</strong> omission of one large-value<br />
measure cannot be compensated in any o<strong>the</strong>r sector,<br />
causing a major breach of <strong>the</strong> 2050 CO 2 emission<br />
commitment. One feature of this analysis is that<br />
alternative low-carbon measures in <strong>the</strong> electricity sector<br />
appear to have low value, which belies <strong>the</strong>ir collective<br />
importance.<br />
Figure 17 Scenario fuel consumptions in 2050<br />
Figure 18 Value of measures to 2050 CO 2 emission reductions<br />
41:42
<strong>Powering</strong> <strong>the</strong> <strong>Future</strong> <strong>Summary</strong> <strong>Report</strong><br />
<strong>Powering</strong> <strong>the</strong> <strong>Future</strong> <strong>Summary</strong> <strong>Report</strong><br />
Figure 18 shows beyond doubt that <strong>the</strong> impact of<br />
conversion to electric vehicles is such that high priority<br />
should be given to converting <strong>the</strong> maximum number<br />
of vehicles by 2050, despite <strong>the</strong> increase in electricity<br />
consumption.<br />
The major impact of improved energy efficiency<br />
in industry is also highlighted. The task of halving<br />
energy consumption while maintaining economic<br />
growth, combined with <strong>the</strong> diverse nature of industry,<br />
means that substantial change in this sector is likely to<br />
require more than complex market incentives. Since<br />
<strong>the</strong> reference scenario assumes that <strong>the</strong> maximum<br />
improvements are achieved in every sector, <strong>the</strong>re are<br />
no effective alternatives in any sector to compensate<br />
for failure to achieve <strong>the</strong> necessary improvement<br />
in industry. Such a failure would result in <strong>the</strong> 2050<br />
commitment level being radically exceeded.<br />
The analysis demonstrates <strong>the</strong> significance of a<br />
group of measures of similar importance: renewable<br />
heat, building insulation, and CCS. Toge<strong>the</strong>r, <strong>the</strong>se<br />
measures represent close to 100% of <strong>the</strong> carbon<br />
emissions reduction commitment and are <strong>the</strong>refore<br />
critical to achieving it.<br />
Renewable heat, ie <strong>the</strong> use of biomass and solar<br />
energy for heating, is a recently identified element of<br />
government strategy. The importance of this measure<br />
is demonstrated here and is found to be strongly<br />
dependent on <strong>the</strong> effective use of our limited biomass<br />
fuel resources. These resources should be directed<br />
towards heating and CHP applications which make<br />
maximum use of <strong>the</strong> available renewable energy.<br />
Radical improvement in <strong>the</strong> level of insulation of<br />
existing homes and business premises can be seen to<br />
be very important. The necessary level of improvement<br />
is demanding and will require technical, economic<br />
and social support to ensure that effective measures<br />
are applied progressively to a very high proportion of<br />
existing buildings in <strong>the</strong> period to 2050.<br />
CCS technology has <strong>the</strong> potential to cut CO 2<br />
emissions in both <strong>the</strong> industry and electricity sectors.<br />
It is important that <strong>the</strong> current programme to apply<br />
<strong>the</strong> technology to power generation is extended to<br />
industrial processes. Appropriate support should<br />
be given to ensure that <strong>the</strong> capture of unavoidable<br />
carbon emissions from key industrial processes<br />
does not make it uneconomic for <strong>the</strong>m to operate<br />
in <strong>the</strong> UK. The alternative – effectively forcing <strong>the</strong>se<br />
processes offshore to locations which allow a more<br />
limited abatement of CO 2 emissions – will be entirely<br />
counterproductive from <strong>the</strong> perspective of climate<br />
change.<br />
Taken separately, <strong>the</strong> nuclear programme, PV<br />
generation and wind have a relatively low value<br />
as CO 2 emission reduction measures. This<br />
counterintuitive result is a consequence of <strong>the</strong> similarity<br />
in CO 2 emissions of this group of power generation<br />
technologies. Thus, for example, a reduced wind<br />
contribution can be compensated by an increased<br />
application of nuclear generation, or vice versa, with<br />
little change in CO 2 emissions. This result means that,<br />
from a CO 2 emission perspective, <strong>the</strong>se measures<br />
are valid alternatives and that <strong>the</strong> choice or balance<br />
between <strong>the</strong>m needs to be made on o<strong>the</strong>r grounds<br />
such as cost, fuel availability, and reliability and security<br />
of electricity supply. In fact, <strong>the</strong> collective contribution of<br />
<strong>the</strong>se measures is essential, offering over 100 MtCO 2 /yr<br />
reduction in electricity sector emissions.<br />
The small value for large-scale CHP is somewhat<br />
unexpected. It reflects <strong>the</strong> fact that <strong>the</strong> value of gasfuelled<br />
CHP as a CO 2 reduction measure declines<br />
once <strong>the</strong> carbon intensity of electricity produced in<br />
<strong>the</strong> electricity sector is radically reduced by 2050. The<br />
review of <strong>the</strong> results for 2020 in figure 19 enables CHP<br />
to be placed in a proper perspective.<br />
Figure 18 also provides a yardstick for <strong>the</strong> various<br />
measures in <strong>the</strong> form of a sensitivity comparison for<br />
a 1% increase in average economic growth rate.<br />
The sensitivity of outcome to economic growth rate<br />
suggests that <strong>the</strong> level of application of measures is<br />
likely to require adjustment during <strong>the</strong> period to correct<br />
for changes in economic growth rate.<br />
The 2020 situation<br />
The scenario analysis enables <strong>the</strong> value of measures<br />
to be assessed at different dates during <strong>the</strong> period<br />
to 2050. Figure 19 shows <strong>the</strong> calculated value of <strong>the</strong><br />
measures in 2020. Clearly <strong>the</strong>ir overall impact is lower,<br />
because of <strong>the</strong> practical rates of implementation of <strong>the</strong><br />
measures assumed by our model.<br />
A surprising result is that <strong>the</strong> value of building insulation<br />
in 2020 is comparable to its value in 2050, showing<br />
that this measure should be applied vigorously from<br />
<strong>the</strong> outset. The value of efficiency improvements<br />
in industry and <strong>the</strong> introduction of electricity to road<br />
transport are also seen to be high, deserving early and<br />
intensive work in <strong>the</strong>ir respective sectors.<br />
Industrial CHP has a significant and positive value in<br />
2020 which actually continues to increase until about<br />
2030. At this point <strong>the</strong> declining carbon intensity of<br />
production in <strong>the</strong> electricity sector generally starts to<br />
reduce <strong>the</strong> value of <strong>the</strong> measure to overall carbon<br />
emissions. This indicates that application of CHP in<br />
industry before 2025 is likely to be a valuable measure,<br />
whereas its later application is unlikely to contribute<br />
useful CO 2 reductions during <strong>the</strong> life of <strong>the</strong> equipment.<br />
In 2020, large-scale wind generation can be seen to<br />
have CO 2 benefits comparable to those for renewable<br />
heat. However <strong>the</strong> large scale of implementation<br />
of wind is accompanied by <strong>the</strong> intermittency issues<br />
discussed earlier, requiring substantial additional<br />
fast-response balancing facilities to enable <strong>the</strong> stable<br />
operation of <strong>the</strong> grid. Greater long-term benefits<br />
in terms of CO 2 emissions are seen to derive from<br />
renewable heat ra<strong>the</strong>r than <strong>the</strong> early application of<br />
large-scale wind generation.<br />
Figure 19 Value of measures to 2020 CO 2 emission reductions<br />
O<strong>the</strong>r measures including CCS, solar PV and new<br />
nuclear generation all offer limited benefits in 2020 as<br />
<strong>the</strong>ir scale of penetration is too limited to contribute<br />
significantly to CO 2 reduction.<br />
The contrast between <strong>the</strong> results for 2020 and 2050<br />
highlights <strong>the</strong> serious risk that early short-term<br />
technology policy decisions may have unintended and<br />
negative effects on <strong>the</strong> UK’s total CO 2 emissions in<br />
<strong>the</strong> longer term. It is essential that policies promoting<br />
particular measures are prepared in <strong>the</strong> light of<br />
longer-term strategy. In this way, opportunities for<br />
carbon reduction are exploited without blocking<br />
<strong>the</strong> future application of technologies which offer<br />
greater long-term reductions. Failure to coordinate<br />
strategy within and across <strong>the</strong> different sectors risks<br />
creating stranded assets and wasted resources.<br />
This reduces <strong>the</strong> likelihood of <strong>the</strong> UK achieving its<br />
challenging commitments, relinquishing <strong>the</strong> potential<br />
for international leadership and weakening <strong>the</strong><br />
international drive to limit <strong>the</strong> damage caused by<br />
climate change.<br />
43:44
For all enquiries relating to this report, please contact<br />
Maria Laffey, Marketing Communications Manager for<br />
<strong>Parsons</strong> <strong>Brinckerhoff</strong><br />
laffeym@pbworld.com<br />
44-(0)191-226-2565<br />
<strong>Parsons</strong> <strong>Brinckerhoff</strong><br />
Amber Court<br />
William Armstrong Drive<br />
Newcastle upon Tyne<br />
NE4 7YQ<br />
44-(0)191-226-2000<br />
Fax: 44-(0)191-226-2104<br />
www.pbworld.com