Powering the Future Summary Report - Parsons Brinckerhoff
Powering the Future Summary Report - Parsons Brinckerhoff
Powering the Future Summary Report - Parsons Brinckerhoff

Create successful ePaper yourself
Turn your PDF publications into a flip-book with our unique Google optimized e-Paper software.
<strong>Powering</strong> <strong>the</strong> <strong>Future</strong> <strong>Summary</strong> <strong>Report</strong><br />
<strong>Powering</strong> <strong>the</strong> <strong>Future</strong> <strong>Summary</strong> <strong>Report</strong><br />
Scenario 2 – reduced renewable heat<br />
This scenario assumes reduced application of<br />
renewable heat technologies – biomass and solar<br />
heating. The consequence of this is an increase of<br />
16 MtCO 2 /yr in CO 2 emissions from <strong>the</strong> combustion of<br />
additional fossil fuel.<br />
Scenario 4 – no new nuclear programme<br />
With no new nuclear power plant, <strong>the</strong> electricity<br />
sector would substitute additional coal CCS and gasfuelled<br />
CCGT plant to replace <strong>the</strong> nuclear capacity.<br />
Despite <strong>the</strong> increased use of carbon capture, <strong>the</strong><br />
scenario exceeds <strong>the</strong> 80% CO 2 emissions reduction<br />
commitment by 12 MtCO 2 /yr as a result of an increase<br />
in coal consumption of over 60%.<br />
Scenario 5 – no CCS<br />
This scenario assumes that <strong>the</strong> electricity no longer<br />
available from carbon capture coal plant is met by<br />
increasing nuclear and gas-fired CCGT capacity. The<br />
scenario analysis shows that without CCS <strong>the</strong> CO 2<br />
emissions from <strong>the</strong> industry sector and electricity<br />
sector in 2050 exceed <strong>the</strong> commitment level by<br />
27 MtCO 2 /yr, ie by more than 24%.<br />
Scenario 7 – economic growth rate<br />
The increased economic activity pushes <strong>the</strong> CO 2<br />
emissions above <strong>the</strong> 2050 commitment level,<br />
increasing <strong>the</strong>m by nearly 20% above those of <strong>the</strong><br />
reference scenario, with coal consumption increased<br />
by 70% and oil by 30%.<br />
Scenario 8 – building insulation<br />
The omission of 50% of <strong>the</strong> improvement in building<br />
insulation included in <strong>the</strong> reference case results in<br />
significantly increased fuel and electricity consumption<br />
and CO 2 emissions. Despite <strong>the</strong> measures adopted,<br />
<strong>the</strong> scenario exceeds <strong>the</strong> CO 2 emission reduction<br />
commitment level by 12%.<br />
Scenario 9 – battery power adoption by cars<br />
and vans<br />
This scenario assumes a reduced adoption of electric<br />
vehicles, <strong>the</strong> effect of which is to reduce by 28% <strong>the</strong><br />
amount of fossil fuel displaced by electricity in <strong>the</strong><br />
transport sector. Despite <strong>the</strong> small reduction in CO 2<br />
emissions from <strong>the</strong> electricity sector, <strong>the</strong> increase in<br />
transport emissions causes <strong>the</strong> overall CO 2 emissions in<br />
2050 to exceed <strong>the</strong> commitment level by 39 MtCO 2 /yr<br />
or 35%. The additional fossil fuel consumption in<br />
<strong>the</strong> transport sector radically alters <strong>the</strong> profile of fuel<br />
consumption for this scenario in 2050, so that while<br />
coal and gas consumption falls, oil consumption<br />
doubles. Fuel dependence is increased, with oil<br />
representing 30% of primary energy consumption.<br />
Scenario 12 – unspecified industrial<br />
efficiency improvements<br />
In this scenario <strong>the</strong> 50% improvement in industrial<br />
process energy efficiency by 2050 assumed in <strong>the</strong><br />
reference scenario is excluded. CO 2 emissions are<br />
increased by 50 MtCO 2 /yr, exceeding <strong>the</strong> commitment<br />
level by 42%. The fuel consumption profile is<br />
significantly affected: coal consumption increases by<br />
105%, oil by 50% and gas by 30%. Fuel dependence<br />
rises, with coal increasing to over one third of primary<br />
energy supply.<br />
Review of effectiveness of measures<br />
The scenarios test <strong>the</strong> effect of selected changes in <strong>the</strong><br />
penetration of particular measures on CO 2 emissions<br />
and fuel consumption patterns. Since <strong>the</strong> changes in<br />
penetration of <strong>the</strong> measures are not <strong>the</strong> same, a fur<strong>the</strong>r<br />
stage of analysis is applied to normalise <strong>the</strong> results.<br />
This allows a proper comparison of <strong>the</strong> value of <strong>the</strong><br />
measures tested in <strong>the</strong> scenario analysis in reducing<br />
CO 2 emissions. The results of this analysis for 2050 are<br />
shown graphically in figure 18.<br />
This analysis highlights those individual measures<br />
which are critical to delivering <strong>the</strong> desired emission<br />
reductions. Since <strong>the</strong> reference case applies CO 2<br />
emission reduction measures at <strong>the</strong> maximum credible<br />
level in each sector, <strong>the</strong> omission of one large-value<br />
measure cannot be compensated in any o<strong>the</strong>r sector,<br />
causing a major breach of <strong>the</strong> 2050 CO 2 emission<br />
commitment. One feature of this analysis is that<br />
alternative low-carbon measures in <strong>the</strong> electricity sector<br />
appear to have low value, which belies <strong>the</strong>ir collective<br />
importance.<br />
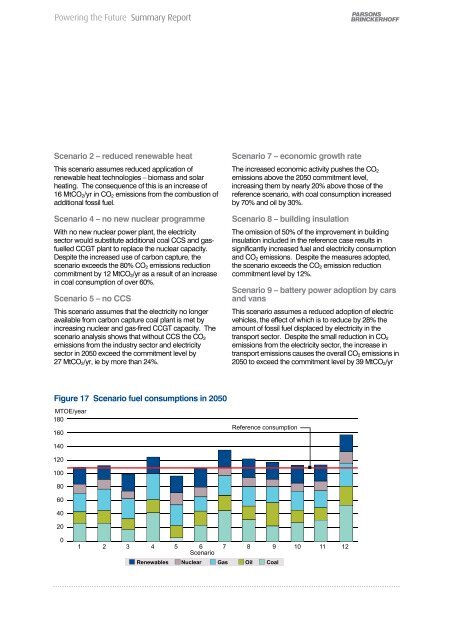
Figure 17 Scenario fuel consumptions in 2050<br />
Figure 18 Value of measures to 2050 CO 2 emission reductions<br />
41:42