June 2011 - Parsons Brinckerhoff
June 2011 - Parsons Brinckerhoff
June 2011 - Parsons Brinckerhoff

You also want an ePaper? Increase the reach of your titles
YUMPU automatically turns print PDFs into web optimized ePapers that Google loves.
Perspectives<br />
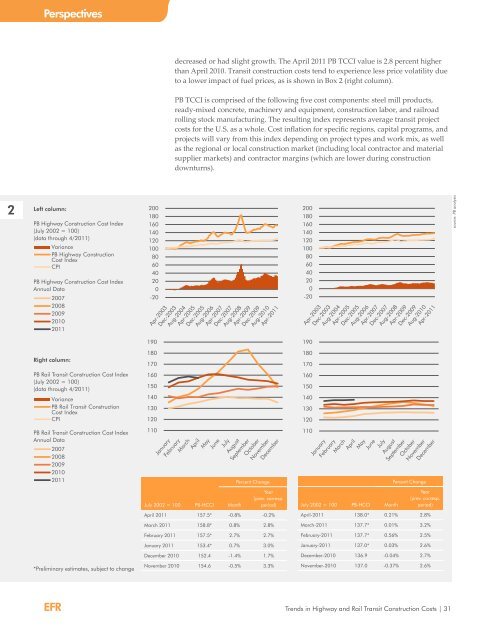
decreased or had slight growth. The April <strong>2011</strong> PB TCCI value is 2.8 percent higher<br />
than April 2010. Transit construction costs tend to experience less price volatility due<br />
to a lower impact of fuel prices, as is shown in Box 2 (right column).<br />
PB TCCI is comprised of the following five cost components: steel mill products,<br />
ready-mixed concrete, machinery and equipment, construction labor, and railroad<br />
rolling stock manufacturing. The resulting index represents average transit project<br />
costs for the U.S. as a whole. Cost inflation for specific regions, capital programs, and<br />
projects will vary from this index depending on project types and work mix, as well<br />
as the regional or local construction market (including local contractor and material<br />
supplier markets) and contractor margins (which are lower during construction<br />
downturns).<br />
2<br />
Left column:<br />
PB Highway Construction Cost Index<br />
(July 2002 = 100)<br />
(data through 4/<strong>2011</strong>)<br />
Variance<br />
PB Highway Construction<br />
Cost Index<br />
CPI<br />
PB Highway Construction Cost Index<br />
Annual Data<br />
2007<br />
2008<br />
2009<br />
2010<br />
<strong>2011</strong><br />
200<br />
180<br />
160<br />
140<br />
120<br />
100<br />
80<br />
60<br />
40<br />
20<br />
0<br />
-20<br />
200<br />
180<br />
160<br />
140<br />
120<br />
100<br />
80<br />
60<br />
40<br />
20<br />
0<br />
-20<br />
source: PB analysis<br />
Right column:<br />
PB Rail Transit Construction Cost Index<br />
(July 2002 = 100)<br />
(data through 4/<strong>2011</strong>)<br />
Variance<br />
PB Rail Transit Construction<br />
Cost Index<br />
CPI<br />
PB Rail Transit Construction Cost Index<br />
Annual Data<br />
2007<br />
2008<br />
2009<br />
2010<br />
<strong>2011</strong><br />
*Preliminary estimates, subject to change<br />
190<br />
180<br />
170<br />
160<br />
150<br />
140<br />
130<br />
120<br />
110<br />
July 2002 = 100 PB-HCCI Month<br />
Percent Change<br />
Year<br />
(prev. corresp.<br />
period)<br />
April <strong>2011</strong> 157.5* -0.8% -0.2%<br />
March <strong>2011</strong> 158.8* 0.8% 2.8%<br />
February <strong>2011</strong> 157.5* 2.7% 2.7%<br />
January <strong>2011</strong> 153.4* 0.7% 3.0%<br />
December 2010 152.4 -1.4% 1.7%<br />
November 2010 154.6 -0.5% 3.3%<br />
190<br />
180<br />
170<br />
160<br />
150<br />
140<br />
130<br />
120<br />
110<br />
July 2002 = 100 PB-HCCI Month<br />
Percent Change<br />
Year<br />
(prev. corresp.<br />
period)<br />
April-<strong>2011</strong> 138.0* 0.21% 2.8%<br />
March-<strong>2011</strong> 137.7* 0.01% 3.2%<br />
February-<strong>2011</strong> 137.7* 0.56% 2.5%<br />
January-<strong>2011</strong> 137.0* 0.03% 2.6%<br />
December-2010 136.9 -0.04% 2.7%<br />
November-2010 137.0 -0.37% 2.6%<br />
EFR Trends in Highway and Rail Transit Construction Costs | 31