June 2011 - Parsons Brinckerhoff
June 2011 - Parsons Brinckerhoff
June 2011 - Parsons Brinckerhoff

You also want an ePaper? Increase the reach of your titles
YUMPU automatically turns print PDFs into web optimized ePapers that Google loves.
Articles<br />
First, the user can identify the project<br />
alternative that seems to yield<br />
the maximum net benefit from a<br />
sustainability perspective, as opposed<br />
to a traditional benefit-cost analysis<br />
(i.e., include only economic benefits).<br />
In this example, using traditional<br />
benefit-cost analysis, the preferred<br />
alternative would be Alternative 1, the<br />
arterial option, which would have had<br />
a benefit-cost ratio of 2.53. However,<br />
using the PRISM tblv analysis,<br />
Alternative 3, the parkway option,<br />
becomes more attractive with a benefitcost<br />
ratio of 2.70 (Box 3).<br />
Second, the user can identify the<br />
individual contributions of the<br />
respective benefit categories. This<br />
allows users to identify the most (and<br />
least) important benefit categories and<br />
get a quantitative sense of the tradeoffs<br />
involved in community cohesion versus<br />
strict mobility (Box 3).<br />
3<br />
PRISM Illustrative Example (net present value $)<br />
Category<br />
Build Alternative 1<br />
Surface Arterial<br />
Build Alternative 2<br />
Urban Boulevard<br />
Build Alternative 3<br />
Park/Parkway<br />
Environmental<br />
GHG emissions, CO 2<br />
($/metric ton) $2,400,000 $2,000,000 $2,300,000<br />
Stormwater net improvement less costs $3,000,000 $2,000,000 $8,000,000<br />
Habitat $100,000 $0 $1,000,000<br />
Wetlands, high quality created ($/acre) $500,000 $0 $10,000,000<br />
Total environmental $6,000,000 $4,000,000 $21,300,000<br />
Social<br />
Walkability ($/person mile) ($3,000,000) $3,500,000 $5,000,000<br />
Neighborhood cohesion ($/person) ($5,000,000) $3,000,000 $2,000,000<br />
Pedestrian/bicycle access ($3,000,000) $4,000,000 $4,000,000<br />
Park/recreation facilities created ($/acre) $0 $2,000,000 $30,000,000<br />
Total social ($11,000,000) $12,500,000 $41,000,000<br />
Economic<br />
Commercial travel time savings ($/hour) $24,000,000 $18,000,000 $22,000,000<br />
Commute travel cost savings peak, high income ($/hour) $40,000,000 $30,000,000 $36,000,000<br />
Commute travel cost savings peak, medium income ($/hour) $80,000,000 $60,000,000 $75,000,000<br />
Commute travel cost savings peak, low Income income ($/hour) $8,000,000 $6,000,000 $7,000,000<br />
Total economic $152,000,000 $114,000,000 $140,000,000<br />
Results<br />
Cumulative total present value: benefits $147,000,000 $130,500,000 $202,300,000<br />
Cumulative total present value: costs $60,000,000 $100,000,000 $75,000,000<br />
Net present value (PV benefits - PV costs) $87,000,000 $30,500,000 $127,300,000<br />
BC ratio (tblv) 2.45 1.31 2.70<br />
BC ratio (only economic category) 2.53 1.14 1.87<br />
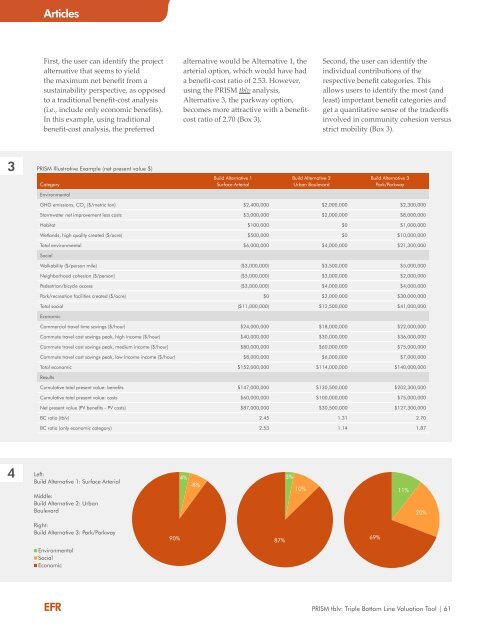
4 Left:<br />
Build Alternative 1: Surface Arterial<br />
Middle:<br />
Build Alternative 2: Urban<br />
Boulevard<br />
4%<br />
-8%<br />
3%<br />
10%<br />
11%<br />
20%<br />
Right:<br />
Build Alternative 3: Park/Parkway<br />
90%<br />
87%<br />
69%<br />
Environmental<br />
Social<br />
Economic<br />
EFR PRISM tblv: Triple Bottom Line Valuation Tool | 61<br />
11%