2010 FERC Form 1 - Pacific Gas and Electric Company
2010 FERC Form 1 - Pacific Gas and Electric Company
2010 FERC Form 1 - Pacific Gas and Electric Company

Create successful ePaper yourself
Turn your PDF publications into a flip-book with our unique Google optimized e-Paper software.
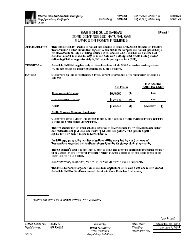
<strong>FERC</strong> FORM NO. 1 (REV. 12-03) Page 406.6<br />
Name of Respondent<br />
This Report Is:<br />
Date of Report<br />
(1) X An Original<br />
(Mo, Da, Yr)<br />
PACIFIC GAS AND ELECTRIC COMPANY<br />
(2) A Resubmission<br />
04/08/2011<br />
HYDROELECTRIC GENERATING PLANT STATISTICS (Large Plants)<br />
Year/Period of Report<br />
End of<br />
<strong>2010</strong>/Q4<br />
1. Large plants are hydro plants of 10,000 Kw or more of installed capacity (name plate ratings)<br />
2. If any plant is leased, operated under a license from the Federal Energy Regulatory Commission, or operated as a joint facility, indicate such facts in<br />
a footnote. If licensed project, give project number.<br />
3. If net peak dem<strong>and</strong> for 60 minutes is not available, give that which is available specifying period.<br />
4. If a group of employees attends more than one generating plant, report on line 11 the approximate average number of employees assignable to each<br />
plant.<br />
Line<br />
No.<br />
Item<br />
(a)<br />
<strong>FERC</strong> Licensed Project No.<br />
Plant Name: POE<br />
(b)<br />
2107<br />
<strong>FERC</strong> Licensed Project No. 1962<br />
Plant Name: ROCK CREEK<br />
(c)<br />
1 Kind of Plant (Run-of-River or Storage)<br />
R of R/Storage R of R/Storage<br />
2 Plant Construction type (Conventional or Outdoor)<br />
Outdoor Conventional<br />
3 Year Originally Constructed<br />
1958 1950<br />
4 Year Last Unit was Installed<br />
1958 1950<br />
5 Total installed cap (Gen name plate Rating in MW)<br />
142.83 124.74<br />
6 Net Peak Dem<strong>and</strong> on Plant-Megawatts (60 minutes)<br />
120 112<br />
7 Plant Hours Connect to Load<br />
7,255 8,747<br />
8 Net Plant Capability (in megawatts)<br />
9 (a) Under Most Favorable Oper Conditions<br />
120 112<br />
10 (b) Under the Most Adverse Oper Conditions<br />
125 114<br />
11 Average Number of Employees<br />
0 6<br />
12 Net Generation, Exclusive of Plant Use - Kwh<br />
531,552,676 424,874,953<br />
13 Cost of Plant<br />
14 L<strong>and</strong> <strong>and</strong> L<strong>and</strong> Rights<br />
817,824 1,770,950<br />
15 Structures <strong>and</strong> Improvements<br />
2,138,275 3,668,080<br />
16 Reservoirs, Dams, <strong>and</strong> Waterways<br />
32,944,749 41,369,289<br />
17 Equipment Costs<br />
12,773,740 7,668,388<br />
18 Roads, Railroads, <strong>and</strong> Bridges<br />
1,146,684 353,339<br />
19 Asset Retirement Costs<br />
0 0<br />
20 TOTAL cost (Total of 14 thru 19)<br />
49,821,272 54,830,046<br />
21 Cost per KW of Installed Capacity (line 20 / 5)<br />
348.8152 439.5546<br />
22 Production Expenses<br />
23 Operation Supervision <strong>and</strong> Engineering<br />
0 0<br />
24 Water for Power<br />
106,290 99,212<br />
25 Hydraulic Expenses<br />
21,701 20,867<br />
26 <strong>Electric</strong> Expenses<br />
315,157 1,240,791<br />
27 Misc Hydraulic Power Generation Expenses<br />
665,528 1,314,824<br />
28 Rents<br />
45,364 31,520<br />
29 Maintenance Supervision <strong>and</strong> Engineering<br />
0 0<br />
30 Maintenance of Structures<br />
73,080 93,133<br />
31 Maintenance of Reservoirs, Dams, <strong>and</strong> Waterways<br />
832,048 382,779<br />
32 Maintenance of <strong>Electric</strong> Plant<br />
520,611 279,602<br />
33 Maintenance of Misc Hydraulic Plant<br />
115,918 67,819<br />
34 Total Production Expenses (total 23 thru 33)<br />
2,695,697 3,530,547<br />
35 Expenses per net KWh<br />
0.0051 0.0083