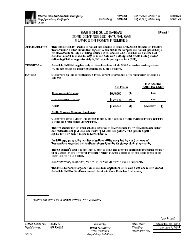
SELECTED FINANCIAL DATA - CLASS A, B, C, AND D ELECTRIC UTILITIES PACIFIC GAS AND ELECTRIC COMPANY PERSON RESPONSIBLE FOR THIS REPORT: Dinyar Mistry, Vice President <strong>and</strong> Controller (PREPARED FROM INFORMATION IN THE <strong>2010</strong> <strong>FERC</strong> ANNUAL REPORTS) NET ELECTRIC PLANT INVESTMENT (a) December 31 2009 <strong>2010</strong> Annual Average <strong>Electric</strong> Utility Plant (California Only) 1. Intangible Plant $ 653,039,599 $ 721,028,719 $ 687,034,159 2. L<strong>and</strong> <strong>and</strong> L<strong>and</strong> Rights 497,822,413 527,291,709 512,557,061 3. Depreciable Plant 35,727,479,364 38,594,149,912 37,160,814,638 4. Nuclear Fuel 1,995,799,030 2,153,305,377 2,074,552,204 5. Gross <strong>Electric</strong> Utility Plant 38,874,140,406 41,995,775,717 40,434,958,062 6. <strong>Electric</strong> Plant Held for Future Use - Net 0 0 0 7. Construction Work in Progress - <strong>Electric</strong> 1,647,820,850 1,202,202,048 1,425,011,449 8. Accumulated Deferred Income Taxes 464,662,038 628,483,184 546,572,611 9. Less: Reserves for Depreciation - <strong>Electric</strong> Utility Plant 18,350,492,520 18,894,048,491 18,622,270,506 10. Less: Amortization <strong>and</strong> Depletion Reserves 1,852,590,968 1,998,657,166 1,925,624,067 11. Less: Customer Advances <strong>and</strong> Contribution in Aid of Construction 118,256,777 110,480,707 114,368,742 12. Less: Accumulated Deferred Income <strong>and</strong> Investment Tax Credits 5,150,157,362 5,988,944,882 5,569,551,122 13. Material <strong>and</strong> Supplies - <strong>Electric</strong> Only 126,256,678 130,995,767 128,626,223 14. Net <strong>Electric</strong> Plant Investment $ 15,641,382,345 $ 16,965,325,470 $ 16,303,353,908 CAPITALIZATION (Total <strong>Company</strong>) 15. Common Stock $ 1,321,874,045 $ 1,321,874,045 $ 1,321,874,045 16. Capital Stock (Premium, Discount <strong>and</strong> Expense)-Net 1,769,325,445 1,769,325,445 1,769,325,445 17. Other Paid in Capital 1,285,216,984 1,471,315,126 1,378,266,055 18. Retained Earnings 6,551,008,147 6,900,585,718 6,725,796,933 19. Other Miscellaneous Capital Accounts 0 0 0 20. Common Stock <strong>and</strong> Equity (Lines 15 through 19) 10,927,424,621 11,463,100,334 11,195,262,478 21. Preferred Stock 257,994,575 257,994,575 257,994,575 22. Long-Term Debt 11,356,922,217 12,201,402,470 11,779,162,344 23. Notes Payable <strong>and</strong> Current Portion of Long-Term Debt 833,000,000 853,033,000 843,016,500 24. Total Capitalization (Lines 20 through 23) $ 23,375,341,413 $ 24,775,530,379 $ 24,075,435,897 (a) Includes Common Plant Allocations. - Page 600
PACIFIC GAS AND ELECTRIC COMPANY INCOME STATEMENT DATA FOR CALIFORNIA INTRASTATE ELECTRIC OPERATIONS ONLY (b) Annual Amount 25. Operating Revenues 10,631,037,641 26. Operating <strong>and</strong> Maintenance Expense 6,735,737,302 27. Depreciation 996,093,798 28. Depreciation for Asset Retirement Costs - 29. Amortization <strong>and</strong> Depletion Expenses <strong>and</strong> Property Losses 138,803,626 30. Regulatory Debits 387,947,799 31. Regulatory Credits 63 32. Property Taxes (Ad Valorem) 194,310,400 33. Taxes Other than Income <strong>and</strong> Property Taxes 89,937,265 34. Operating Revenue Deductions (Before Federal <strong>and</strong> California Income Taxes) 8,542,830,253 35. Federal <strong>and</strong> California Income Taxes - Net 531,105,074 36. Gains <strong>and</strong> Losses from Disposition of <strong>Electric</strong> Plant - Net (1,199,581) 37. Accretion Expense - 38. Total Utility Operating Expenses 9,072,735,746 39. Net Operating Income (California Intrastate <strong>Electric</strong> Operations Only) 1,558,301,895 OTHER INCOME AND EXPENSE (Total <strong>Company</strong>) 40. Net Operating Income from Other Utility Operations (Total) 276,009,068 41. Net Other Income <strong>and</strong> Deductions (91,592,428) 42. Income Before Interest Charges 1,742,718,535 43. Interest Charges 621,744,831 44. Income Before Extraordinary Items 1,120,973,704 45. Extraordinary Items - Net of Income Tax - 46. Net Income 1,120,973,704 47. Preferred Stock Dividends <strong>and</strong> Redemption Premium 13,916,365 48. Income Available for Common Stock $ 1,107,057,339 49. Common Stock Dividends 716,000,000 OTHER DATA (CALIFORNIA INTRASTATE ELECTRIC OPERATIONS ONLY) (b) Items (48-50) 50. Payroll Charged to Operating <strong>and</strong> Maintenance Expense $ 994,575,373 51. Payroll Capitalized to Utility Plant - <strong>Electric</strong> 400,607,268 52.Total Payroll $ 1,395,182,641 53. Purchased Power $ 3,633,537,677 54. Allowance for Funds Used During Construction $ 139,777,700 55. Interdepartmental Revenues $ 22,540,420 56. Interdepartmental Expenses $ 123,351,684 57. Revenue from Sales to Residential Customers $ 4,795,501,768 58. Residential Sales in Kwhs 30,744,336,000 59. Total Revenue Sales to Ultimate Customers $ 11,879,407,723 60. Kwhs Sold to Ultimate Customers 84,064,481,000 61. Average Number of Residential Customers 4,565,637 62. Average Number of Ultimate Customers 5,212,596 (b) Assumes CPUC Jurisdictional Portion of <strong>Electric</strong> Operations. Page 601
- Page 1:
2010 ANNUAL REPORT of Pacific Gas a
- Page 5 and 6:
Name of Respondent PACIFIC GAS AND
- Page 7 and 8:
Name of Respondent PACIFIC GAS AND
- Page 9 and 10:
Name of Respondent PACIFIC GAS AND
- Page 11 and 12:
Name of Respondent PACIFIC GAS AND
- Page 13 and 14:
Name of Respondent PACIFIC GAS AND
- Page 15 and 16:
Name of Respondent PACIFIC GAS AND
- Page 17 and 18:
Name of Respondent PACIFIC GAS AND
- Page 19 and 20:
Name of Respondent PACIFIC GAS AND
- Page 21 and 22:
Name of Respondent PACIFIC GAS AND
- Page 23 and 24:
Name of Respondent PACIFIC GAS AND
- Page 25 and 26:
Name of Respondent PACIFIC GAS AND
- Page 27 and 28:
Name of Respondent This Report Is:
- Page 29 and 30:
Name of Respondent PACIFIC GAS AND
- Page 31 and 32:
Name of Respondent PACIFIC GAS AND
- Page 33 and 34:
Name of Respondent PACIFIC GAS AND
- Page 35 and 36:
Name of Respondent PACIFIC GAS AND
- Page 37 and 38:
Name of Respondent PACIFIC GAS AND
- Page 39 and 40:
Name of Respondent PACIFIC GAS AND
- Page 41 and 42:
Name of Respondent PACIFIC GAS AND
- Page 43 and 44:
Name of Respondent PACIFIC GAS AND
- Page 45 and 46:
Name of Respondent PACIFIC GAS AND
- Page 47 and 48:
Name of Respondent PACIFIC GAS AND
- Page 49 and 50:
Name of Respondent PACIFIC GAS AND
- Page 51 and 52:
Name of Respondent PACIFIC GAS AND
- Page 53 and 54:
Name of Respondent PACIFIC GAS AND
- Page 55 and 56:
Name of Respondent PACIFIC GAS AND
- Page 57 and 58:
Name of Respondent PACIFIC GAS AND
- Page 59 and 60:
Name of Respondent PACIFIC GAS AND
- Page 61 and 62:
Name of Respondent PACIFIC GAS AND
- Page 63 and 64:
Name of Respondent PACIFIC GAS AND
- Page 65 and 66:
Name of Respondent PACIFIC GAS AND
- Page 67 and 68:
Name of Respondent PACIFIC GAS AND
- Page 69 and 70:
Name of Respondent PACIFIC GAS AND
- Page 71 and 72:
Name of Respondent PACIFIC GAS AND
- Page 73 and 74:
Name of Respondent PACIFIC GAS AND
- Page 75 and 76:
Name of Respondent PACIFIC GAS AND
- Page 77 and 78:
Name of Respondent PACIFIC GAS AND
- Page 79 and 80:
Name of Respondent PACIFIC GAS AND
- Page 81 and 82:
Name of Respondent PACIFIC GAS AND
- Page 83 and 84:
Name of Respondent PACIFIC GAS AND
- Page 85 and 86:
Name of Respondent PACIFIC GAS AND
- Page 87 and 88:
Name of Respondent PACIFIC GAS AND
- Page 89 and 90:
Name of Respondent PACIFIC GAS AND
- Page 91 and 92:
Name of Respondent PACIFIC GAS AND
- Page 93 and 94:
Name of Respondent PACIFIC GAS AND
- Page 95 and 96:
Name of Respondent PACIFIC GAS AND
- Page 97 and 98:
Name of Respondent PACIFIC GAS AND
- Page 99 and 100:
Name of Respondent PACIFIC GAS AND
- Page 101 and 102:
Name of Respondent This Report Is:
- Page 103 and 104:
Name of Respondent This Report Is:
- Page 105 and 106:
Name of Respondent This Report Is:
- Page 107 and 108:
Name of Respondent PACIFIC GAS AND
- Page 109 and 110:
Name of Respondent PACIFIC GAS AND
- Page 111 and 112:
Name of Respondent This Report Is:
- Page 113 and 114:
Name of Respondent This Report Is:
- Page 115 and 116:
Name of Respondent This Report Is:
- Page 117 and 118:
Name of Respondent PACIFIC GAS AND
- Page 119 and 120:
Name of Respondent PACIFIC GAS AND
- Page 121 and 122:
Name of Respondent This Report Is:
- Page 126 and 127:
Name of Respondent PACIFIC GAS AND
- Page 128 and 129:
Name of Respondent PACIFIC GAS AND
- Page 130 and 131:
Name of Respondent PACIFIC GAS AND
- Page 132 and 133:
Name of Respondent PACIFIC GAS AND
- Page 134 and 135:
Name of Respondent PACIFIC GAS AND
- Page 136 and 137:
Name of Respondent PACIFIC GAS AND
- Page 138 and 139:
Name of Respondent PACIFIC GAS AND
- Page 140 and 141:
Name of Respondent PACIFIC GAS AND
- Page 142 and 143:
Name of Respondent PACIFIC GAS AND
- Page 144 and 145:
Name of Respondent PACIFIC GAS AND
- Page 146 and 147:
Name of Respondent PACIFIC GAS AND
- Page 148 and 149:
Name of Respondent PACIFIC GAS AND
- Page 150 and 151:
Name of Respondent This Report Is:
- Page 152 and 153:
Name of Respondent PACIFIC GAS AND
- Page 154 and 155:
Name of Respondent PACIFIC GAS AND
- Page 156 and 157:
Name of Respondent This Report Is:
- Page 158 and 159:
Name of Respondent This Report Is:
- Page 160 and 161:
Name of Respondent This Report Is:
- Page 162 and 163:
Name of Respondent PACIFIC GAS AND
- Page 164 and 165:
Name of Respondent This Report Is:
- Page 166 and 167:
Name of Respondent PACIFIC GAS AND
- Page 168 and 169:
Name of Respondent PACIFIC GAS AND
- Page 170 and 171:
Name of Respondent PACIFIC GAS AND
- Page 172 and 173:
Name of Respondent PACIFIC GAS AND
- Page 174 and 175:
Name of Respondent PACIFIC GAS AND
- Page 176 and 177:
Name of Respondent PACIFIC GAS AND
- Page 178 and 179:
Name of Respondent PACIFIC GAS AND
- Page 180 and 181:
Name of Respondent PACIFIC GAS AND
- Page 182 and 183:
Name of Respondent PACIFIC GAS AND
- Page 184 and 185:
Name of Respondent PACIFIC GAS AND
- Page 186 and 187:
Name of Respondent PACIFIC GAS AND
- Page 188 and 189:
Name of Respondent PACIFIC GAS AND
- Page 190 and 191:
Name of Respondent PACIFIC GAS AND
- Page 192 and 193:
Name of Respondent PACIFIC GAS AND
- Page 194 and 195:
Name of Respondent PACIFIC GAS AND
- Page 196 and 197:
Name of Respondent PACIFIC GAS AND
- Page 198 and 199:
Name of Respondent PACIFIC GAS AND
- Page 200 and 201:
Name of Respondent PACIFIC GAS AND
- Page 202 and 203:
Name of Respondent PACIFIC GAS AND
- Page 204 and 205:
Name of Respondent PACIFIC GAS AND
- Page 206 and 207:
Name of Respondent PACIFIC GAS AND
- Page 208 and 209:
Name of Respondent PACIFIC GAS AND
- Page 210 and 211:
Name of Respondent PACIFIC GAS AND
- Page 212 and 213:
Name of Respondent PACIFIC GAS AND
- Page 214 and 215:
Name of Respondent PACIFIC GAS AND
- Page 216 and 217:
Name of Respondent PACIFIC GAS AND
- Page 218 and 219:
Name of Respondent PACIFIC GAS AND
- Page 220 and 221:
Name of Respondent PACIFIC GAS AND
- Page 222 and 223:
Name of Respondent PACIFIC GAS AND
- Page 224 and 225:
Name of Respondent PACIFIC GAS AND
- Page 226 and 227:
Name of Respondent PACIFIC GAS AND
- Page 228 and 229:
Name of Respondent PACIFIC GAS AND
- Page 230 and 231:
Name of Respondent PACIFIC GAS AND
- Page 232 and 233:
Name of Respondent PACIFIC GAS AND
- Page 234 and 235:
Name of Respondent PACIFIC GAS AND
- Page 236 and 237:
Name of Respondent PACIFIC GAS AND
- Page 238 and 239:
Name of Respondent PACIFIC GAS AND
- Page 240 and 241:
Name of Respondent PACIFIC GAS AND
- Page 242 and 243:
Name of Respondent PACIFIC GAS AND
- Page 244 and 245:
Name of Respondent This Report Is:
- Page 246 and 247:
Name of Respondent This Report Is:
- Page 248 and 249:
Name of Respondent PACIFIC GAS AND
- Page 250 and 251:
Name of Respondent PACIFIC GAS AND
- Page 252 and 253:
Name of Respondent This Report Is:
- Page 254 and 255:
Name of Respondent This Report Is:
- Page 256 and 257:
Name of Respondent PACIFIC GAS AND
- Page 258 and 259:
Name of Respondent PACIFIC GAS AND
- Page 260 and 261:
Name of Respondent This Report Is:
- Page 262 and 263:
Name of Respondent PACIFIC GAS AND
- Page 264 and 265:
Name of Respondent PACIFIC GAS AND
- Page 266 and 267:
Name of Respondent PACIFIC GAS AND
- Page 268 and 269:
Name of Respondent PACIFIC GAS AND
- Page 270 and 271:
Name of Respondent PACIFIC GAS AND
- Page 272 and 273:
Name of Respondent PACIFIC GAS AND
- Page 274 and 275:
Name of Respondent This Report Is:
- Page 276 and 277:
Name of Respondent PACIFIC GAS AND
- Page 278 and 279:
Name of Respondent PACIFIC GAS AND
- Page 280 and 281:
Name of Respondent This Report Is:
- Page 282 and 283:
FERC FORM NO. 1 (REV. 12-03) Page 4
- Page 284 and 285:
FERC FORM NO. 1 (REV. 12-03) Page 4
- Page 286 and 287:
FERC FORM NO. 1 (REV. 12-03) Page 4
- Page 288 and 289:
FERC FORM NO. 1 (REV. 12-03) Page 4
- Page 290 and 291:
FERC FORM NO. 1 (REV. 12-03) Page 4
- Page 292 and 293:
Name of Respondent This Report Is:
- Page 294 and 295:
Name of Respondent This Report Is:
- Page 296 and 297:
Name of Respondent This Report Is:
- Page 298 and 299:
Name of Respondent This Report Is:
- Page 300 and 301:
Name of Respondent PACIFIC GAS AND
- Page 302 and 303:
Name of Respondent PACIFIC GAS AND
- Page 304 and 305:
Name of Respondent This Report Is:
- Page 306 and 307:
Name of Respondent This Report Is:
- Page 308 and 309:
Name of Respondent PACIFIC GAS AND
- Page 310 and 311:
Name of Respondent PACIFIC GAS AND
- Page 312 and 313:
Name of Respondent PACIFIC GAS AND
- Page 314 and 315:
Name of Respondent PACIFIC GAS AND
- Page 316 and 317:
Name of Respondent PACIFIC GAS AND
- Page 318 and 319:
Name of Respondent PACIFIC GAS AND
- Page 320 and 321:
Name of Respondent PACIFIC GAS AND
- Page 322 and 323:
Name of Respondent PACIFIC GAS AND
- Page 324 and 325:
Name of Respondent PACIFIC GAS AND
- Page 326 and 327:
Name of Respondent PACIFIC GAS AND
- Page 328 and 329:
Name of Respondent PACIFIC GAS AND
- Page 330 and 331:
Name of Respondent PACIFIC GAS AND
- Page 332 and 333: Name of Respondent PACIFIC GAS AND
- Page 334 and 335: Name of Respondent PACIFIC GAS AND
- Page 336 and 337: Name of Respondent PACIFIC GAS AND
- Page 338 and 339: Name of Respondent PACIFIC GAS AND
- Page 340 and 341: Name of Respondent This Report Is:
- Page 342 and 343: Name of Respondent PACIFIC GAS AND
- Page 344 and 345: Name of Respondent PACIFIC GAS AND
- Page 346 and 347: Name of Respondent PACIFIC GAS AND
- Page 348 and 349: Name of Respondent PACIFIC GAS AND
- Page 350 and 351: Name of Respondent PACIFIC GAS AND
- Page 352 and 353: Name of Respondent PACIFIC GAS AND
- Page 354 and 355: Name of Respondent PACIFIC GAS AND
- Page 356 and 357: Name of Respondent PACIFIC GAS AND
- Page 358 and 359: Name of Respondent PACIFIC GAS AND
- Page 360 and 361: Name of Respondent PACIFIC GAS AND
- Page 362 and 363: Name of Respondent PACIFIC GAS AND
- Page 364 and 365: Name of Respondent PACIFIC GAS AND
- Page 366 and 367: Name of Respondent PACIFIC GAS AND
- Page 368 and 369: Name of Respondent PACIFIC GAS AND
- Page 370 and 371: Name of Respondent PACIFIC GAS AND
- Page 372 and 373: Name of Respondent PACIFIC GAS AND
- Page 374 and 375: Name of Respondent PACIFIC GAS AND
- Page 376 and 377: Name of Respondent PACIFIC GAS AND
- Page 378 and 379: Name of Respondent PACIFIC GAS AND
- Page 380 and 381: Name of Respondent This Report Is:


