

Chapter 9: Introduction to Hypothesis Testing
Chapter 9: Introduction to Hypothesis Testing
Chapter 9: Introduction to Hypothesis Testing

You also want an ePaper? Increase the reach of your titles
YUMPU automatically turns print PDFs into web optimized ePapers that Google loves.
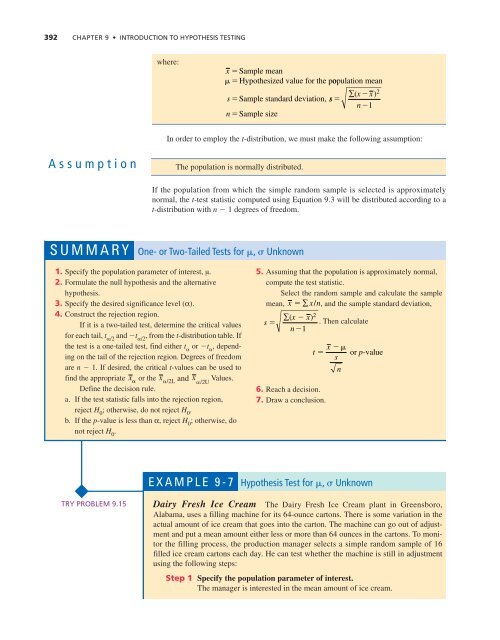
392 CHAPTER 9 • INTRODUCTION TO HYPOTHESIS TESTING<br />
where:<br />
x Sample mean<br />
Hypothesized value for the population mean<br />
s Sample standard deviation,<br />
n Sample size<br />
s <br />
∑( xx) 2<br />
n1<br />
In order <strong>to</strong> employ the t-distribution, we must make the following assumption:<br />
Assumption<br />
The population is normally distributed.<br />
If the population from which the simple random sample is selected is approximately<br />
normal, the t-test statistic computed using Equation 9.3 will be distributed according <strong>to</strong> a<br />
t-distribution with n 1 degrees of freedom.<br />
SUMMARY One- or Two-Tailed Tests for , Unknown<br />
1. Specify the population parameter of interest, μ.<br />
2. Formulate the null hypothesis and the alternative<br />
hypothesis.<br />
3. Specify the desired significance level (α).<br />
4. Construct the rejection region.<br />
If it is a two-tailed test, determine the critical values<br />
for each tail, t /2<br />
and t /2<br />
, from the t-distribution table. If<br />
the test is a one-tailed test, find either t <br />
or t <br />
, depending<br />
on the tail of the rejection region. Degrees of freedom<br />
are n 1. If desired, the critical t-values can be used <strong>to</strong><br />
find the appropriate x or the /2L and /2U Values.<br />
<br />
x x<br />
Define the decision rule.<br />
a. If the test statistic falls in<strong>to</strong> the rejection region,<br />
reject H 0<br />
; otherwise, do not reject H 0<br />
.<br />
b. If the p-value is less than α, reject H 0<br />
; otherwise, do<br />
not reject H 0<br />
.<br />
5. Assuming that the population is approximately normal,<br />
compute the test statistic.<br />
Select the random sample and calculate the sample<br />
mean, x ∑ x/<br />
n, and the sample standard deviation,<br />
∑( x x) s <br />
2<br />
. Then calculate<br />
n1<br />
6. Reach a decision.<br />
7. Draw a conclusion.<br />
x<br />
t <br />
or p-value<br />
s<br />
n<br />
EXAMPLE 9-7 <strong>Hypothesis</strong> Test for , Unknown<br />
TRY PROBLEM 9.15<br />
Dairy Fresh Ice Cream The Dairy Fresh Ice Cream plant in Greensboro,<br />
Alabama, uses a filling machine for its 64-ounce car<strong>to</strong>ns. There is some variation in the<br />
actual amount of ice cream that goes in<strong>to</strong> the car<strong>to</strong>n. The machine can go out of adjustment<br />
and put a mean amount either less or more than 64 ounces in the car<strong>to</strong>ns. To moni<strong>to</strong>r<br />
the filling process, the production manager selects a simple random sample of 16<br />
filled ice cream car<strong>to</strong>ns each day. He can test whether the machine is still in adjustment<br />
using the following steps:<br />
Step 1 Specify the population parameter of interest.<br />
The manager is interested in the mean amount of ice cream.


