Chapter 9: Introduction to Hypothesis Testing
Chapter 9: Introduction to Hypothesis Testing
Chapter 9: Introduction to Hypothesis Testing
You also want an ePaper? Increase the reach of your titles
YUMPU automatically turns print PDFs into web optimized ePapers that Google loves.
394 CHAPTER 9 • INTRODUCTION TO HYPOTHESIS TESTING<br />
The t-test statistic is<br />
x<br />
t <br />
64.<br />
2 64<br />
111 .<br />
s 072 .<br />
n<br />
Step 6 Reach a decision.<br />
Because t 1.11 is not less than 2.1315 and not greater than 2.1315, we<br />
do not reject the null hypothesis.<br />
Step 7 Draw a conclusion.<br />
Based on these sample data, the company does not have sufficient<br />
evidence <strong>to</strong> conclude that the filling machine is out of adjustment.<br />
16<br />
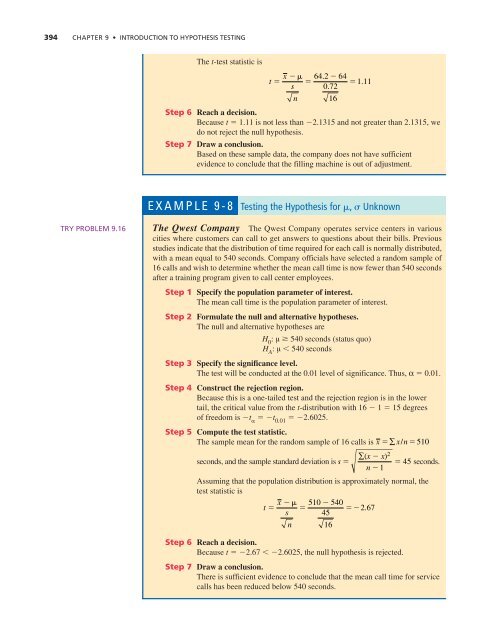
EXAMPLE 9-8 <strong>Testing</strong> the <strong>Hypothesis</strong> for , Unknown<br />
TRY PROBLEM 9.16 The Qwest Company The Qwest Company operates service centers in various<br />
cities where cus<strong>to</strong>mers can call <strong>to</strong> get answers <strong>to</strong> questions about their bills. Previous<br />
studies indicate that the distribution of time required for each call is normally distributed,<br />
with a mean equal <strong>to</strong> 540 seconds. Company officials have selected a random sample of<br />
16 calls and wish <strong>to</strong> determine whether the mean call time is now fewer than 540 seconds<br />
after a training program given <strong>to</strong> call center employees.<br />
Step 1 Specify the population parameter of interest.<br />
The mean call time is the population parameter of interest.<br />
Step 2 Formulate the null and alternative hypotheses.<br />
The null and alternative hypotheses are<br />
H 0<br />
: μ 540 seconds (status quo)<br />
H A<br />
: μ 540 seconds<br />
Step 3 Specify the significance level.<br />
The test will be conducted at the 0.01 level of significance. Thus, α 0.01.<br />
Step 4 Construct the rejection region.<br />
Because this is a one-tailed test and the rejection region is in the lower<br />
tail, the critical value from the t-distribution with 16 1 15 degrees<br />
of freedom is t <br />
t 0.01<br />
2.6025.<br />
Step 5 Compute the test statistic.<br />
The sample mean for the random sample of 16 calls is<br />
seconds, and the sample standard deviation is s <br />
Step 6 Reach a decision.<br />
Because t 2.67 2.6025, the null hypothesis is rejected.<br />
n<br />
45 seconds.<br />
Assuming that the population distribution is approximately normal, the<br />
test statistic is<br />
x<br />
t <br />
510 540<br />
267<br />
.<br />
s 45<br />
Step 7 Draw a conclusion.<br />
There is sufficient evidence <strong>to</strong> conclude that the mean call time for service<br />
calls has been reduced below 540 seconds.<br />
16<br />
∑( x<br />
x) 2<br />
n 1<br />
x∑ x/ n510


