

Chapter 9: Introduction to Hypothesis Testing
Chapter 9: Introduction to Hypothesis Testing
Chapter 9: Introduction to Hypothesis Testing

Create successful ePaper yourself
Turn your PDF publications into a flip-book with our unique Google optimized e-Paper software.
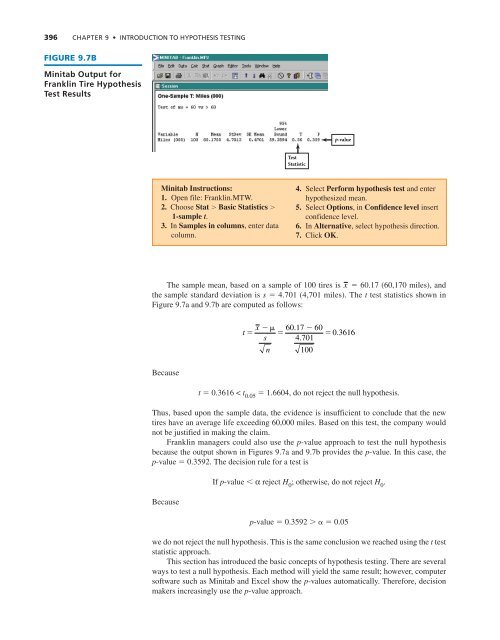
396 CHAPTER 9 • INTRODUCTION TO HYPOTHESIS TESTING<br />
FIGURE 9.7B<br />
Minitab Output for<br />
Franklin Tire <strong>Hypothesis</strong><br />
Test Results<br />
p-value<br />
Test<br />
Statistic<br />
Minitab Instructions:<br />
1. Open file: Franklin.MTW.<br />
2. Choose Stat Basic Statistics <br />
1-sample t.<br />
3. In Samples in columns, enter data<br />
column.<br />
4. Select Perform hypothesis test and enter<br />
hypothesized mean.<br />
5. Select Options, in Confidence level insert<br />
confidence level.<br />
6. In Alternative, select hypothesis direction.<br />
7. Click OK.<br />
The sample mean, based on a sample of 100 tires is x 60.17 (60,170 miles), and<br />
the sample standard deviation is s 4.701 (4,701 miles). The t test statistics shown in<br />
Figure 9.7a and 9.7b are computed as follows:<br />
Because<br />
t 0.3616 < t 0.05<br />
1.6604, do not reject the null hypothesis.<br />
Thus, based upon the sample data, the evidence is insufficient <strong>to</strong> conclude that the new<br />
tires have an average life exceeding 60,000 miles. Based on this test, the company would<br />
not be justified in making the claim.<br />
Franklin managers could also use the p-value approach <strong>to</strong> test the null hypothesis<br />
because the output shown in Figures 9.7a and 9.7b provides the p-value. In this case, the<br />
p-value 0.3592. The decision rule for a test is<br />
Because<br />
x<br />
t <br />
60.<br />
17 60<br />
0.<br />
3616<br />
s 4.<br />
701<br />
n 100<br />
If p-value α reject H 0<br />
; otherwise, do not reject H 0<br />
.<br />
p-value 0.3592 0.05<br />
we do not reject the null hypothesis. This is the same conclusion we reached using the t test<br />
statistic approach.<br />
This section has introduced the basic concepts of hypothesis testing. There are several<br />
ways <strong>to</strong> test a null hypothesis. Each method will yield the same result; however, computer<br />
software such as Minitab and Excel show the p-values au<strong>to</strong>matically. Therefore, decision<br />
makers increasingly use the p-value approach.


