

Chapter 9: Introduction to Hypothesis Testing
Chapter 9: Introduction to Hypothesis Testing
Chapter 9: Introduction to Hypothesis Testing

Create successful ePaper yourself
Turn your PDF publications into a flip-book with our unique Google optimized e-Paper software.
408 CHAPTER 9 • INTRODUCTION TO HYPOTHESIS TESTING<br />
The null hypothesis is false for all possible values of 700 hours. Thus, for each of the<br />
infinite number of possibilities, a value of can be determined. (Note: is assumed <strong>to</strong> be a<br />
known value of 15 hours.)<br />
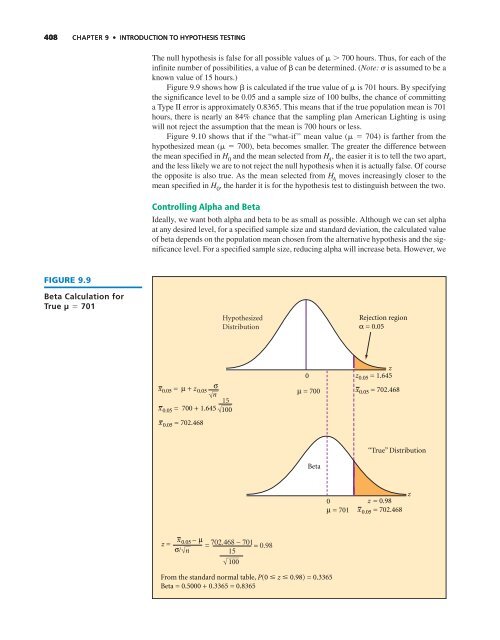
Figure 9.9 shows how is calculated if the true value of is 701 hours. By specifying<br />
the significance level <strong>to</strong> be 0.05 and a sample size of 100 bulbs, the chance of committing<br />
a Type II error is approximately 0.8365. This means that if the true population mean is 701<br />
hours, there is nearly an 84% chance that the sampling plan American Lighting is using<br />
will not reject the assumption that the mean is 700 hours or less.<br />
Figure 9.10 shows that if the “what-if” mean value ( 704) is farther from the<br />
hypothesized mean ( 700), beta becomes smaller. The greater the difference between<br />
the mean specified in H 0<br />
and the mean selected from H A<br />
, the easier it is <strong>to</strong> tell the two apart,<br />
and the less likely we are <strong>to</strong> not reject the null hypothesis when it is actually false. Of course<br />
the opposite is also true. As the mean selected from H A<br />
moves increasingly closer <strong>to</strong> the<br />
mean specified in H 0<br />
, the harder it is for the hypothesis test <strong>to</strong> distinguish between the two.<br />
Controlling Alpha and Beta<br />
Ideally, we want both alpha and beta <strong>to</strong> be as small as possible. Although we can set alpha<br />
at any desired level, for a specified sample size and standard deviation, the calculated value<br />
of beta depends on the population mean chosen from the alternative hypothesis and the significance<br />
level. For a specified sample size, reducing alpha will increase beta. However, we<br />
FIGURE 9.9<br />
Beta Calculation for<br />
True µ 701<br />
Hypothesized<br />
Distribution<br />
Rejection region<br />
α = 0.05<br />
x 0.05 = μ + z 0.05<br />
σ<br />
n<br />
x 0.05 = 700 + 1.645<br />
x 0.05 = 702.468<br />
15<br />
100<br />
0<br />
μ = 700<br />
z<br />
z 0.05 = 1.645<br />
x 0.05 = 702.468<br />
Beta<br />
“True” Distribution<br />
0<br />
μ = 701<br />
z = 0.98<br />
x 0.05 = 702.468<br />
z<br />
z =<br />
x 0.05 – μ = 702.468 − 701 = 0.98<br />
σ/ n<br />
15<br />
100<br />
From the standard normal table, P(0 z 0.98) = 0.3365<br />
Beta = 0.5000 + 0.3365 = 0.8365


