How do we rebuild shareholder trust on executive pay
How do we rebuild shareholder trust on executive pay
How do we rebuild shareholder trust on executive pay

You also want an ePaper? Increase the reach of your titles
YUMPU automatically turns print PDFs into web optimized ePapers that Google loves.
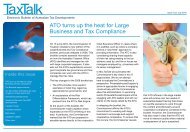
A look in the rear-visi<strong>on</strong> mirror:<br />
ASX 100 remunerati<strong>on</strong> in 2009<br />
Total remunerati<strong>on</strong> and mix<br />
The total remunerati<strong>on</strong> levels (see Figure 16) of<br />
CEOs, CFOs and other disclosed <strong>executive</strong>s within<br />
ASX 100 companies have not changed dramatically<br />
at the median in the last year, with a slight decrease<br />
in total remunerati<strong>on</strong> for CEOs, and no change for<br />
CFOs and other <strong>executive</strong>s.<br />
Breaking total remunerati<strong>on</strong> into the various<br />
comp<strong>on</strong>ents shows an interesting picture. Fixed <strong>pay</strong><br />
at the median of the ASX 100 for CEOs, CFOs and<br />
other <strong>executive</strong>s increased slightly, but the median<br />
short-term incentives paid decreased significantly as<br />
the impact of the GFC set in. L<strong>on</strong>g-term incentives<br />
valued at grant increased for CFOs and other<br />
<strong>executive</strong>s, but decreased slightly for CEOs. This<br />
may have been due to an increase in scrutiny of CEO<br />
remunerati<strong>on</strong> practices by various stakeholders.<br />
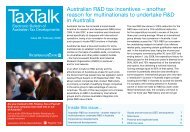
A look at the remunerati<strong>on</strong> mix at the median of the<br />
ASX 100 further c<strong>on</strong>firms the reducti<strong>on</strong> in STI value<br />
as percentage of the total remunerati<strong>on</strong> mix (see<br />
Figure 17).<br />
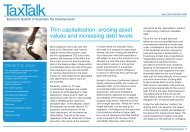
The level of total remunerati<strong>on</strong> c<strong>on</strong>tinues to have a<br />
high correlati<strong>on</strong> with market capitalisati<strong>on</strong>, even with<br />
significant swings in company share prices over the<br />
past 12 m<strong>on</strong>ths (see Figure 18).<br />
Figure 16: ASX 100 CEO, CFO and Executive total remunerati<strong>on</strong> levels<br />
$,000<br />
8,000<br />
7,000<br />
6,000<br />
5,000<br />
4,000<br />
3,000<br />
2,000<br />
1,000<br />
0<br />
CEO CFO Execs CEO CFO Execs<br />
Median<br />
75th<br />
Fixed <strong>pay</strong> Actual STI LTI at grant<br />
Figure 17: ASX 100 CEO, CFO and Executive remunerati<strong>on</strong> mix – 2008 and 2009<br />
CEO<br />
2009<br />
2008<br />
39%<br />
35%<br />
26%<br />
24%<br />
37%<br />
39%<br />
CFO<br />
2009<br />
2008<br />
47%<br />
44%<br />
20%<br />
27%<br />
33%<br />
29%<br />
Other<br />
Execs<br />
2009<br />
2008<br />
48%<br />
45%<br />
19%<br />
24%<br />
33%<br />
31%<br />
Fixed <strong>pay</strong> Actual STI LTI at grant<br />
Figure 18: ASX 100 CEO median remunerati<strong>on</strong> levels by company size (market capitalisati<strong>on</strong>)<br />
7,500<br />
6,000<br />
$,000<br />
4,500<br />
3,000<br />
1,500<br />
0<br />
ASX1-25 ASX26-50 ASX51-100<br />
Fixed <strong>pay</strong> Fixed + STI Fixed + STI + LTI<br />
PricewaterhouseCoopers Executive Remunerati<strong>on</strong> – Fourth Editi<strong>on</strong> 2010 | 41