Insurance facts and figures 2007 - PwC
Insurance facts and figures 2007 - PwC
Insurance facts and figures 2007 - PwC

You also want an ePaper? Increase the reach of your titles
YUMPU automatically turns print PDFs into web optimized ePapers that Google loves.
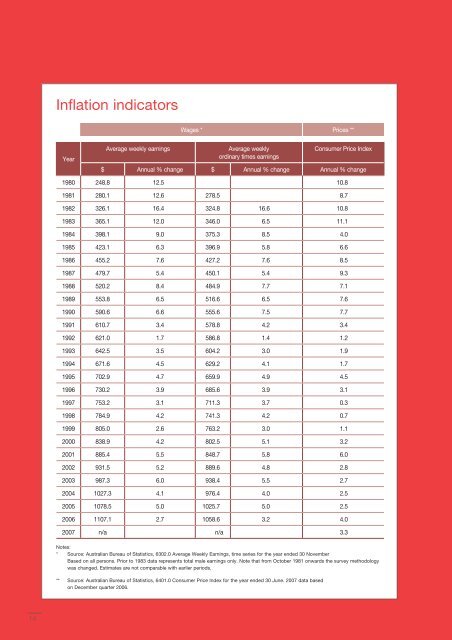
Inflation indicators<br />
Wages * Prices **<br />
Year<br />
Average weekly earnings<br />
Average weekly<br />
ordinary times earnings<br />
Consumer Price Index<br />
$ Annual % change $ Annual % change Annual % change<br />
1980 248.8 12.5 10.8<br />
1981 280.1 12.6 278.5 8.7<br />
1982 326.1 16.4 324.8 16.6 10.8<br />
1983 365.1 12.0 346.0 6.5 11.1<br />
1984 398.1 9.0 375.3 8.5 4.0<br />
1985 423.1 6.3 396.9 5.8 6.6<br />
1986 455.2 7.6 427.2 7.6 8.5<br />
1987 479.7 5.4 450.1 5.4 9.3<br />
1988 520.2 8.4 484.9 7.7 7.1<br />
1989 553.8 6.5 516.6 6.5 7.6<br />
1990 590.6 6.6 555.6 7.5 7.7<br />
1991 610.7 3.4 578.8 4.2 3.4<br />
1992 621.0 1.7 586.8 1.4 1.2<br />
1993 642.5 3.5 604.2 3.0 1.9<br />
1994 671.6 4.5 629.2 4.1 1.7<br />
1995 702.9 4.7 659.9 4.9 4.5<br />
1996 730.2 3.9 685.6 3.9 3.1<br />
1997 753.2 3.1 711.3 3.7 0.3<br />
1998 784.9 4.2 741.3 4.2 0.7<br />
1999 805.0 2.6 763.2 3.0 1.1<br />
2000 838.9 4.2 802.5 5.1 3.2<br />
2001 885.4 5.5 848.7 5.8 6.0<br />
2002 931.5 5.2 889.6 4.8 2.8<br />
2003 987.3 6.0 938.4 5.5 2.7<br />
2004 1027.3 4.1 976.4 4.0 2.5<br />
2005 1078.5 5.0 1025.7 5.0 2.5<br />
2006 1107.1 2.7 1058.6 3.2 4.0<br />
<strong>2007</strong> n/a n/a 3.3<br />
Notes:<br />
* Source: Australian Bureau of Statistics, 6302.0 Average Weekly Earnings, time series for the year ended 30 November<br />
Based on all persons. Prior to 1983 data represents total male earnings only. Note that from October 1981 onwards the survey methodology<br />
was changed. Estimates are not comparable with earlier periods.<br />
** Source: Australian Bureau of Statistics, 6401.0 Consumer Price Index for the year ended 30 June. <strong>2007</strong> data based<br />
on December quarter 2006.<br />
14