- Page 1: Saddleback College Seperator Sheet
- Page 5 and 6: Tiql::ZLl = OF OPITI=PIT Certificat
- Page 7 and 8: CHRISTINA CARROLL, EDITOR ACCREDITA
- Page 10 and 11: ~. . . hroughout the self study, se
- Page 12 and 13: process by which new faculty are ad
- Page 14 and 15: campus locations, including Leisure
- Page 16 and 17: OR i IPIIT’ ITIOPI I=01 THE ELI=
- Page 18 and 19: eferred to appropriate governance o
- Page 20 and 21: Paulo Jacobs Randy Anderson Jerilyn
- Page 22 and 23: I i I IFTIVI I ffl :l il Ol PIl ffl
- Page 24 and 25: 1998 until the present. A similar c
- Page 26 and 27: 60O,OO 500,00 400,00 300,00 200,00
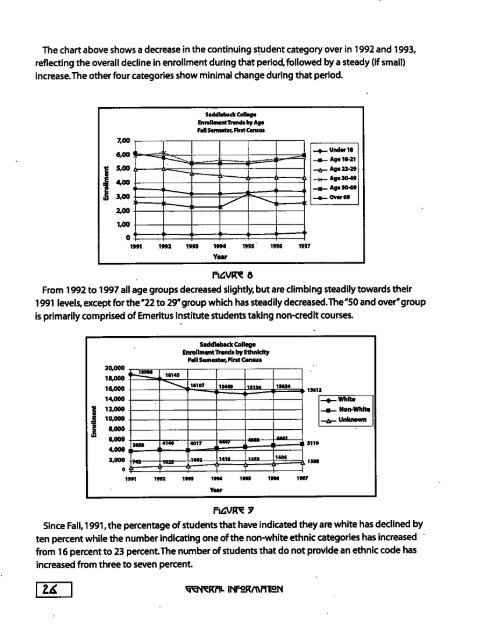
- Page 30 and 31: Over the period covered by the abov
- Page 32 and 33: Saddleback College Personnel by Eth
- Page 34 and 35: ~EI~TlffI~/=ITION Off ~OMTIPII~EIx
- Page 36 and 37: While the Self Study points to cons
- Page 38 and 39: topic of shared governance. After t
- Page 40 and 41: 14. 15. A Gay and Lesbian Committee
- Page 42 and 43: At the District level, there is als
- Page 44 and 45: Emeritus students participate in su
- Page 46 and 47: Review and strengthen current staff
- Page 48 and 49: Address the potential impact of add
- Page 50 and 51: evenue based model in 1986-1987. In
- Page 52 and 53: IM.~TITVTIOM~IL l~ll~lOrl
- Page 54 and 55: ity for reviewing the District miss
- Page 56 and 57: 3. Institutionol plonning ond decis
- Page 58 and 59: ~T~IMI~IRI~ T~#C) IPIgTITI/TIOPIffL
- Page 60 and 61: I~.~-~RIF’IiON Saddleback College
- Page 62 and 63: countries.The Associated Student Go
- Page 64 and 65: To foster a supportive climate with
- Page 66 and 67: The institution regularly evaluates
- Page 68 and 69: Irl~TITVTIoPii=IL. EPI=EKTIVEPIE~ -
- Page 70 and 71: The vast majority of research under
- Page 72 and 73: dollars on providing cutting edge e
- Page 74 and 75: B. I The institution defines andpub
- Page 76 and 77: special funding that will provide e
- Page 78 and 79:
tion in community activities such a
- Page 80 and 81:
~T~IMI’,~IRI’, FOV.R
- Page 82 and 83:
small retail and service businesses
- Page 84 and 85:
Vocational Associate degree and cer
- Page 86 and 87:
Over the past several years of fluc
- Page 88 and 89:
goals. Degree and certificate progr
- Page 90 and 91:
~R~II~L Students completing degree
- Page 92 and 93:
and Vocational Education from emplo
- Page 94 and 95:
a. The College will recommend chang
- Page 96 and 97:
concerning a program andits curricu
- Page 98 and 99:
Transfer of credit policies are cle
- Page 100 and 101:
priate department chair~ and/or Dea
- Page 102 and 103:
..r[ ~Ti’IMl~i’ll~l~ ~TVI~E,MT
- Page 104 and 105:
College Catalog (Ref. 5.2),the Coll
- Page 106 and 107:
Student Services programs under the
- Page 108 and 109:
A modular building (BGS Annex) has
- Page 110 and 111:
~e ~4atriculation Coordinafor and r
- Page 112 and 113:
Experience, and Women’s History M
- Page 114 and 115:
tronic buttons, door locks, door co
- Page 116 and 117:
Admissions and Records services and
- Page 118 and 119:
’I" IMI IRI 5IX IMI=ORI ITIOM Li=
- Page 120 and 121:
The District is planning to install
- Page 122 and 123:
The ITC staff has performed well in
- Page 124 and 125:
The institution has professionally
- Page 126 and 127:
ASG, the Friends of the Library, th
- Page 128 and 129:
The librarians evaluate CD-ROMs, el
- Page 130 and 131:
13o vA3 NT 6.1 Saddleback College A
- Page 132 and 133:
I=;PI = IdLTY Ti=ll=l Mark Kruhmin
- Page 134 and 135:
A.2 Criteri¢ quolificotions, andpr
- Page 136 and 137:
A.4 Degrees held by faculty and adm
- Page 138 and 139:
also used by the Vice President for
- Page 140 and 141:
C.2 Planningondevaluationofstuffdev
- Page 142 and 143:
however, has caused some concern ab
- Page 145 and 146:
PHY I /:IL T lPllX/31 lx EIGHT Ham/
- Page 147 and 148:
Maintenance functions were decentra
- Page 149 and 150:
manage risks, another $1,500,000 is
- Page 151 and 152:
I~R~F~oN Physical resource planning
- Page 153 and 154:
~’I’~IMI~II~I~ MIME
- Page 155 and 156:
I~Y-~RIVlioN The budget allocation
- Page 157 and 158:
groups, and as income becomes avail
- Page 159 and 160:
participate in committees that deve
- Page 161 and 162:
ing the Saddleback College budget,
- Page 163 and 164:
I~-~Rd~iopI The SOCCCD Business Ser
- Page 165 and 166:
into contracts with both public and
- Page 167 and 168:
C.2 The institution has policies fo
- Page 169 and 170:
In the fiscal year 1996-1997 the Bo
- Page 171 and 172:
~OV.l~rlffr~ ~IMI~. ffI~I~IIMI~TI~I
- Page 173 and 174:
A.I Thegoverningboardisanindependea
- Page 175 and 176:
A.4 In keeping with its mission, th
- Page 177 and 178:
RFFRI=IIPI=IL The Board of Trustees
- Page 179 and 180:
B.$ The institution is administrati
- Page 181 and 182:
By action of the Board of Trustees
- Page 183 and 184:
B.8 The institution has written pol
- Page 185 and 186:
t=lFFRt=h~t~. The Board of Trustees
- Page 187 and 188:
C.4 The district/system provides ef
- Page 189 and 190:
10.1 California Education Code, Tit
- Page 191 and 192:
IWL MPIIMYi 9Vh’IKIPIRY In review
- Page 193 and 194:
~Dorothy Fortune, Steven J. Fro~jue
- Page 195 and 196:
TfflBLI . Off OMTI PIT Certificmion
- Page 197 and 198:
SADDLEBACK COLLEGE MIKI MIKOLAJCZAI
- Page 199 and 200:
STANDARD FOUR: EDUCATIONAL PROGRAMS
- Page 201 and 202:
[ ~ hraughouthe selfstudy, several
- Page 203 and 204:
process by which new faculty are ad
- Page 205 and 206:
campus locations, including Leisure
- Page 207 and 208:
1998 implementation period. An Accr
- Page 209 and 210:
~TPINITRRI7 ONe" Car/Christensen Ma
- Page 211 and 212:
~TFINITFIRI7 E~.I’IT." Harry Parm
- Page 213 and 214:
I~ERI217 III During this phase the
- Page 215 and 216:
The area’s temperate climate, the
- Page 217 and 218:
600,00 5oo,oo 400,00 300,00 200,00
- Page 219 and 220:
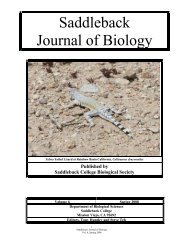
Saddleback College Enrollment Trend
- Page 221 and 222:
Over the period covered by the abov
- Page 223 and 224:
Sacldleheck College Personnel by Et
- Page 225 and 226:
~i=RTII=I~i=ITIOM Off ~OMTIMI/I=b,
- Page 227 and 228:
While the Self Study points to cons
- Page 229 and 230:
topic of shared governance. After t
- Page 231 and 232:
~4. ~5. A Gay and Lesbian Committee
- Page 233 and 234:
At the District level, there is als
- Page 235 and 236:
Emeritus students participate in su
- Page 237 and 238:
Review and strengthen current staff
- Page 239 and 240:
Address the potential impact of add
- Page 241 and 242:
evenue based model in 1986-1987. In
- Page 243 and 244:
IM TrI’I/TIOM IL I II IOM Carl Ch
- Page 245 and 246:
I~R~FlioN The goals of Saddleback C
- Page 247 and 248:
4. The institution evaluates and re
- Page 249 and 250:
Saddleback College publishes a vari
- Page 251 and 252:
countries.The Associated Student Go
- Page 253 and 254:
To foster a supportive climate with
- Page 255 and 256:
The institution regularly evaluates
- Page 257 and 258:
T ll’ll ll l THI EE IN TITYTION I
- Page 259 and 260:
Saddleback College has a critical n
- Page 261 and 262:
goal is documented through the Coll
- Page 263 and 264:
# College constituencies.The Strate
- Page 265 and 266:
Educational Services.The Vice-Chanc
- Page 267 and 268:
3.1 3.2 3.3 3.4 3.5 3.6 3.7 3.8 3.9
- Page 269 and 270:
small retail and service businesses
- Page 271 and 272:
Vocational Associate degree and cer
- Page 273 and 274:
Over the past several years of fluc
- Page 275 and 276:
goals. Degree and certificate progr
- Page 277 and 278:
Students completing degree or certi
- Page 279 and 280:
and Vocational Education from emplo
- Page 281 and 282:
The College will recommend changes
- Page 283 and 284:
concerning a program and its curric
- Page 285 and 286:
Transfer of credit poli~ies are cle
- Page 287 and 288:
priate department chairs and/or Dea
- Page 289 and 290:
~’ri=IMl~i=ll~l~ FlY1 ~ TVbI=MT V
- Page 291 and 292:
information each semester in the Cl
- Page 293 and 294:
of disadvantaged and disabled stude
- Page 295 and 296:
The College has taken care to ensur
- Page 297 and 298:
~e ~atricula~ion Coordino~or and re
- Page 299 and 300:
Experience, and Women’s History M
- Page 301 and 302:
tmnic buttons, door locks, door com
- Page 303 and 304:
Admissions and Records services and
- Page 305 and 306:
magazines, newspapers, and governme
- Page 307 and 308:
The LAP/ICC does not have sufficien
- Page 309 and 310:
Responses to the IES indicated a ne
- Page 311 and 312:
percent of the respondents did not
- Page 313 and 314:
Saddleback College reference desk.
- Page 315 and 316:
accurate tracking of students and w
- Page 317 and 318:
T IMI /:II I’, EYEM I= = YLTY lMI
- Page 319 and 320:
A.2 Criteria, qualifications, andpr
- Page 321 and 322:
A.4 Degrees held by faculty and adm
- Page 323 and 324:
also used by the Vice President for
- Page 325 and 326:
C.2 Planningandevaluationofstoffdev
- Page 327 and 328:
however, has caused some concern ab
- Page 329 and 330:
I HY I : ’l’ lPllX lRiX EIGHT I
- Page 331 and 332:
Maintenance functions were decentra
- Page 333 and 334:
manage risks, another $1,500,000 is
- Page 335 and 336:
Physical resour~e planning and eval
- Page 337 and 338:
= ’I’ IMI II I I"111"11 I=IM IM
- Page 339 and 340:
Annual and long-range financial pla
- Page 341 and 342:
since it is ultimately responsible
- Page 343 and 344:
Official College committees are cle
- Page 345 and 346:
B.2 Financialdocuments, including t
- Page 347 and 348:
The Foundation is a non-profit orga
- Page 349 and 350:
a. The College will seek to develop
- Page 351 and 352:
C.$ Cash flow arrangements or reser
- Page 353 and 354:
9.1 9.2 9.3 9.4 9.5 9.6 9.7 9.8 9.9
- Page 355 and 356:
A.1 Thegoverningboardisanindependen
- Page 357 and 358:
A.4 In keeping with its mission, th
- Page 359 and 360:
The Board of Trustees Orientation M
- Page 361 and 362:
B.$ The institution is administrati
- Page 363 and 364:
~IP~R~II~- By action of the Board o
- Page 365 and 366:
B.8 Theinstitutionhaswrittenpolicyw
- Page 367 and 368:
The Board of Trustees’ decision t
- Page 369 and 370:
C.4 The district/system provides ef
- Page 371 and 372:
10.1 California Education Code, Tit
- Page 373:
Finally, the issue of shared govern