today's facts & tomorrow's trends - SPREAD Sustainable Lifestyles ...
today's facts & tomorrow's trends - SPREAD Sustainable Lifestyles ...
today's facts & tomorrow's trends - SPREAD Sustainable Lifestyles ...

You also want an ePaper? Increase the reach of your titles
YUMPU automatically turns print PDFs into web optimized ePapers that Google loves.
transportation prices – a challenge but also an opportunity. Transportation in<br />
Europe today is cheap for users but expensive for society, as prices do not reflect<br />
the true costs. There are, for example, inconsistent taxation rules between<br />
transport modes and fuels between and within Member States. These may<br />
even subsidise environmentally unsustainable choices, with favourable taxation<br />
rules for corporate cars that encourages the use of cars for business (EC 2011b).<br />
A challenge that relates to transportation prices is price tariffs that do not distinguish<br />
among social groups, such as older people and students – which is a<br />
basic requirement for equity in mobility. Social inclusion has to be guaranteed:<br />
new services for elderly people or those with disabilities should be developed<br />
alongside green standards, such as allowing only low-emission cars to enter<br />
city centres or mandatory technical skills training and/or internet access to allow<br />
individual mobility planning.<br />
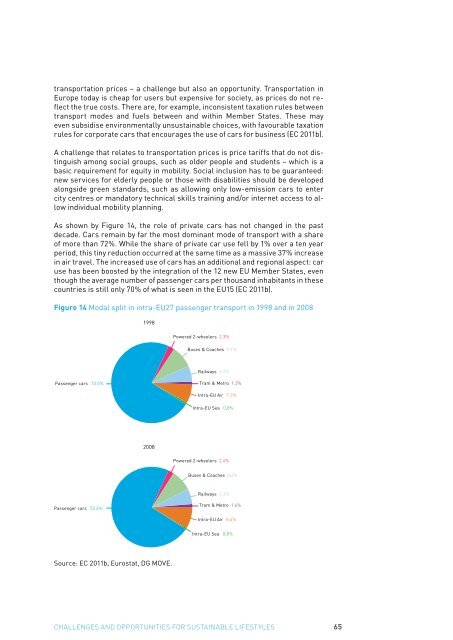
As shown by Figure 14, the role of private cars has not changed in the past<br />
decade. Cars remain by far the most dominant mode of transport with a share<br />
of more than 72%. While the share of private car use fell by 1% over a ten year<br />
period, this tiny reduction occurred at the same time as a massive 37% increase<br />
in air travel. The increased use of cars has an additional and regional aspect: car<br />
use has been boosted by the integration of the 12 new EU Member States, even<br />
though the average number of passenger cars per thousand inhabitants in these<br />
countries is still only 70% of what is seen in the EU15 (EC 2011b).<br />
Figure 14 Modal split in intra-EU27 passenger transport in 1998 and in 2008<br />
1998<br />
Powered 2-wheelers 2.3%<br />
Buses & Coaches 9.1%<br />
Railways 6.2%<br />
Passenger cars 73.0%<br />
Tram & Metro 1.3%<br />
Intra-EU Air 7.3%<br />
Intra-EU Sea 0,8%<br />
2008<br />
Powered 2-wheelers 2.4%<br />
Buses & Coaches 8.4%<br />
Railways 6.3%<br />
Passenger cars 72.4%<br />
Tram & Metro 1.4%<br />
Intra-EU Air 8.6%<br />
Intra-EU Sea 0,8%<br />
Source: EC 2011b, Eurostat, DG MOVE.<br />
Challenges and opportunities for sustainable lifestyles 65