Sales breakdown 2004 - Solvay
Sales breakdown 2004 - Solvay
Sales breakdown 2004 - Solvay

Create successful ePaper yourself
Turn your PDF publications into a flip-book with our unique Google optimized e-Paper software.
Global Annual Report <strong>Solvay</strong> <strong>2004</strong><br />
48<br />
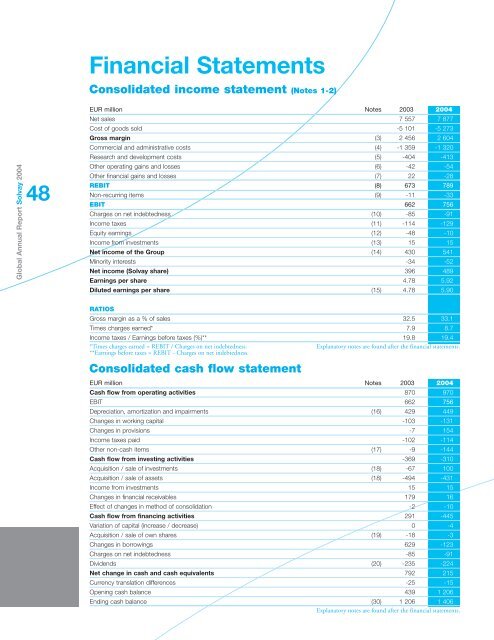
Financial Statements<br />
Consolidated income statement (Notes 1-2)<br />
EUR million Notes 2003 <strong>2004</strong><br />
Net sales 7 557 7 877<br />
Cost of goods sold -5 101 -5 273<br />
Gross margin (3) 2 456 2 604<br />
Commercial and administrative costs (4) -1 359 -1 320<br />
Research and development costs (5) -404 -413<br />
Other operating gains and losses (6) -42 -54<br />
Other financial gains and losses (7) 22 -28<br />
REBIT (8) 673 789<br />
Non-recurring items (9) -11 -33<br />
EBIT 662 756<br />
Charges on net indebtedness (10) -85 -91<br />
Income taxes (11) -114 -129<br />
Equity earnings (12) -48 -10<br />
Income from investments (13) 15 15<br />
Net income of the Group (14) 430 541<br />
Minority interests -34 -52<br />
Net income (<strong>Solvay</strong> share) 396 489<br />
Earnings per share 4.78 5.92<br />
Diluted earnings per share (15) 4.78 5.90<br />
RATIOS<br />
Gross margin as a % of sales 32.5 33.1<br />
Times charges earned* 7.9 8.7<br />
Income taxes / Earnings before taxes (%)** 19.8 19.4<br />
*Times charges earned = REBIT / Charges on net indebtedness.<br />
Explanatory notes are found after the financial statements.<br />
**Earnings before taxes = REBIT - Charges on net indebtedness.<br />
Consolidated cash flow statement<br />
EUR million Notes 2003 <strong>2004</strong><br />
Cash flow from operating activities 870 970<br />
EBIT 662 756<br />
Depreciation, amortization and impairments (16) 429 449<br />
Changes in working capital -103 -131<br />
Changes in provisions -7 154<br />
Income taxes paid -102 -114<br />
Other non-cash items (17) -9 -144<br />
Cash flow from investing activities -369 -310<br />
Acquisition / sale of investments (18) -67 100<br />
Acquisition / sale of assets (18) -494 -431<br />
Income from investments 15 15<br />
Changes in financial receivables 179 16<br />
Effect of changes in method of consolidation -2 -10<br />
Cash flow from financing activities 291 -445<br />
Variation of capital (increase / decrease) 0 -4<br />
Acquisition / sale of own shares (19) -18 -3<br />
Changes in borrowings 629 -123<br />
Charges on net indebtedness -85 -91<br />
Dividends (20) -235 -224<br />
Net change in cash and cash equivalents 792 215<br />
Currency translation differences -25 -15<br />
Opening cash balance 439 1 206<br />
Ending cash balance (30) 1 206 1 406<br />
Explanatory notes are found after the financial statements.