Sales breakdown 2004 - Solvay
Sales breakdown 2004 - Solvay
Sales breakdown 2004 - Solvay

You also want an ePaper? Increase the reach of your titles
YUMPU automatically turns print PDFs into web optimized ePapers that Google loves.
Information for shareholders<br />
SOLVAY SHARE PERFORMANCE<br />
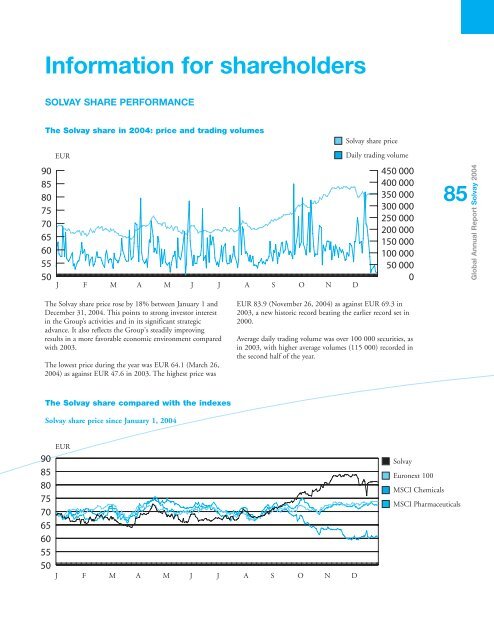
The <strong>Solvay</strong> share in <strong>2004</strong>: price and trading volumes<br />
90<br />
85<br />
80<br />
75<br />
70<br />
65<br />
60<br />
55<br />
50<br />
EUR<br />
J F M A M J J A S O N D<br />
<strong>Solvay</strong> share price<br />
Daily trading volume<br />
450 000<br />
400 000<br />
350 000<br />
300 000<br />
250 000<br />
200 000<br />
150 000<br />
100 000<br />
50 000<br />
0<br />
85<br />
Global Annual Report <strong>Solvay</strong> <strong>2004</strong><br />
The <strong>Solvay</strong> share price rose by 18% between January 1 and<br />
December 31, <strong>2004</strong>. This points to strong investor interest<br />
in the Group’s activities and in its significant strategic<br />
advance. It also reflects the Group's steadily improving<br />
results in a more favorable economic environment compared<br />
with 2003.<br />
The lowest price during the year was EUR 64.1 (March 26,<br />
<strong>2004</strong>) as against EUR 47.6 in 2003. The highest price was<br />
EUR 83.9 (November 26, <strong>2004</strong>) as against EUR 69.3 in<br />
2003, a new historic record beating the earlier record set in<br />
2000.<br />
Average daily trading volume was over 100 000 securities, as<br />
in 2003, with higher average volumes (115 000) recorded in<br />
the second half of the year.<br />
The <strong>Solvay</strong> share compared with the indexes<br />
<strong>Solvay</strong> share price since January 1, <strong>2004</strong><br />
90<br />
85<br />
80<br />
75<br />
70<br />
65<br />
60<br />
55<br />
50<br />
EUR<br />
J F M A M J J A S O N D<br />
<strong>Solvay</strong><br />
Euronext 100<br />
MSCI Chemicals<br />
MSCI Pharmaceuticals