Eros International (EROINT) - Myiris.com
Eros International (EROINT) - Myiris.com
Eros International (EROINT) - Myiris.com

You also want an ePaper? Increase the reach of your titles
YUMPU automatically turns print PDFs into web optimized ePapers that Google loves.
\<br />
Result Update<br />
Rating matrix<br />
Rating : Buy<br />
Target : | 200<br />
Target Period : 12 months<br />
Potential Upside : 22%<br />
Key Financials<br />
| Crore FY12 FY13 FY14E FY15E<br />
Net Sales 944 1,068.0 1,226.7 1,482.3<br />
EBITDA 212.4 226.2 260.3 331.1<br />
Net Profit 147.8 154.5 152.8 195.7<br />
EPS (|) 16.1 16.8 16.6 21.3<br />
Valuation summary<br />
FY12 FY13 FY14E FY15E<br />
P/E 10.2 9.7 9.8 7.7<br />
Target P/E 12.4 11.9 12.0 9.4<br />
EV / EBITDA 7.7 7.6 7.2 6.1<br />
P/BV 1.8 1.5 1.3 1.2<br />
RoNW 17.7 15.7 13.6 15.0<br />
RoCE 16.2 15.9 15.6 16.8<br />
Stock data<br />
Market Capitalization<br />
| 1502.3 Crore<br />
Total Debt (FY13)<br />
| 384.1 Crore<br />
Cash and Investments (FY13)<br />
| 172.5 Crore<br />
EV<br />
| 1713.9 Crore<br />
52 week H/L 224 / 156<br />
Equity capital<br />
| 91.8 Crore<br />
Face value | 10<br />
MF Holding (%) 2.9<br />
FII Holding (%) 9.4<br />
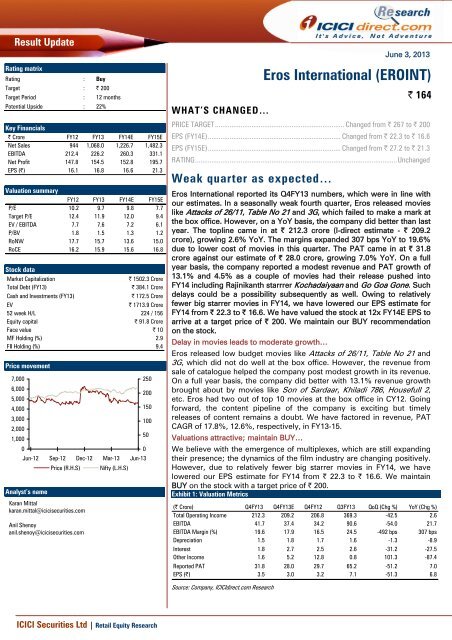
Price movement<br />
7,000<br />
6,000<br />
5,000<br />
4,000<br />
3,000<br />
2,000<br />
1,000<br />
0<br />
Jun-12<br />
Analyst’s name<br />
Sep-12<br />
Price (R.H.S)<br />
Dec-12<br />
Karan Mittal<br />
karan.mittal@icicisecurities.<strong>com</strong><br />
Anil Shenoy<br />
anil.shenoy@icicisecurities.<strong>com</strong><br />
Mar-13<br />
Nifty (L.H.S)<br />
250<br />
200<br />
150<br />
100<br />
50<br />
0<br />
Jun-13<br />
WHAT’S CHANGED…<br />
June 3, 2013<br />
PRICE TARGET ....................................................................... Changed from | 267 to | 200<br />
EPS (FY14E)......................................................................... Changed from | 22.3 to | 16.6<br />
EPS (FY15E)......................................................................... Changed from | 27.2 to | 21.3<br />
RATING...............................................................................................................Unchanged<br />
Weak quarter as expected…<br />
<strong>Eros</strong> <strong>International</strong> (<strong>EROINT</strong>)<br />
| 164<br />
<strong>Eros</strong> <strong>International</strong> reported its Q4FY13 numbers, which were in line with<br />
our estimates. In a seasonally weak fourth quarter, <strong>Eros</strong> released movies<br />
like Attacks of 26/11, Table No 21 and 3G, which failed to make a mark at<br />
the box office. However, on a YoY basis, the <strong>com</strong>pany did better than last<br />
year. The topline came in at | 212.3 crore (I-direct estimate - | 209.2<br />
crore), growing 2.6% YoY. The margins expanded 307 bps YoY to 19.6%<br />
due to lower cost of movies in this quarter. The PAT came in at | 31.8<br />
crore against our estimate of | 28.0 crore, growing 7.0% YoY. On a full<br />
year basis, the <strong>com</strong>pany reported a modest revenue and PAT growth of<br />
13.1% and 4.5% as a couple of movies had their release pushed into<br />
FY14 including Rajinikanth starrrer Kochadaiyaan and Go Goa Gone. Such<br />
delays could be a possibility subsequently as well. Owing to relatively<br />
fewer big starrer movies in FY14, we have lowered our EPS estimate for<br />
FY14 from | 22.3 to | 16.6. We have valued the stock at 12x FY14E EPS to<br />
arrive at a target price of | 200. We maintain our BUY re<strong>com</strong>mendation<br />
on the stock.<br />
Delay in movies leads to moderate growth…<br />
<strong>Eros</strong> released low budget movies like Attacks of 26/11, Table No 21 and<br />
3G, which did not do well at the box office. However, the revenue from<br />
sale of catalogue helped the <strong>com</strong>pany post modest growth in its revenue.<br />
On a full year basis, the <strong>com</strong>pany did better with 13.1% revenue growth<br />
brought about by movies like Son of Sardaar, Khiladi 786, Housefull 2,<br />
etc. <strong>Eros</strong> had two out of top 10 movies at the box office in CY12. Going<br />
forward, the content pipeline of the <strong>com</strong>pany is exciting but timely<br />
releases of content remains a doubt. We have factored in revenue, PAT<br />
CAGR of 17.8%, 12.6%, respectively, in FY13-15.<br />
Valuations attractive; maintain BUY…<br />
We believe with the emergence of multiplexes, which are still expanding<br />
their presence; the dynamics of the film industry are changing positively.<br />
However, due to relatively fewer big starrer movies in FY14, we have<br />
lowered our EPS estimate for FY14 from | 22.3 to | 16.6. We maintain<br />
BUY on the stock with a target price of | 200.<br />
Exhibit 1: Valuation Metrics<br />
(| Crore) Q4FY13 Q4FY13E Q4FY12 Q3FY13 QoQ (Chg %) YoY (Chg %)<br />
Total Operating In<strong>com</strong>e 212.3 209.2 206.8 369.3 -42.5 2.6<br />
EBITDA 41.7 37.4 34.2 90.6 -54.0 21.7<br />
EBITDA Margin (%) 19.6 17.9 16.5 24.5 -492 bps 307 bps<br />
Depreciation 1.5 1.8 1.7 1.6 -1.3 -8.9<br />
Interest 1.8 2.7 2.5 2.6 -31.2 -27.5<br />
Other In<strong>com</strong>e 1.6 5.2 12.8 0.8 101.3 -87.4<br />
Reported PAT 31.8 28.0 29.7 65.2 -51.2 7.0<br />
EPS (|) 3.5 3.0 3.2 7.1 -51.3 6.8<br />
Source: Company, ICICIdirect.<strong>com</strong> Research<br />
ICICI Securities Ltd | Retail Equity Research
Exhibit 2: Assumption<br />
FY13E FY14E FY15E<br />
Movies Released<br />
A 4 6 7<br />
B 7 7 8<br />
C 7 8 9<br />
D 12 12 14<br />
Regional languages 47 52 54<br />
Source: Company, ICICIdirect.<strong>com</strong> Research<br />
Result analysis<br />
Weak quarter; movies fail to impress…<br />
<strong>Eros</strong> released low budget movies like Attacks of 26/11, Table No 21 and<br />
3G, which failed to leave a mark at the box office. However, the revenue<br />
from sale of catalogue helped the <strong>com</strong>pany post modest growth in its<br />
revenue.<br />
With movies not doing so well, the margins of the <strong>com</strong>pany fell sharply<br />
on a QoQ basis but improved 307 bps on a YoY basis to 19.6% as a<br />
relatively big budget movie failed at the box office in Q4FY12.<br />
Exhibit 3: Margins trend<br />
30.0<br />
25.0<br />
27.0<br />
24.7<br />
24.5<br />
%<br />
20.0<br />
15.0<br />
10.0<br />
19.4<br />
14.1<br />
15.6<br />
16.9<br />
16.5<br />
14.4<br />
20.1<br />
18.4<br />
12.2 11.4<br />
17.7<br />
19.6<br />
15.0<br />
5.0<br />
-<br />
Q1FY12 Q2FY12 Q3FY12 Q4FY12 Q1FY13 Q2FY13 Q3FY13 Q4FY13<br />
EBITDA margin<br />
PAT margin<br />
Source: Company, ICICIdirect.<strong>com</strong> Research<br />
Going forward, <strong>Eros</strong> has a mixed movie pipeline with big starrer movies<br />
like Kochadaiyaan, Happy Ending, Yeh Jawani Hai Diwani (overseas) and<br />
Krrish 3 (overseas) along with other lower budget movies.<br />
Exhibit 4: Movie Pipeline<br />
Movie name<br />
Starcast / (Director)<br />
Ye Jawani Hai Deewani (Overseas) Ranbir Kapoor, Deepika Padukone (Ayan Mukerji)<br />
Raanjhanaa<br />
Dhanush, Sonam Kapoor (Anand Rai)<br />
Warning (3D)<br />
Santosh Barmola, Madhurima Tuli ( Anubhav Sinha)<br />
Bajate Raho<br />
Tushar Kapoor, Vir Das, Vinay Patak (Shashant Shah)<br />
Kochadaiyaan (Tamil, Hindi, Telugu) Rajnikanth, Deepika Padukone (Soundarya Rajnikanth)<br />
Rangeeley (Punjabi)<br />
Jimmy Shergil & others<br />
Dishkiyaaoon<br />
Sunny Deol, Haman Baweja (Sanamjit Singh Talwar)<br />
Ram Leela<br />
Ranvir Singh, Deepika Padukone ( Sanjay Leela Bansali)<br />
Tanu Weds Manu Season 2<br />
R Madhavan, Kangana Ranaut ( Anand Raj)<br />
Rambo Rajkumar<br />
Shahid Kapoor, Sonakshi Sinha (Prabhu Deva)<br />
Singh Saab the Great<br />
Sunny Deol (Anil Sharma)<br />
Krrish 3 (Overseas)<br />
Hrithik Roshan, Priyanka Chopra (Rakesh Roshan)<br />
Happy Ending<br />
Saif Ali Khan<br />
Chalo China<br />
Lara Dutta, Vinay Patak<br />
Boney Kapoor (untitled) Arjun Kapoor (Okkadu remake)<br />
Source: Company, ICICIdirect.<strong>com</strong> Research<br />
ICICI Securities Ltd | Retail Equity Research Page 2
Outlook & valuation<br />
The results of the quarter were in line with our estimates in spite of the<br />
postponement of Kochadaiyaan from Q4FY13 to Q2FY14. On a full year<br />
basis, the <strong>com</strong>pany posted revenue growth of 13.1%, in spite of the delay<br />
in Kochadaiyaan. However, such delays can be expected subsequently as<br />
well prompting us to revise our earlier estimates of number of movies<br />
released subsequently.<br />
The cost of acquiring movies has been rising sharply and the<br />
management indicated that the <strong>com</strong>pany would restrain from bidding<br />
aggressively in line with its strategy of focussing on profitability. Though<br />
this strategy would help the margins, revenue growth of the <strong>com</strong>pany,<br />
until the content price corrects, would be under pressure. Also, the<br />
<strong>com</strong>pany’s current line up has relatively fewer big starrer movies in FY14.<br />
However, we continue to believe in the changing dynamics of the film<br />
industry brought about by emergence of multiplexes. Multiplexes like<br />
PVR have plans of aggressive expansion, which would further benefit<br />
producers/distributors. Also, with investment in newer streams of<br />
revenue monetisation like the online portal <strong>Eros</strong>now and launching of two<br />
channels with HBO would further help drive the <strong>com</strong>pany’s revenue.<br />
<strong>Eros</strong> is trading at a significant discount to other media businesses and we<br />
believe a re-rating of the stock is on the cards. We continue to value the<br />
stock at 12x FY14E EPS to arrive at a target price of | 200. We maintain<br />
BUY.<br />
Exhibit 5: Valuation<br />
Sales Growth EPS Growth PE EV/EBITDA RoNW RoCE<br />
(| cr) (%) (|) (%) (x) (x) (%) (%)<br />
FY12 943.9 33.5 16.1 26.1 10.2 7.7 17.7 16.2<br />
FY13 1068.0 13.1 16.8 4.3 9.7 7.6 15.7 15.9<br />
FY14E 1226.7 14.9 16.6 -1.0 9.8 7.2 13.6 15.6<br />
FY15E 1482.3 20.8 21.3 28.1 7.7 6.1 15.0 16.8<br />
Source: Company, ICICIdirect.<strong>com</strong> Research<br />
ICICI Securities Ltd | Retail Equity Research Page 3
Financial summary<br />
Profit and loss statement<br />
(| Crore)<br />
(Year-end March) FY12 FY13 FY14E FY15E<br />
Total operating In<strong>com</strong>e 943.9 1,068.0 1,226.7 1,482.3<br />
Growth (%) 33.5 13.1 14.9 20.8<br />
Operating Expenses 662.5 763.2 879.2 1,057.8<br />
Employee Expenses 22.6 27.3 28.2 29.6<br />
Administrative Expenses 46.4 51.2 58.9 63.7<br />
Total Operating Expenditure 731.5 841.7 966.3 1,151.2<br />
EBITDA 212.4 226.2 260.3 331.1<br />
Growth (%) 36.0 6.5 15.1 27.2<br />
Depreciation 6.0 6.5 8.4 12.3<br />
Interest 13.4 9.2 15.0 18.1<br />
Other In<strong>com</strong>e 19.3 6.4 10.0 10.0<br />
PBT 212.3 217.0 247.0 310.7<br />
Total Tax 63.1 61.2 92.5 113.0<br />
Minority Interest 1.3 1.3 1.7 2.0<br />
PAT 147.8 154.5 152.8 195.7<br />
Growth (%) 26.1 4.5 -1.1 28.1<br />
EPS (|) 16.1 16.8 16.6 21.3<br />
Source: Company, ICICIdirect.<strong>com</strong> Research<br />
Cash flow statement<br />
(| Crore)<br />
(Year-end March) FY12 FY13 FY14E FY15E<br />
Profit after Tax 147.8 154.5 152.8 195.7<br />
Add: Depreciation 249.5 354.1 478.4 507.6<br />
(Inc)/dec in Current Assets 321.5 26.5 -25.3 -40.6<br />
Inc/(dec) in CL and Provisions -137.5 -20.3 37.7 61.2<br />
Others 13.4 9.2 15.0 18.1<br />
CF from operating activities 594.7 524.0 658.5 742.0<br />
(Inc)/dec in Fixed Asset -583.1 -280.6 -314.4 -373.8<br />
Others -102.4 -307.3 -469.0 -494.0<br />
CF from investing activities -685.6 -587.9 -783.4 -867.9<br />
Issue/(Buy back) of Equity 0.3 0.2 0.0 0.0<br />
Inc/(dec) in loan funds 237.6 -52.2 100.0 100.0<br />
Dividend & dividend tax - (16.1) (16.1) (16.1)<br />
Others 2.5 4.1 -15.0 -18.1<br />
CF from financing activities 240.5 -64.0 68.9 65.8<br />
Net Cash flow 149.6 -127.9 -56.0 -60.1<br />
Opening Cash 150.8 300.4 172.5 116.5<br />
Closing Cash 300.4 172.5 116.5 56.4<br />
Source: Company, ICICIdirect.<strong>com</strong> Research<br />
Balance sheet<br />
(| Crore)<br />
(Year-end March) FY12 FY13 FY14E FY15E<br />
Liabilities<br />
Equity Capital 91.7 91.9 91.9 91.9<br />
ESOP's 1.9 - - -<br />
Reserve and Surplus 741.0 894.6 1,031.2 1,210.8<br />
Total Shareholders funds 834.6 986.5 1,123.1 1,302.8<br />
Total Debt 436.2 384.1 484.1 584.1<br />
Other Non Current Liabilities 118.4 169.8 171.5 173.5<br />
Total Liabilities 1,389.2 1,540.4 1,778.7 2,060.3<br />
Assets<br />
Gross Block 1,903.9 2,654.5 3,464.2 4,436.4<br />
Less: Acc Depreciation 1,375.1 1,851.6 2,355.3 2,965.9<br />
Net Block 528.8 802.9 1,108.9 1,470.5<br />
Capital WIP 428.0 428.0 428.0 428.0<br />
Total Fixed Assets 956.8 1,230.9 1,536.9 1,898.5<br />
Investments 51.5 8.2 8.2 8.2<br />
Inventory 7.0 9.6 11.0 13.3<br />
Debtors 245.0 215.0 235.3 264.0<br />
Loans and Advances 40.0 49.2 50.8 55.3<br />
Other Current Assets 65.1 56.9 58.8 64.0<br />
Cash 300.4 172.5 116.5 56.4<br />
Total Current Assets 657.5 503.1 472.4 452.9<br />
Creditors 280.7 250.2 287.4 347.2<br />
Provisions 4.3 14.4 14.9 16.2<br />
Total Current Liabilities 285.0 264.6 302.3 363.5<br />
Net Current Assets 372.5 238.5 170.1 89.4<br />
Other Non Current Assets 6.9 60.6 60.6 60.6<br />
Deffered tax assets 1.5 2.2 2.9 3.6<br />
Application of Funds 1,389.2 1,540.4 1,778.7 2,060.3<br />
Source: Company, ICICIdirect.<strong>com</strong> Research<br />
Key ratios<br />
(Year-end March) FY12 FY13 FY14E FY15E<br />
Per share data (|)<br />
EPS 16.1 16.8 16.6 21.3<br />
Cash EPS 16.8 17.5 17.6 22.7<br />
BV 90.9 107.3 122.4 142.0<br />
DPS 0.0 1.5 1.5 1.5<br />
Cash Per Share 32.7 18.8 12.7 6.1<br />
Operating Ratios (%)<br />
EBITDA Margin 22.5 21.2 21.2 22.3<br />
PBT / Total Operating in<strong>com</strong>e 22.5 20.3 20.1 21.0<br />
PAT Margin 15.7 14.5 12.5 13.2<br />
Inventory days 2.7 3.3 3.3 3.3<br />
Debtor days 94.7 73.5 70.0 65.0<br />
Creditor days 108.5 85.5 85.5 85.5<br />
Return Ratios (%)<br />
RoE 17.7 15.7 13.6 15.0<br />
RoCE 16.2 15.9 15.6 16.8<br />
RoIC 19.1 16.8 15.8 16.4<br />
Valuation Ratios (x)<br />
P/E 10.2 9.7 9.8 7.7<br />
EV / EBITDA 7.7 7.6 7.2 6.1<br />
EV / Net Sales 1.7 1.6 1.5 1.4<br />
Market Cap / Sales 1.6 1.4 1.2 1.0<br />
Price to Book Value 1.8 1.5 1.3 1.2<br />
Solvency Ratios<br />
Debt/EBITDA 2.1 1.7 1.9 1.8<br />
Debt / Equity 0.5 0.4 0.4 0.4<br />
Current Ratio 2.3 1.9 1.6 1.2<br />
Quick Ratio 2.3 1.9 1.5 1.2<br />
Source: Company, ICICIdirect.<strong>com</strong> Research<br />
ICICI Securities Ltd | Retail Equity Research Page 4
Company Description<br />
<strong>Eros</strong> <strong>International</strong> Media Ltd is a leading <strong>com</strong>pany in the Indian film<br />
entertainment industry that acquires, co-produces and distributes Indian<br />
language films in multiple formats. The <strong>com</strong>pany was incorporated in<br />
1994 and listed in 2010.<br />
<strong>Eros</strong> co-produces 60% of the movies while the rest are either acquired or<br />
produced. The <strong>com</strong>pany has had long industry associations, a consistent<br />
track record of releasing three to four movies of the top 10 movies in the<br />
box office and a wide distribution network. <strong>Eros</strong> has been able to develop<br />
strong relationships with key figures in the Indian film industry, which<br />
help it secure key films and build a strong portfolio of movies. Some of<br />
the big starrer movies to which <strong>Eros</strong> has the rights include Ra.One,<br />
Housefull, Housefull 2, Ready, Rockstar, Golmaal 3, Om Shanti Om, Hey<br />
Babyy, Love Aaj Kal, De Dana Dan, etc.<br />
Exhibit 6: Re<strong>com</strong>mendation History<br />
300<br />
250<br />
200<br />
150<br />
100<br />
50<br />
0<br />
Jun-12<br />
Jul-12<br />
Sep-12<br />
Oct-12<br />
Dec-12<br />
Jan-13<br />
Mar-13<br />
Apr-13<br />
Jun-13<br />
Price<br />
Target Price<br />
Source: Reuters, ICICIdirect.<strong>com</strong> Research<br />
Exhibit 7: Recent Releases<br />
Date Event CMP Target Price Rating<br />
4-Jan-13 Initiating Coverage 207 267 BUY<br />
8-Jan-13 Q3FY13 Result Preview 209 267 BUY<br />
15-Feb-13 Q3FY13 Result Update 192 267 BUY<br />
8-Apr-13 Q4FY13 Result Preview 171 267 BUY<br />
Source: Company, ICICIdirect.<strong>com</strong> Research<br />
ICICI Securities Ltd | Retail Equity Research Page 5
ICICIdirect.<strong>com</strong> coverage universe (Media)<br />
CMP<br />
M Cap<br />
EPS (|) P/E (x) EV/EBITDA (x)<br />
RoCE (%) RoE (%)<br />
Sector / Company (|) TP(|) Rating (| Cr) FY12 FY13E FY14E FY12 FY13E FY14E FY12 FY13E FY14E FY12 FY13E FY14E FY12 FY13E FY14E<br />
DB Corp (DBCORP) 246 274 Buy 4,467 11.0 11.9 13.6 24.8 23.0 20.1 14.1 13.3 11.3 26.6 27.2 27.3 21.7 21.2 20.7<br />
DISH TV (DISHTV) 66 65 Hold 7,047 -1.3 -0.6 -1.5 NM NM NM 15.9 12.8 12.2 NM NM NM NM NM NM<br />
ENIL (ENTNET) 242 282 Buy 1,155 11.8 14.3 15.4 20.6 16.9 15.7 9.3 7.9 6.2 15.3 14.5 15.4 12.8 13.6 12.9<br />
<strong>Eros</strong> (<strong>EROINT</strong>) 164 200 Buy 1,502 16.1 16.8 16.6 10.2 9.7 9.8 7.7 7.6 7.2 16.2 15.9 15.6 17.7 15.7 13.6<br />
Hathway Cables (HATCAB) 276 320 Buy 4,579 -3.4 1.1 1.7 NM 251.5 NM 24.7 16.9 12.8 1.8 6.1 7.8 NM 1.9 2.9<br />
HT Media (HTMED) 100 112 Buy 2,346 7.0 7.1 8.1 14.2 14.0 12.4 8.8 9.1 7.4 10.1 9.0 9.4 11.4 10.5 10.7<br />
PVR (PVRLIM) 330 369 Buy 856 9.8 11.2 16.6 33.7 29.4 19.9 18.4 15.2 8.1 9.0 6.0 9.2 9.1 6.9 9.3<br />
Sun TV (SUNTV) 423 498 Buy 19,642 17.6 17.2 21.9 24.0 24.6 19.3 11.6 11.5 8.9 35.7 32.1 36.5 26.6 23.5 26.3<br />
ZEE Ent. (ZEETEL) 236 268 Buy 22,642 6.1 7.1 8.7 38.4 33.1 27.3 30.2 24.9 19.3 20.5 21.6 23.7 17.1 17.3 18.0<br />
Source: Company, ICICIdirect.<strong>com</strong> Research<br />
ICICI Securities Ltd | Retail Equity Research Page 6
RATING RATIONALE<br />
ICICIdirect.<strong>com</strong> endeavours to provide objective opinions and re<strong>com</strong>mendations. ICICIdirect.<strong>com</strong> assigns<br />
ratings to its stocks according to their notional target price vs. current market price and then categorises them<br />
as Strong Buy, Buy, Hold and Sell. The performance horizon is two years unless specified and the notional<br />
target price is defined as the analysts' valuation for a stock.<br />
Strong Buy: >15%/20% for large caps/midcaps, respectively, with high conviction;<br />
Buy: >10%/15% for large caps/midcaps, respectively;<br />
Hold: Up to +/-10%;<br />
Sell: -10% or more;<br />
Pankaj Pandey Head – Research pankaj.pandey@icicisecurities.<strong>com</strong><br />
ICICIdirect.<strong>com</strong> Research Desk,<br />
ICICI Securities Limited,<br />
1st Floor, Akruti Trade Centre,<br />
Road No 7, MIDC,<br />
Andheri (East)<br />
Mumbai – 400 093<br />
research@icicidirect.<strong>com</strong><br />
ANALYST CERTIFICATION<br />
We /I, Karan Mittal MBA, Anil Shenoy MBA research analysts, authors and the names subscribed to this report, hereby certify that all of the views expressed in this research report accurately reflect our<br />
personal views about any and all of the subject issuer(s) or securities. We also certify that no part of our <strong>com</strong>pensation was, is, or will be directly or indirectly related to the specific re<strong>com</strong>mendation(s) or<br />
view(s) in this report. Analysts aren't registered as research analysts by FINRA and might not be an associated person of the ICICI Securities Inc.<br />
Disclosures:<br />
ICICI Securities Limited (ICICI Securities) and its affiliates are a full-service, integrated investment banking, investment management and brokerage and financing group. We along with affiliates are leading<br />
underwriter of securities and participate in virtually all securities trading markets in India. We and our affiliates have investment banking and other business relationship with a significant percentage of<br />
<strong>com</strong>panies covered by our Investment Research Department. Our research professionals provide important input into our investment banking and other business selection processes. ICICI Securities<br />
generally prohibits its analysts, persons reporting to analysts and their dependent family members from maintaining a financial interest in the securities or derivatives of any <strong>com</strong>panies that the analysts<br />
cover.<br />
The information and opinions in this report have been prepared by ICICI Securities and are subject to change without any notice. The report and information contained herein is strictly confidential and<br />
meant solely for the selected recipient and may not be altered in any way, transmitted to, copied or distributed, in part or in whole, to any other person or to the media or reproduced in any form, without<br />
prior written consent of ICICI Securities. While we would endeavour to update the information herein on reasonable basis, ICICI Securities, its subsidiaries and associated <strong>com</strong>panies, their directors and<br />
employees (“ICICI Securities and affiliates”) are under no obligation to update or keep the information current. Also, there may be regulatory, <strong>com</strong>pliance or other reasons that may prevent ICICI Securities<br />
from doing so. Non-rated securities indicate that rating on a particular security has been suspended temporarily and such suspension is in <strong>com</strong>pliance with applicable regulations and/or ICICI Securities<br />
policies, in circumstances where ICICI Securities is acting in an advisory capacity to this <strong>com</strong>pany, or in certain other circumstances.<br />
This report is based on information obtained from public sources and sources believed to be reliable, but no independent verification has been made nor is its accuracy or <strong>com</strong>pleteness guaranteed. This<br />
report and information herein is solely for informational purpose and may not be used or considered as an offer document or solicitation of offer to buy or sell or subscribe for securities or other financial<br />
instruments. Though disseminated to all the customers simultaneously, not all customers may receive this report at the same time. ICICI Securities will not treat recipients as customers by virtue of their<br />
receiving this report. Nothing in this report constitutes investment, legal, accounting and tax advice or a representation that any investment or strategy is suitable or appropriate to your specific<br />
circumstances. The securities discussed and opinions expressed in this report may not be suitable for all investors, who must make their own investment decisions, based on their own investment<br />
objectives, financial positions and needs of specific recipient. This may not be taken in substitution for the exercise of independent judgment by any recipient. The recipient should independently evaluate<br />
the investment risks. The value and return of investment may vary because of changes in interest rates, foreign exchange rates or any other reason. ICICI Securities and affiliates accept no liabilities for any<br />
loss or damage of any kind arising out of the use of this report. Past performance is not necessarily a guide to future performance. Investors are advised to see Risk Disclosure Document to understand the<br />
risks associated before investing in the securities markets. Actual results may differ materially from those set forth in projections. Forward-looking statements are not predictions and may be subject to<br />
change without notice.<br />
ICICI Securities and its affiliates might have managed or co-managed a public offering for the subject <strong>com</strong>pany in the preceding twelve months. ICICI Securities and affiliates might have received<br />
<strong>com</strong>pensation from the <strong>com</strong>panies mentioned in the report during the period preceding twelve months from the date of this report for services in respect of public offerings, corporate finance, investment<br />
banking or other advisory services in a merger or specific transaction. It is confirmed that Karan Mittal MBA Anil Shenoy MBA research analysts and the authors of this report have not received any<br />
<strong>com</strong>pensation from the <strong>com</strong>panies mentioned in the report in the preceding twelve months. Our research professionals are paid in part based on the profitability of ICICI Securities, which include earnings<br />
from Investment Banking and other business.<br />
ICICI Securities or its subsidiaries collectively do not own 1% or more of the equity securities of the Company mentioned in the report as of the last day of the month preceding the publication of the<br />
research report.<br />
It is confirmed that Karan Mittal MBA Anil Shenoy MBA research analysts and the authors of this report or any of their family members does not serve as an officer, director or advisory board member of<br />
the <strong>com</strong>panies mentioned in the report.<br />
ICICI Securities may have issued other reports that are inconsistent with and reach different conclusion from the information presented in this report. ICICI Securities and affiliates may act upon or make use<br />
of information contained in the report prior to the publication thereof.<br />
This report is not directed or intended for distribution to, or use by, any person or entity who is a citizen or resident of or located in any locality, state, country or other jurisdiction, where such distribution,<br />
publication, availability or use would be contrary to law, regulation or which would subject ICICI Securities and affiliates to any registration or licensing requirement within such jurisdiction. The securities<br />
described herein may or may not be eligible for sale in all jurisdictions or to certain category of investors. Persons in whose possession this document may <strong>com</strong>e are required to inform themselves of and<br />
to observe such restriction.<br />
ICICI Securities Ltd | Retail Equity Research Page 7