Berger Paints Initiating Coverage - Myiris.com
Berger Paints Initiating Coverage - Myiris.com
Berger Paints Initiating Coverage - Myiris.com

Create successful ePaper yourself
Turn your PDF publications into a flip-book with our unique Google optimized e-Paper software.
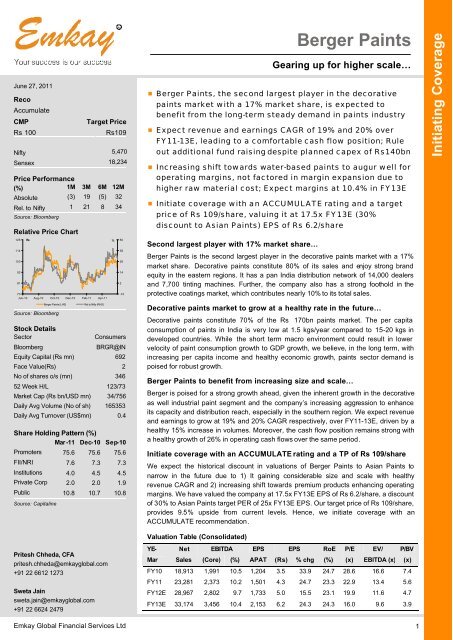
June 27, 2011<br />
Reco<br />
Accumulate<br />
CMP<br />
Rs 100<br />
Nifty<br />
Sensex<br />
Target Price<br />
Rs109<br />
5,470<br />
18,234<br />
Price Performance<br />
(%)<br />
1M 3M 6M 12M<br />
Absolute (3) 19 (5) 32<br />
Rel. to Nifty 1 21 8 34<br />
Source: Bloomberg<br />
Relative Price Chart<br />
125<br />
114<br />
103<br />
92<br />
81<br />
Rs<br />
70<br />
Jun-10 Aug-10 Oct-10 Dec-10 Feb-11 Apr-11<br />
Source: Bloomberg<br />
<strong>Berger</strong> <strong>Paints</strong> (LHS) Rel to Nifty (RHS)<br />
Stock Details<br />
Sector Consumers<br />
Bloomberg BRGR@IN<br />
Equity Capital (Rs mn) 692<br />
Face Value(Rs) 2<br />
No of shares o/s (mn) 346<br />
52 Week H/L 123/73<br />
Market Cap (Rs bn/USD mn)<br />
%<br />
50<br />
38<br />
26<br />
14<br />
2<br />
-10<br />
34/756<br />
Daily Avg Volume (No of sh) 165353<br />
Daily Avg Turnover (US$mn) 0.4<br />
Share Holding Pattern (%)<br />
Mar -11 Dec-10 Sep-10<br />
Promoters 75.6 75.6 75.6<br />
FII/NRI 7.6 7.3 7.3<br />
Institutions 4.0 4.5 4.5<br />
Private Corp 2.0 2.0 1.9<br />
Public 10.8 10.7 10.8<br />
Source: Capitaline<br />
Pritesh Chheda, CFA<br />
pritesh.chheda@emkayglobal.<strong>com</strong><br />
+91 22 6612 1273<br />
Sweta Jain<br />
sweta.jain@emkayglobal.<strong>com</strong><br />
+91 22 6624 2479<br />
� <strong>Berger</strong> <strong>Paints</strong>, the second largest player in the decorative<br />
paints market with a 17% market share, is expected to<br />
benefit from the long-term steady demand in paints industry<br />
� Expect revenue and earnings CAGR of 19% and 20% over<br />
FY11-13E, leading to a <strong>com</strong>fortable cash flow position; Rule<br />
out additional fund raising despite planned capex of Rs140bn<br />
� Increasing shift towards water-based paints to augur well for<br />
operating margins, not factored in margin expansion due to<br />
higher raw material cost; Expect margins at 10.4% in FY13E<br />
� Initiate coverage with an ACCUMULATE rating and a target<br />
price of Rs 109/share, valuing it at 17.5x FY13E (30%<br />
discount to Asian <strong>Paints</strong>) EPS of Rs 6.2/share<br />
Second largest player with 17% market share…<br />
<strong>Berger</strong> <strong>Paints</strong> is the second largest player in the decorative paints market with a 17%<br />
market share. Decorative paints constitute 80% of its sales and enjoy strong brand<br />
equity in the eastern regions. It has a pan India distribution network of 14,000 dealers<br />
and 7,700 tinting machines. Further, the <strong>com</strong>pany also has a strong foothold in the<br />
protective coatings market, which contributes nearly 10% to its total sales.<br />
Decorative paints market to grow at a healthy rate in the future…<br />
Decorative paints constitute 70% of the Rs 170bn paints market. The per capita<br />
consumption of paints in India is very low at 1.5 kgs/year <strong>com</strong>pared to 15-20 kgs in<br />
developed countries. While the short term macro environment could result in lower<br />
velocity of paint consumption growth to GDP growth, we believe, in the long term, with<br />
increasing per capita in<strong>com</strong>e and healthy economic growth, paints sector demand is<br />
poised for robust growth.<br />
<strong>Berger</strong> <strong>Paints</strong> to benefit from increasing size and scale…<br />
<strong>Berger</strong> is poised for a strong growth ahead, given the inherent growth in the decorative<br />
as well industrial paint segment and the <strong>com</strong>pany’s increasing aggression to enhance<br />
its capacity and distribution reach, especially in the southern region. We expect revenue<br />
and earnings to grow at 19% and 20% CAGR respectively, over FY11-13E, driven by a<br />
healthy 15% increase in volumes. Moreover, the cash flow position remains strong with<br />
a healthy growth of 26% in operating cash flows over the same period.<br />
Initiate coverage with an ACCUMULATE rating and a TP of Rs 109/share<br />
We expect the historical discount in valuations of <strong>Berger</strong> <strong>Paints</strong> to Asian <strong>Paints</strong> to<br />
narrow in the future due to 1) It gaining considerable size and scale with healthy<br />
revenue CAGR and 2) increasing shift towards premium products enhancing operating<br />
margins. We have valued the <strong>com</strong>pany at 17.5x FY13E EPS of Rs 6.2/share, a discount<br />
of 30% to Asian <strong>Paints</strong> target PER of 25x FY13E EPS. Our target price of Rs 109/share,<br />
provides 9.5% upside from current levels. Hence, we initiate coverage with an<br />
ACCUMULATE re<strong>com</strong>mendation.<br />
Valuation Table (Consolidated)<br />
<strong>Berger</strong> <strong>Paints</strong><br />
Gearing up for higher scale…<br />
YE- Net EBITDA EPS EPS RoE P/E EV/ P/BV<br />
Mar Sales (Core) (%) APAT (Rs) % chg (%) (x) EBITDA (x) (x)<br />
FY10 18,913 1,991 10.5 1,204 3.5 33.9 24.7 28.6 16.6 7.4<br />
FY11 23,281 2,373 10.2 1,501 4.3 24.7 23.3 22.9 13.4 5.6<br />
FY12E 28,967 2,802 9.7 1,733 5.0 15.5 23.1 19.9 11.6 4.7<br />
FY13E 33,174 3,456 10.4 2,153 6.2 24.3 24.3 16.0 9.6 3.9<br />
Emkay Global Financial Services Ltd 1<br />
<strong>Initiating</strong> <strong>Coverage</strong>
Second largest paints<br />
<strong>com</strong>pany in India<br />
Management profile<br />
Name Designation Remarks<br />
<strong>Berger</strong> <strong>Paints</strong> <strong>Initiating</strong> <strong>Coverage</strong><br />
Company Background<br />
<strong>Berger</strong> <strong>Paints</strong> started operations in 1923 in a small unit in Kolkata as Hadfields India Ltd.<br />
The current promoters, the Dhingra’s , entered the <strong>com</strong>pany in 1991 after acquiring UB<br />
Group’s stake in the <strong>com</strong>pany. <strong>Berger</strong> <strong>Paints</strong> is the second largest decorative paints<br />
<strong>com</strong>pany in the country. It derives almost ~80% of revenue from decorative paints and the<br />
balance from industrial paints -largely automotive and protective coatings. It has a wide<br />
variety of product portfolio including interior and exterior wall coatings as well as metal and<br />
wood paints. It has strong and well established brands like <strong>Berger</strong> Silk, <strong>Berger</strong> Rangoli,<br />
<strong>Berger</strong> Illusions, <strong>Berger</strong> Weather Coat, Jadoo Enamel, etc that span across mass to<br />
premium category of the market. It has eight manufacturing facilities with a total capacity of<br />
306,000 MT across India and four facilities overseas. It has 82+ depots with a widespread<br />
distribution network of 14,000 dealers across the country. <strong>Berger</strong> <strong>Paints</strong> has six subsidiaries<br />
and two JVs located across geographies including Cyprus, Russia, Poland and Nepal.<br />
The <strong>com</strong>pany has undergone many change of hands - In 1947, it was acquired by British<br />
<strong>Paints</strong> (Holdings), UK, which renamed the <strong>com</strong>pany as British <strong>Paints</strong> (India). The UK<br />
<strong>com</strong>pany was then acquired by Celanese Corporation, which later sold the Indian <strong>com</strong>pany<br />
to <strong>Berger</strong>, Jenson Nicholson Ltd in 1969. In 1983, the <strong>com</strong>pany was rechristened as <strong>Berger</strong><br />
<strong>Paints</strong> India and it started using the trade name of <strong>Berger</strong>.<br />
Kuldeep Singh Dhingra Chairman Mr. Dhingra, the Chairman, has been a director of the <strong>com</strong>pany since July, 1991. Mr. Dhingra is<br />
a graduate and promoter of the <strong>com</strong>pany and has a long standing experience in paints and<br />
related industries.<br />
Gurbachan Singh Dhingra Vice Chairman Mr. Dhingra has been the director of the <strong>com</strong>pany since 1993. He is a graduate and has<br />
considerable experience in the paint industry, especially in its technical aspects.<br />
Subir Bose Managing Director Mr. Bose is a B.Tech (Chemical) from IIT, Kanpur & PGDM from IIM, Ahmedabad having over 36<br />
years of work experience. He started his career with Asian <strong>Paints</strong> and prior to joining <strong>Berger</strong> in<br />
1984, he was associated with Abukon Nigeria Ltd.<br />
Abhijit Roy Director and Chief<br />
Operating Officer<br />
Srijit Dasgupta Director and Chief<br />
Financial Officer<br />
Source: Company, Emkay Research<br />
Snapshot on subsidiaries and joint ventures<br />
Name Holding Remarks<br />
Mr. Roy is a B.E (Mech) from Jadavpur University, Kolkata & PGDM from IIM, Bangalore having<br />
over 19 years of work experience. He started his career with Asian <strong>Paints</strong> Limited and prior to<br />
joining <strong>Berger</strong>, he was associated with ICI (India) Limited.<br />
Mr. Dasgupta is a B.Sc (Hons) from Calcutta University, AICWA & Company Secretary having<br />
over 27 years of work experience.<br />
Beepee Coatings Private Limited, India 100% Entire facility dedicated to processing of <strong>com</strong>pany unit's. Recorded sales of Rs 102 mn<br />
and PAT of Rs 6 mn in FY10.<br />
<strong>Berger</strong> Jenson & Nicholson, Nepal 100% Commenced its second decorative plant with a capacity of 18,000 MT in FY10. Recorded<br />
sales of Rs 305 mn with PAT of Rs 34 mn.<br />
<strong>Berger</strong> <strong>Paints</strong> (Cyprus) Limited, Cyprus 100% It is a SPV for overseas investments for <strong>Berger</strong> <strong>Paints</strong><br />
<strong>Berger</strong> <strong>Paints</strong> Overseas Limited, Russia 100% It was affected by the global slowdown in FY10 and hence, recorded a net loss of Rs 15<br />
mn in FY10.<br />
Lusako Trading Limited, Cyprus 100% It is a SPV for overseas investments for <strong>Berger</strong> <strong>Paints</strong><br />
Bolix S.A., Poland 100% Acquired in FY09 for USD 38 mn; Technology leaders in External Insulation Finishing<br />
Systems (EIFS) in the B2B segment in Poland and neighbouring countries such as<br />
Ukraine, Russia and the Baltic states.<br />
<strong>Berger</strong> Becker Coatings Private Limited, India 49% A joint venture with Becker Industrial Coatings, it offers a range of wood coating products<br />
BNB Coatings India Limited, India 49% The Company’s joint venture with Nippon Bee Chemicals Co. Ltd. of Japan (NBC) for<br />
manufacture of coatings for plastic substrates of automobiles.<br />
Source: Company, Emkay Research<br />
Emkay Research 27 June 2011 2
Holds 17% market share<br />
with 14,000 dealers and<br />
7,700 tinting machines<br />
Increasing its capacity by<br />
52% over the next two<br />
years<br />
<strong>Berger</strong> <strong>Paints</strong> <strong>Initiating</strong> <strong>Coverage</strong><br />
Investment Rationale<br />
Second largest player in the decorative paints market…<br />
<strong>Berger</strong> <strong>Paints</strong> , with a 17% market share, is the second largest <strong>com</strong>pany in the Rs120bn<br />
worth decorative paints market. This market is characterized as an oligopoly with 4-5<br />
players constituting majority of the market. <strong>Berger</strong> <strong>Paints</strong> has a strong foothold in the<br />
eastern markets with strategically located plants there. Moreover, it has a strong distribution<br />
network including 80+ exclusive stock points and 14,000 dealers to service the decorative<br />
paint market across India. Rising consumerism in the country is expected to drive higher<br />
demand for decorative paints in future, and we believe <strong>Berger</strong> <strong>Paints</strong> is well placed to<br />
benefit from this.<br />
Competitive landscape<br />
Company<br />
Decorative<br />
market share<br />
Competitive position<br />
<strong>Berger</strong> <strong>Paints</strong> 17% Second largest player in the decorative market. In industrial<br />
coatings, it is the leader in the protective coatings market<br />
Asian <strong>Paints</strong> 53% It is the market leader in the decorative segment but lags<br />
second in the industrial segment<br />
Kansai Nerolac 10% Kansai is the largest player in the industrial segment and<br />
is the third largest player in the decorative segment<br />
Akzo Nobel 9% Strong player in the premium decorative paint segment<br />
Source: Company, Emkay Research<br />
Strong place in protective coatings; expect industrial paints growth at 14%<br />
Industrial paints constitute 20% of total sales for <strong>Berger</strong> <strong>Paints</strong>. Industrial paint market is<br />
worth Rs 50 bn and growing at 10-12% every year. The <strong>com</strong>pany has strong technical<br />
collaborations with DuPont Performance Coatings for automotive coatings. It also<br />
<strong>com</strong>mands a strong leadership position in the protective coatings segment, which<br />
contributes 50% of its industrial sales . Taking cue from our capital goods and auto team<br />
estimates of 17% and 12% growth, we have modeled a 14% growth rate for industrial paints<br />
segment in our FY13E estimates.<br />
Industrial paints constitute 20% of FY11 sales<br />
Source: Company<br />
Emkay Research 27 June 2011 3<br />
20%<br />
Decorative paints Industrial paints<br />
Growing stronger…with considerable size and scale<br />
<strong>Berger</strong> <strong>Paints</strong> has developed a strong dealer network of 14,000 dealers with 7,700 tinting<br />
machines <strong>com</strong>pared to 27,000 dealers and 17,000 tinting machines with Asian <strong>Paints</strong>. With<br />
a strong market foothold in the eastern and northern regions, <strong>Berger</strong> <strong>Paints</strong> is gaining<br />
momentum in the southern markets with its franchisee stores (40+ in nos.). It plans to scale<br />
these stores by 40-50 nos. in the <strong>com</strong>ing years. Further, the <strong>com</strong>pany has embarked on an<br />
aggressive expansion plan to increase its production capacity by 52%, through the addition<br />
of 160,000 MT (Phase I and II at a cost of Rs 1.4 bn) capacity plant (scalable to 320,000<br />
MT) in Andhra Pradesh over the next 2 years.<br />
80%
We expect revenue momentum to<br />
continue with 19% revenue<br />
CAGR over FY11-13E<br />
<strong>Berger</strong> <strong>Paints</strong> <strong>Initiating</strong> <strong>Coverage</strong><br />
Gaining strength… in <strong>com</strong>parison to Asian <strong>Paints</strong><br />
Particulars <strong>Berger</strong> <strong>Paints</strong> Asian <strong>Paints</strong><br />
Stronger regions East and North with<br />
increasing presence in South<br />
Dealer network 14,000 27,000<br />
Tinting machines 7,700 17,000<br />
South and West with<br />
a pan India presence<br />
Total current capacity 306,000 MT 595,000 MT<br />
Expansion plans 160,000 MT* 300,000 MT<br />
* Scalable to 320,000 MT<br />
Moreover, we believe <strong>Berger</strong> <strong>Paints</strong>, with a strong second position in the decorative paints<br />
market, is well placed to benefit from the rising paint consumption in the country. The paints<br />
market is poised for a robust growth momentum in the long term, driven by increasing per<br />
capita consumption- currently at 1.5 kg/year <strong>com</strong>pared to 20 kg/year in developed<br />
countries .<br />
<strong>Berger</strong> <strong>Paints</strong> has recorded strong 18% revenue CAGR over FY06-11 and we expect it to<br />
sustain its growth momentum going ahead. We expect the <strong>com</strong>pany to post a 19% revenue<br />
CAGR over FY11-13E, gaining a considerable revenue base of Rs 33 bn. (When Asian<br />
<strong>Paints</strong> was at this run-rate in FY06/07, it had recorded a 21% CAGR over FY06-11, gaining<br />
a critical size of Rs 77 bn.) While we are not factoring market share gains for <strong>Berger</strong> <strong>Paints</strong>,<br />
we believe the inherent growth in paints industry and the <strong>com</strong>pany’s aggressive focus on<br />
increasing its distribution reach will aid <strong>Berger</strong> <strong>Paints</strong> in attaining considerable size and<br />
scale in the future.<br />
Gaining considerable revenue size…<br />
Rs bn<br />
120<br />
100<br />
-<br />
80<br />
60<br />
40<br />
20<br />
<strong>Berger</strong> <strong>Paints</strong> Asian <strong>Paints</strong><br />
FY04 FY05 FY06 FY07 FY08 FY09 FY10 FY11 FY12 FY13<br />
Source: Company, Emkay Research<br />
Shift in product mix to augur well…<br />
<strong>Berger</strong> <strong>Paints</strong> is focus ing on raising the share of water-based paints in its total product<br />
portfolio and has also filled the product gap that existed with Asian <strong>Paints</strong>, through the<br />
introduction of premium products in the water-based paints. This shift of focus towards<br />
emulsions augurs well for the <strong>com</strong>pany as water-based paint is not only a high growth<br />
category, but also a higher margin product segment <strong>com</strong>pared to solvent-based paints.<br />
Increasing contribution from this segment will drive higher revenue growth and also expand<br />
operating margins in the future.<br />
Water-based paints to record higher growth…<br />
Category Industry Mix Remarks<br />
Water-based paints<br />
- Emulsions, Distempers<br />
Solvent-based paints<br />
- Enamels, Primers, Thinners<br />
Source: Company, Emkay Research<br />
60% growing at 20-25%<br />
40% growing at 6-10%<br />
Emkay Research 27 June 2011 4
Setting up a 160,000 MT<br />
capacity plant in AP – scalable<br />
to 320,000 MT<br />
<strong>Berger</strong> <strong>Paints</strong> <strong>Initiating</strong> <strong>Coverage</strong><br />
Scope for expansion in operating margins…<br />
Increasing focus on water-based emulsion paints , backward integration of its emulsion<br />
requirements and higher operating efficiencies as the <strong>com</strong>pany gains size and scale could<br />
possibly result in higher operating margins in the future. However, we have modeled in a<br />
flat operating margin scenario over FY11-13E, owing to higher raw material costs<br />
environment. Given its increasing focus on enhancing its margins, we do not rule out a<br />
possibility that <strong>Berger</strong> <strong>Paints</strong> could narrow the margin gap to Asian <strong>Paints</strong> in its growth<br />
phas e. (In FY04, Asian <strong>Paints</strong> with revenue of Rs 25 bn had EBITDA margin of 13.5%,<br />
whereas <strong>Berger</strong> <strong>Paints</strong>, in FY11, with revenue of Rs 23 bn has EBITDA margin of 10.2%).<br />
EBITDA margin gap with the leader…could narrow in future<br />
%<br />
25<br />
20<br />
15<br />
10<br />
5<br />
Source: Company, Emkay Research<br />
<strong>Berger</strong> <strong>Paints</strong> Asian <strong>Paints</strong><br />
FY06 FY07 FY08 FY09 FY10 FY11<br />
Strong capex plans provide visibility to sustainable volume growth<br />
Healthy demand has led <strong>Berger</strong> <strong>Paints</strong> to embark on a strong expansion plan to enhance its<br />
manufacturing capacities. The <strong>com</strong>pany plans to increase its capacity from 306,129 MT by<br />
52% over a period of 2 years. While it has already expended Rs 1.3 bn towards expansion<br />
in its Rishra and Goa plants, it plans to spend an additional Rs 1.4 bn in a greenfield plant<br />
in Andhra Pradesh over the next 2 years. This plant, with an initial capacity of 160,000 MT<br />
and scalability to 320,000 MT, is expected to <strong>com</strong>mercially start production (Phase I and II<br />
with a capacity of 160,000 MT) from FY14. We believe this will help <strong>Berger</strong> <strong>Paints</strong>, not only<br />
sustain volume growth but also give it a stronger presence in the southern markets and<br />
increase its capacity in water-based paints, which is a faster growing segment with a higher<br />
margin profile.<br />
Network of its production facilities Substantial increase in gross block<br />
Source: Company, Emkay Research<br />
Proposed unit in Hindupur (A.P.)<br />
(160,000 MT in Phase I & II)<br />
(Scalable to 320,000 MT)<br />
Howrah (28,560 MT)<br />
V V N (48,840 MT)<br />
Pondicherry (18,150 MT)<br />
Sikandrabad (21,639 MT)<br />
Goa (44,654 MT)<br />
Rishra (33,450 MT)<br />
Jammu (95,920 MT)<br />
Surajpur (14,916 MT)<br />
Emkay Research 27 June 2011 5<br />
Rs bn<br />
11.0<br />
10.0<br />
9.0<br />
8.0<br />
7.0<br />
6.0<br />
5.0<br />
FY09<br />
FY10<br />
FY11<br />
FY12E<br />
FY13E
Strong cash flow position to<br />
fund the planned capex over<br />
the next two years<br />
<strong>Berger</strong> <strong>Paints</strong> <strong>Initiating</strong> <strong>Coverage</strong><br />
Strong cash flow position…<br />
With healthy profit growth over FY11-13E, we expect operating cash flow to register strong<br />
CAGR of 26% over this period. We believe its cash position for the next two years is<br />
<strong>com</strong>fortably placed to meet its capex requirement for Phase I and II of Andhra Pradesh<br />
plant with an initial capacity of 160,000 MT. Hence, we do not expect the <strong>com</strong>pany to raise<br />
additional funds from outside over the next two years. In FY10, it had issued 20mn shares<br />
on warrant conversion to a promoter group <strong>com</strong>pany, Jenson and Nicholson and issued<br />
additional 7.2 mn shares to Nalanda Fund at Rs 50.5/share to fund its growth prospects,<br />
leading to a total dilution of 8% on the expanded equity capital. We do not expect <strong>Berger</strong><br />
<strong>Paints</strong> to dilute further equity, as it has sufficient internal accruals to fund its growth plans<br />
over the next two years.<br />
Cash flow position to remain healthy…<br />
Rs mn<br />
2,100<br />
1,400<br />
700<br />
0<br />
-700<br />
-1,400<br />
-2,100<br />
Source: Company, Emkay Research<br />
FY08 FY09 FY10 FY11 FY12E FY13E<br />
Cashflow from operations Free cashflow<br />
Emkay Research 27 June 2011 6
TiO2, 23% of raw material<br />
costs, is on a structural<br />
uptrend<br />
<strong>Berger</strong> <strong>Paints</strong> <strong>Initiating</strong> <strong>Coverage</strong><br />
Key Risks<br />
Raw material cost volatility<br />
Titanium dioxide (TiO2) is one of the main raw material inputs , constituting 23% of the total<br />
input cost and 10% of sales in FY10. The prices of titanium dioxide have been on an<br />
uptrend since FY10 and have increased by 32% YoY for 1QFY12. While continuing<br />
demand-supply mismatch is likely to keep the prices of titanium dioxide firm in the near<br />
future, prices of other raw materials like vegetable oils, crude oil, etc. continue to witness an<br />
inflationary scenario. Thus , firm prices will keep margins under pressure, owing to lag in<br />
product price increases .<br />
Trend in TiO2 price movement – Structural uptrend Uptrend in vegetable oil (index) price movement<br />
Rs/kg<br />
220<br />
200<br />
180<br />
160<br />
140<br />
120<br />
100<br />
1QFY09<br />
2QFY09<br />
3QFY09<br />
Source: Bloomberg, Capital line<br />
4QFY09<br />
1QFY10<br />
2QFY10<br />
3QFY10<br />
4QFY10<br />
1QFY11<br />
2QFY11<br />
3QFY11<br />
4QFY11<br />
1QFY12<br />
Emkay Research 27 June 2011 7<br />
Indexed Rs/ 10kg<br />
700<br />
650<br />
600<br />
550<br />
500<br />
450<br />
400<br />
<strong>Berger</strong> <strong>Paints</strong>, being second, is the price-taker…<br />
1QFY09<br />
2QFY09<br />
3QFY09<br />
<strong>Berger</strong> <strong>Paints</strong> is the second largest player and hence, is subject to the perils of not being<br />
the leader with a pricing power in the market place. While in the past, there have not been<br />
any significant instances of the leader, Asian <strong>Paints</strong>, taking an unwarranted move to disrupt<br />
the market structure, <strong>Berger</strong> <strong>Paints</strong>, being a price-taker, will always stand a risk to the<br />
pricing decisions of Asian <strong>Paints</strong>.<br />
Change in velocity could influence earnings estimates<br />
While the Indian economy has registered a healthy growth over the last decade, current<br />
high inflationary environment could lead to interest rate hike, which can hamper the demand<br />
for housing and new infrastructural development, in turn, affecting the velocity for paints<br />
demand. This could result in lower volumes and consequently, profit growth for the paint<br />
<strong>com</strong>panies. Nevertheless, the low per capita consumption of paints in India, at 1.5 kgs<br />
against 15-20 kgs in the developed countries, provides ample growth opportunities driven<br />
by increasing per capita in<strong>com</strong>e over a longer time period and rules out catastrophic impact<br />
in short-term.<br />
Trend in velocity of volumes: GDP growth Paint volumes highly correlated with GDP growth<br />
FY06 FY07 FY08 FY09 FY10 FY11<br />
GDP growth (%) 9.5 9.6 9.3 6.8 8.0 8.6<br />
Volume growth (%)* 13.1 16.4 16.5 10.8 16.0 17.3<br />
Velocity (x) 1.4 1.7 1.8 1.6 2.0 2.0<br />
* Volume growth is a <strong>com</strong>bination of Asian <strong>Paints</strong> and <strong>Berger</strong> <strong>Paints</strong><br />
Source: Company, Emkay Research<br />
%<br />
20<br />
15<br />
10<br />
5<br />
0<br />
4QFY09<br />
1QFY10<br />
2QFY10<br />
3QFY10<br />
4QFY10<br />
1QFY11<br />
2QFY11<br />
3QFY11<br />
4QFY11<br />
FY06 FY07 FY08 FY09 FY10 FY11<br />
GDP growth <strong>Berger</strong> <strong>Paints</strong> volume gowth<br />
1QFY12
We expect volume growth<br />
of 15% over FY11-13E<br />
<strong>Berger</strong> <strong>Paints</strong> <strong>Initiating</strong> <strong>Coverage</strong><br />
Financials<br />
Revenues to register 19% CAGR over FY11-13E<br />
<strong>Berger</strong> <strong>Paints</strong> witnessed 18% CAGR over FY06-11, driven by a strong up-tick in the paints<br />
demand leading to a healthy volume CAGR of 13%. While concerns on the short-term<br />
demand scenario persist, we believe over a longer term, the <strong>com</strong>pany is poised for a<br />
healthy growth. We have estimated 19% revenue CAGR over FY11-13E aided by healthy<br />
volume growth of 15% (at 1.9x GDP growth assumption of 8%). The <strong>com</strong>pany has already<br />
undertaken a 7% price hike in 1QFY12, which will further aid overall sales growth in <strong>com</strong>ing<br />
quarters. We expect the subsidiaries to contribute 7% to the consolidated sales by FY13E.<br />
Consolidated revenue growth trajectory Our assumptions for paints growth…<br />
Rs bn<br />
35<br />
30<br />
25<br />
20<br />
15<br />
10<br />
5<br />
0<br />
FY08 FY09 FY10 FY11 FY12E FY13E<br />
Source: Company, Emkay Research<br />
Sales (LHS) Growth (RHS)<br />
30<br />
25<br />
20<br />
15<br />
10<br />
5<br />
0<br />
%<br />
Operating margins to remain stable…<br />
(%) FY08 FY09 FY10 FY11 FY12E FY13E<br />
Volume growth 14.0 3.2 14.7 19.0 14.6 15.0<br />
Price growth 0.9 7.4 -5.9 4.8 10.0 0.0<br />
Value growth 15.0 10.9 7.9 24.7 26.0 15.0<br />
We expect <strong>Berger</strong> <strong>Paints</strong>’ consolidated operating margin to remain stable at 10.4% for<br />
FY13. While the <strong>com</strong>pany has undertaken 7% price hike in 1QFY12 and is adequately<br />
covered for its raw material requirement for this season, continuing high prices , especially<br />
of titanium dioxide, could keep margins under pressure. Nevertheless, as the product mix<br />
shifts towards water-based emulsion paints, there is scope for margin expansion in the<br />
future. With no incremental debt, we expect interest costs to remain at similar levels and<br />
hence, PAT to grow at 20% CAGR over FY11-13E.<br />
EBITDA margins to remain stable… PAT to grow at 20% CAGR over FY11-13E<br />
Rs bn<br />
4.0<br />
3.5<br />
3.0<br />
2.5<br />
2.0<br />
1.5<br />
1.0<br />
0.5<br />
0.0<br />
FY08 FY09 FY10 FY11 FY12E FY13E<br />
Source: Company, Emkay Research<br />
EBITDA EBITDA margin<br />
11.0<br />
10.5<br />
10.0<br />
9.5<br />
9.0<br />
8.5<br />
8.0<br />
7.5<br />
7.0<br />
%<br />
Emkay Research 27 June 2011 8<br />
Rs bn<br />
2.5<br />
2.0<br />
1.5<br />
1.0<br />
0.5<br />
0.0<br />
FY08 FY09 FY10 FY11 FY12E FY13E<br />
PAT PAT margin<br />
8.0<br />
7.5<br />
7.0<br />
6.5<br />
6.0<br />
5.5<br />
5.0<br />
4.5<br />
4.0<br />
%
<strong>Berger</strong> <strong>Paints</strong> <strong>Initiating</strong> <strong>Coverage</strong><br />
Return ratios to remain at healthy levels…<br />
<strong>Berger</strong> <strong>Paints</strong> has lower RoE at 23% <strong>com</strong>pared to Asian <strong>Paints</strong>’ RoE of 45% for FY11 due<br />
to the lower profitability that <strong>Berger</strong> <strong>Paints</strong> operates at, as against Asian <strong>Paints</strong>. Given our<br />
expectations of stable operating margins over the <strong>com</strong>ing quarters, RoE and RoCE of the<br />
<strong>com</strong>pany is also likely to remain more or less flat at 24% and 28% respectively, for FY13E.<br />
Return ratios to remain healthy… RoE <strong>com</strong>pared to peers<br />
%<br />
31<br />
29<br />
27<br />
25<br />
23<br />
21<br />
19<br />
17<br />
15<br />
FY08 FY09 FY10 FY11 FY12E FY13E<br />
RoE RoCE<br />
Source: Company, Emkay Research. * Bloomberg data<br />
FY08 FY09 FY10 FY11 FY12E FY13E<br />
<strong>Berger</strong> <strong>Paints</strong> 28.6 22.3 24.7 23.3 23.1 24.3<br />
Asian <strong>Paints</strong> 49.2 38.1 55.8 44.6 38.2 35.0<br />
Kansai Nerolac* 20.2 15.1 21.4 22.5 21.9 22.4<br />
Akzo Noble* 7.3 11.0 16.2 16.9 14.4 12.7<br />
Emkay Research 27 June 2011 9
Trading at 38% discount to<br />
Asian <strong>Paints</strong>… expect the gap<br />
to narrow<br />
Comparative valuations<br />
<strong>Berger</strong> <strong>Paints</strong> <strong>Initiating</strong> <strong>Coverage</strong><br />
Valuation and Re<strong>com</strong>mendation<br />
Second obvious option… cannot be ignored<br />
<strong>Berger</strong> <strong>Paints</strong> is the second largest player (17% market share) in the decorative paints<br />
market and has recorded healthy revenue run-rate of 18% CAGR over FY05-11. <strong>Berger</strong><br />
<strong>Paints</strong>, with a strong presence in the eastern markets with strategically located plants there,<br />
is increasing its reach in the southern markets through the franchisee stores. Moreover, it<br />
has a strong distribution network of 14,000 dealers with 7,700 tinting machines across<br />
India. With a strong second position in the decorative paints market, we believe <strong>Berger</strong><br />
<strong>Paints</strong> cannot be ignored.<br />
Gaining scale and size…<br />
<strong>Berger</strong> <strong>Paints</strong> is increasing its capacity by 52% over the next two years, which provides<br />
healthy volume growth visibility in the future. Moreover, the inherent growth in the paints<br />
industry coupled with the <strong>com</strong>pany’s aggression to expand its geographical reach will help<br />
<strong>Berger</strong> <strong>Paints</strong> attain reasonable revenue size of Rs 33 bn by FY13E.<br />
…with healthy growth momentum<br />
We forecast 19% revenue CAGR over FY11-13E driven by 15% volume growth and 5%<br />
price-led growth. While high raw material costs continue to keep pressure on profitability<br />
and will lead to a flat operating margin over this period, we expect the <strong>com</strong>pany to post<br />
earnings CAGR of 20% over FY11-13E.<br />
Valuation gap to Asian <strong>Paints</strong> to narrow…<br />
At the current market price, the stock is trading at 19.9x FY12E EPS of Rs 5.0/share and<br />
16.0x FY13E EPS of Rs 6.2/share. At 16.0 x FY13E EPS, it is trading at 38% discount to the<br />
market leader, Asian <strong>Paints</strong>. Historically, the <strong>com</strong>pany has traded at an average discount of<br />
40% to Asian <strong>Paints</strong>’ one-year forward mean PER. We believe that going forward; this<br />
discount should narrow due to the following reasons:<br />
� Gaining considerable size with a revenue CAGR of 19% over FY11-13E<br />
� Product mix shifting towards higher growth and better margin business of water-based<br />
emulsion paints<br />
� Increasing presence across India with rising penetration in the south<br />
…Initiate with ACCUMULATE and target price of Rs 109/share<br />
We have valued <strong>Berger</strong> <strong>Paints</strong> at 17.5x FY13E earnings, a 30% discount to Asian <strong>Paints</strong><br />
target PER multiple of 25x. This gives us a fair price of Rs 109/share, which provides 9.5%<br />
upside from the current levels . Hence, we initiate coverage on the stock with an<br />
ACCUMULATE rating and a target price of Rs 109/share.<br />
CMP Mcap Sales (Rs bn) PAT (Rs bn) EPS CAGR (%) PER (x) EV/EBITDA (x) RoE (%)<br />
Rs Rs bn FY13E FY13E FY11-13E FY12E FY13E FY12E FY13E FY12E FY13E<br />
<strong>Berger</strong> <strong>Paints</strong> 100 34.4 33.2 2.2 19.8 19.9 16.0 11.6 9.6 23.1 24.3<br />
Asian <strong>Paints</strong> 2976 285.3 108.2 11.5 14.5 30.1 25.8 18.1 15.6 38.2 35.0<br />
Kansai Nerolac* 858 46.2 29.3 2.5 8.3 21.2 18.5 12.9 11.1 21.9 22.4<br />
Akzo Nobel* 902 33.2 15.2 1.8 11.5 18.9 17.9 16.1 17.3 14.4 12.7<br />
* Source: Bloomberg<br />
Emkay Research 27 June 2011 10
<strong>Berger</strong> <strong>Paints</strong> <strong>Initiating</strong> <strong>Coverage</strong><br />
PER band 1 Year forward PER band<br />
150<br />
120<br />
90<br />
60<br />
30<br />
0<br />
Apr-03<br />
Apr-04<br />
Apr-05<br />
Apr-06<br />
Apr-07<br />
Apr-08<br />
Apr-09<br />
Apr-10<br />
1 year forward PER band Discount to Asian <strong>Paints</strong><br />
35<br />
30<br />
25<br />
20<br />
15<br />
10<br />
5<br />
0<br />
Jun-02<br />
Jun-03<br />
Jun-04<br />
Jun-05<br />
Jun-06<br />
Jun-07<br />
Jun-08<br />
<strong>Berger</strong> <strong>Paints</strong> Asian <strong>Paints</strong><br />
Jun-09<br />
Apr-11<br />
Jun-10<br />
20x<br />
15x<br />
10x<br />
5x<br />
Emkay Research 27 June 2011 11<br />
25<br />
20<br />
15<br />
10<br />
5<br />
0<br />
Apr-03<br />
100%<br />
80%<br />
60%<br />
40%<br />
20%<br />
0%<br />
-20%<br />
Jun-02<br />
Apr-04<br />
Jun-03<br />
Apr-05<br />
Jun-04<br />
Apr-06<br />
Jun-05<br />
Apr-07<br />
Jun-06<br />
Apr-08<br />
Jun-07<br />
PER discount<br />
Apr-09<br />
Jun-08<br />
Apr-10<br />
Jun-09<br />
Apr-11<br />
Jun-10
Per capita consumption of<br />
paints is low at 1.5 kgs/year<br />
<strong>Berger</strong> <strong>Paints</strong> <strong>Initiating</strong> <strong>Coverage</strong><br />
Annexure - I<br />
Industry overview<br />
The Indian <strong>Paints</strong> Industry, estimated at USD 3.8 bn, is growing at 1.8-2x GDP growth since<br />
the last few years. This industry is characterized with many players in the unorganized<br />
sector. However, the organized segment that cons titutes 80% of total paint industry is<br />
concentrated with top 4 players <strong>com</strong>manding more than 90% share of the organized<br />
market. The per capita consumption of paints in India remains very low at 1.5 kgs, against<br />
15-20 kgs in developed countries. This industry is categorized in two segments –<br />
decorative, which contributes 70% and industrial that contributes 30% to the total industry<br />
size.<br />
Decorative paints (70% of total paint industry)<br />
Decorative paints constitute 70% of total paints market of Rs 170 bn and has witnessed a<br />
17% CAGR over FY06-11. The demand for decorative paints is highly co-related to the<br />
GDP growth of the country. While 70% of the decorative demand is from re-painting needs<br />
and is driven by rising purchasing power of the consumer and the economic growth in the<br />
country; emergence of a sizeable middle class and growing urbanization drives the demand<br />
for new painting requirements , which forms 30% of the decorative segment.<br />
Decorative paint demand led by re-painting requirements…<br />
Driven by increasing<br />
middle class, growing<br />
urbanisation and<br />
higher availability of<br />
affordable housing<br />
Source: Industry, Emkay Research<br />
Emkay Research 27 June 2011 12<br />
30%<br />
Industrial paints (30% of total paint industry)<br />
70%<br />
Re-painting Fresh painting<br />
Driven by rising<br />
purchasing power,<br />
increasing re-painting<br />
cycle and higher<br />
economic growth<br />
The industrial paints category, estimated at Rs 50 bn constitutes 30% of the overall paints<br />
industry. This category is further sub-divided into different segments based on the user<br />
industry and constitutes automotive paints, protective paints, powder coatings and coil<br />
paints. Hence, the key demand driver for this category of paints depends on the industrial<br />
activity in its user-industries like automobiles, power, marine, consumer durables, etc.<br />
Demand drivers – Short term pain…. Long term remains strong…<br />
For decorative paints<br />
Demand for decorative paints emanates from new house construction (30%) and repainting<br />
needs (70%). While the demand for re-painting could be linked to the economic<br />
activity, demand for new house construction would depend on the construction activity in<br />
the <strong>com</strong>mercial and residential space. Encouraging economic growth and an improvement<br />
in business environment are likely to drive the demand for <strong>com</strong>mercial space over a long<br />
run. According to a report by Cushman & Wakefield in October 2010, 240mn sq ft of<br />
<strong>com</strong>mercial property and 4.25mn units of residential property will be required to meet<br />
demand over 2010-2014. Similarly, demand for office space will be 55mn sq ft and hotels<br />
will witness a demand for 78mn room nights over the same period. This signifies the robust<br />
growth potential that the paints industry is poised for, over the ensuing years.
<strong>Berger</strong> <strong>Paints</strong> <strong>Initiating</strong> <strong>Coverage</strong><br />
Distribution of demand Estimated demand for 2010-14<br />
Residential property 4.25 mn units<br />
Commercial property 240 mn sq ft<br />
Office space 55 mn sq ft<br />
Hotels 78mn room nights<br />
Source: Cushman & Wakefield<br />
For Industrial paints<br />
Demand for industrial paints is derived from its application in the user-industries like<br />
automotive, consumer durables and the capital goods industries. As automotive segment<br />
constitutes 40% of total industrial paints, operating environment in this segment is a major<br />
demand driver for the industrial paints category. Further, infrastructural development in<br />
sectors like power, ports, roads, oil and gas etc, will be another key driver of volume growth<br />
in industrial paints.<br />
Automotive segment<br />
While rising macro headwinds like increase in interest rates, fuel prices and inflation will<br />
lead to subdued demand in 1HFY11, it is likely to recover from 2HFY11 once the consumer<br />
makes the psychological adjustment for higher fuel prices and interest rates. We expect<br />
growth rates to revert to healthy levels from FY13E. Our auto team estimates a 10% YoY<br />
growth agains t ~30% growth in passenger cars and 9% YoY growth against 36% growth In<br />
M&HCV segment for FY12. In FY13E, the growth rates are expected to recover to 17% and<br />
12% for passenger cars and M&HCV segment, respectively.<br />
Trend in passenger car segment Trend in <strong>com</strong>mercial vehicles segment<br />
3.0<br />
2.5<br />
2.0<br />
1.5<br />
1.0<br />
0.5<br />
FY07 FY08 FY09 FY10 FY11 FY12e FY13e<br />
Source: Company, Emkay Research<br />
Cars (mn units) % YoY<br />
35%<br />
30%<br />
25%<br />
20%<br />
15%<br />
10%<br />
5%<br />
0%<br />
Emkay Research 27 June 2011 13<br />
0.4<br />
0.4<br />
0.3<br />
0.3<br />
0.2<br />
0.2<br />
0.1<br />
0.1<br />
0.0<br />
Consumer durables segment<br />
FY07 FY08 FY09 FY10 FY11 FY12e FY13e<br />
M&HCV Trucks (mn units) % YoY<br />
60%<br />
40%<br />
20%<br />
0%<br />
-20%<br />
-40%<br />
-60%<br />
According to CEAMA, the consumer durable market is currently pegged at around Rs 350<br />
bn and has witnessed a growth of approximately 13% in the last few months. However, with<br />
tightening credit situation, it is likely to witness some short term pressure. Nevertheless,<br />
over a longer period, consumer durables market is poised to grow at healthy double-digit<br />
growth driven by increasing per capita in<strong>com</strong>e and higher discretionary spend in the<br />
country.
Annexure - II<br />
Growth <strong>com</strong>parison<br />
<strong>Berger</strong> <strong>Paints</strong> <strong>Initiating</strong> <strong>Coverage</strong><br />
<strong>Berger</strong> <strong>Paints</strong> Asian <strong>Paints</strong><br />
Growth (%) Volume Revenue EBITDA PAT Volume Revenue EBITDA PAT<br />
FY05 15.3 23.0 16.1 31.1 13.2 15.2 8.1 13.3<br />
FY06 11.4 18.8 27.9 22.1 13.8 18.7 20.3 26.4<br />
FY07 13.0 18.9 13.9 17.7 17.8 21.7 19.5 21.1<br />
FY08 14.0 15.0 16.6 11.1 17.5 21.2 31.7 40.4<br />
FY09 3.2 12.6 (5.4) (3.9) 13.4 24.9 3.4 (3.3)<br />
FY10 14.7 11.7 38.8 35.4 16.4 20.0 75.6 86.5<br />
FY11 19.0 24.5 19.6 23.4 16.8 23.4 13.0 14.1<br />
FY12E 14.6 26.0 20.4 15.6 15.1 25.9 16.7 13.7<br />
FY13E 15.0 15.0 24.0 23.7 15.1 14.8 17.3 17.0<br />
Margins and return ratio <strong>com</strong>parison<br />
Ratios (%)<br />
EBITDA<br />
margin<br />
PAT<br />
margin<br />
<strong>Berger</strong> <strong>Paints</strong> Asian <strong>Paints</strong><br />
RoE RoCE<br />
EBITDA<br />
margin<br />
PAT<br />
margin<br />
RoE RoCE<br />
FY05 9.7 7.0 29.4 29.6 15.1 9.0 31.8 41.0<br />
FY06 10.4 7.2 32.5 35.0 15.3 9.6 37.1 47.8<br />
FY07 10.0 7.1 32.9 32.7 15.0 9.5 39.3 50.8<br />
FY08 10.1 6.9 29.6 29.8 16.3 11.0 45.0 58.9<br />
FY09 8.5 5.9 23.2 26.3 13.5 8.5 36.0 49.1<br />
FY10 10.6 7.1 23.1 29.5 19.8 13.3 51.2 70.8<br />
FY11 10.2 7.1 22.7 31.3 18.1 12.3 43.3 59.7<br />
FY12E 9.7 6.5 23.2 31.8 16.8 11.1 38.0 53.9<br />
FY13E 10.5 7.0 24.3 33.4 17.1 11.3 34.9 49.9<br />
Raw material mix <strong>com</strong>parison<br />
Raw material cost<br />
as a % to sales<br />
Pigments Solvents<br />
<strong>Berger</strong> <strong>Paints</strong> Asian <strong>Paints</strong><br />
Resins and<br />
Oils<br />
Others Pigments Solvents<br />
Resins and<br />
Oils<br />
FY05 11.3 12.9 14.9 13.4 15.8 7.1 7.6 17.8<br />
FY06 10.5 13.6 12.8 13.6 14.7 7.4 7.3 16.6<br />
FY07 11.1 14.9 11.9 15.3 15.8 8.1 8.6 16.2<br />
FY08 9.5 13.4 12.2 16.3 14.7 7.1 8.4 16.5<br />
FY09 10.3 15.2 12.1 14.7 16.2 7.7 8.8 17.0<br />
FY10 11.2 12.1 12.1 13.9 17.0 5.8 7.2 16.1<br />
Note: Standalone financials<br />
Highlights<br />
Emkay Research 27 June 2011 14<br />
Others<br />
� Volumes for <strong>Berger</strong> <strong>Paints</strong> and Asian <strong>Paints</strong> have grown at an average velocity of 1.6x<br />
and 1.9x to GDP, respectively. Only remarkable difference between the growth rates has<br />
been in FY09, when <strong>Berger</strong> <strong>Paints</strong> witnessed a weak volume growth of 3.2% against<br />
13.4% for Asian <strong>Paints</strong>.<br />
� Historically, <strong>Berger</strong> <strong>Paints</strong> has witnessed lower margins than Asian <strong>Paints</strong>. However,<br />
with increasing scale, higher backward integration and shifting product mix towards<br />
premium -end of water based paints; there is a possibility that the margin gap could<br />
narrow in future.<br />
� Similarly, due to <strong>Berger</strong> <strong>Paints</strong>’ lower margin profile, the <strong>com</strong>pany has relatively lower<br />
RoE <strong>com</strong>pared to Asian <strong>Paints</strong>. Nevertheless, we expect it to remain at healthy levels of<br />
24%.
Consolidated Financials<br />
In<strong>com</strong>e Statement Balance Sheet<br />
<strong>Berger</strong> <strong>Paints</strong> <strong>Initiating</strong> <strong>Coverage</strong><br />
Y/E, Mar (Rs. m) FY10 FY11 FY12E FY13E Y/E, Mar (Rs. m) FY10 FY11 FY12E FY13E<br />
Net Sales 18,913 23,281 28,967 33,174 Equity Share Capital 692 692 692 692<br />
Growth (%) 16.5 23.1 24.4 14.5 Reserves 5,273 6,203 7,415 8,925<br />
Expenses 16,922 20,909 26,165 29,718 Networth 5,965 6,895 8,107 9,617<br />
Growth (%) 13.5 23.6 25.1 13.6 Secured Loans 2,673 3,022 3,022 3,022<br />
Raw Materials 11,931 14,686 18,936 21,531 Unsecured Loans 0 0 0 0<br />
% Of Sales 63.1 63.1 65.4 64.9 Loan Funds 2,674 3,022 3,022 3,022<br />
Employee Cost 1,246 1,448 1,641 1,867 Net Deferred Tax 264 263 263 263<br />
% Of Sales 6.6 6.2 5.7 5.6 Minority interest 0 0 0 0<br />
Other Expenditure 3,745 4,775 5,587 6,320 Capital Employed 8,903 10,180 11,393 12,902<br />
% Of Sales 19.8 20.5 19.3 19.1 Gross Block 6,757 7,196 8,046 8,446<br />
Ebidta 1,991 2,373 2,802 3,456 Less: Depreciation 2,462 2,863 3,314 3,812<br />
Growth (%) 49.8 19.1 18.1 23.3 Net Block 4,295 4,333 4,733 4,635<br />
Ebidta% 10.5 10.2 9.7 10.4 Capital Work In Progress 326 826 1,026 1,676<br />
Other In<strong>com</strong>e 238 428 437 448 Goodwill 0 0 0 0<br />
Interest 152 238 297 297 Investments 1,282 526 526 526<br />
Depreciation 358 401 450 498 Current Assets 6,567 9,015 9,994 11,551<br />
PBT 1,720 2,161 2,491 3,109 Inventories 3,299 4,437 4,818 5,519<br />
Tax 516 660 759 956 Debtors 2,423 2,753 3,204 3,664<br />
PAT (Before EO Item) 1,204 1,501 1,733 2,153 Cash & Bank 413 1,265 1,305 1,605<br />
Growth (%) 45.3 24.7 15.5 24.3 Loans & Advances 432 560 668 764<br />
Net Margin% 6.4 6.4 6.0 6.5 Other Current Assets 0 0 0 0<br />
E/O Item 0 0 0 0 Current Liabilities & Prov 3,566 4,520 4,886 5,486<br />
Reported PAT 1,204 1,501 1,733 2,153 Net Current Assets 3,001 4,495 5,108 6,066<br />
Cash Flow Key Ratios<br />
Miscellaneous Expenditure - - - -<br />
Capital Deployed 8,903 10,180 11,393 12,902<br />
Y/E, Mar (Rs. m) FY10 FY11 FY12E FY13E Y/E, Mar FY10 FY11 FY12E FY13E<br />
Pre-Tax Profit 1,720 2,161 2,491 3,109 Profitability %<br />
Depreciation 358 401 450 498 Ebidta Mgn 10.5 10.2 9.7 10.4<br />
Non Cash 236 0 0 0 PAT Mgn 6.4 6.4 6.0 6.5<br />
Chg in Working Cap 35 -642 -573 -657 ROCE 22.6 25.1 25.9 28.0<br />
Tax Paid -502 -660 -759 -956 ROE 24.7 23.3 23.1 24.3<br />
Operating Cash Flow 1,846 1,260 1,610 1,994 Per Share Data<br />
Capex -622 -940 -1,050 -1,050 EPS 3.5 4.3 5.0 6.2<br />
Free Cash Flow 1,224 320 560 944 BVPS 13.4 17.8 21.3 25.6<br />
Investments -1,237 756 0 0 DPS 1.1 1.3 1.5 1.9<br />
Equity Capital 1,255 -579 0 0 Valuations (X)<br />
Loans -1,002 348 0 0 PER 28.6 22.9 19.9 16.0<br />
Dividend -191 -450 -520 -644 P/BV 7.4 5.6 4.7 3.9<br />
Others 0 458 0 0 Ev/Sales 2.0 1.6 1.3 1.1<br />
Net Change in Cash 49 852 40 300 Ev/Ebidta 16.6 13.4 11.6 9.6<br />
Opening Cash Position 364 413 1,265 1,305 Dividend Yield (%) 1.1 1.3 1.5 1.9<br />
Closing Cash Position 413 1,265 1,305 1,605 Turnover (X Days)<br />
Debtor TO Days 44.6 40.6 37.5 37.8<br />
Inventory TO Days 60.2 60.6 58.3 56.9<br />
Gearing Ratio<br />
Net Debt/Equity (X) 0.4 0.3 0.2 0.1<br />
Total Debt/Equity (X) 0.4 0.4 0.4 0.3<br />
Emkay Research 27 June 2011 15
Emkay Rating Distribution<br />
<strong>Berger</strong> <strong>Paints</strong> <strong>Initiating</strong> <strong>Coverage</strong><br />
BUY Expected total return (%) (stock price appreciation and dividend yield) of over 25% within the next 12-18 months.<br />
ACCUMULATE Expected total return (%) (stock price appreciation and dividend yield) of over 10% within the next 12-18 months.<br />
HOLD Expected total return (%) (stock price appreciation and dividend yield) of upto 10% within the next 12-18 months.<br />
REDUCE Expected total return (%) (stock price depreciation) of upto (-)10% within the next 12-18 months.<br />
SELL The stock is believed to under perform the broad market indices or its related universe within the next 12-18 months.<br />
Emkay Global Financial Services Ltd.<br />
Paragon Center, H -13 -16, 1st Floor, Pandurang Budhkar Marg, Worli, Mumbai – 400 013. Tel No. 6612 1212. Fax: 6624 2410<br />
DISCLAIMER: This document is not for public distribution and has been furnished to you solely for your information and may not be reproduced or redistributed to any<br />
other person. The manner of circulation and distribution of this document may be restricted by law or regulation in certain countries, including the United States. Persons<br />
into whose possession this document may <strong>com</strong>e are required to inform themselves of, and to observe, such restrictions. This material is for the personal information of the<br />
authorized recipient, and we are not soliciting any action based upon it. This report is not to be construed as an offer to sell or the solicitation of an offer to buy any security<br />
in any jurisdiction where such an offer or solicitation would be illegal. No person associated with Emkay Global Financial Services Ltd. is obligated to call or initiate contact<br />
with you for the purposes of elaborating or following up on the information contained in this document. The material is based upon information that we consider reliable, but<br />
we do not represent that it is accurate or <strong>com</strong>plete, and it should not be relied upon. Neither Emkay Global Financial Services Lt d., nor any person connected with it,<br />
accepts any liability arising from the use of this document. The recipient of this material should rely on their own investigations and take their own professional advice.<br />
Opinions expressed are our current opinions as of the date appearing on this material only. While we endeavor to update on a reasonable basis the information discussed<br />
in this material, there may be regulatory, <strong>com</strong>pliance, or other reasons that prevent us from doing so. Prospective investors and others are cautioned that any forwardlooking<br />
statements are not predictions and may be subject to change without notice. We and our affiliates, officers, directors, and employees world wide, including persons<br />
involved in the preparation or issuance of this material may; (a) from time to time, have long or short positions in, and buy or sell the securities thereof, of <strong>com</strong>pany (ies)<br />
mentioned herein or (b) be engaged in any other transaction involving such securities and earn brokerage or other <strong>com</strong>pensation or act as a market maker in the financial<br />
instruments of the <strong>com</strong>pany (ies) discussed herein or may perform or seek to perform investment banking services for such <strong>com</strong>pany(ies)or act as advisor or lender /<br />
borrower to such <strong>com</strong>pany(ies) or have other potential conflict of interest with respect to any re<strong>com</strong>mendation and related information and opinions. The same persons may<br />
have acted upon the information contained here. No part of this material may be duplicated in any form and/or redistributed without Emkay Global Financial Services<br />
Ltd.’sprior written consent. No part of this document may be distributed in Canada or used by private customers in the United Kingdom. In so far as this report includes<br />
current or historical information, it is believed to be reliable, although its accuracy and <strong>com</strong>pleteness cannot be guaranteed.<br />
Emkay Research 27 June 2011 www.emkayglobal.<strong>com</strong> 16