Berger Paints Initiating Coverage - Myiris.com
Berger Paints Initiating Coverage - Myiris.com
Berger Paints Initiating Coverage - Myiris.com

You also want an ePaper? Increase the reach of your titles
YUMPU automatically turns print PDFs into web optimized ePapers that Google loves.
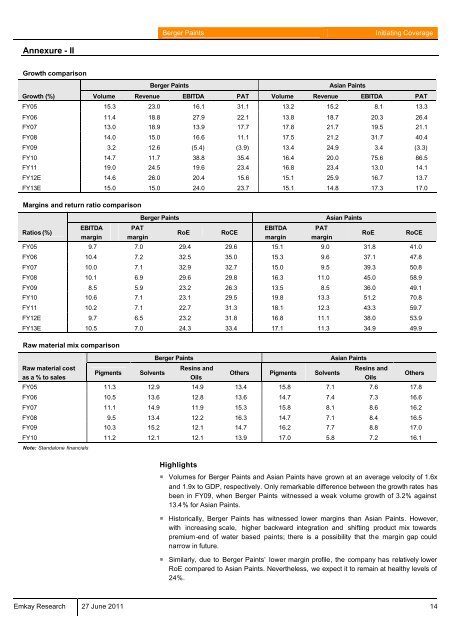
Annexure - II<br />
Growth <strong>com</strong>parison<br />
<strong>Berger</strong> <strong>Paints</strong> <strong>Initiating</strong> <strong>Coverage</strong><br />
<strong>Berger</strong> <strong>Paints</strong> Asian <strong>Paints</strong><br />
Growth (%) Volume Revenue EBITDA PAT Volume Revenue EBITDA PAT<br />
FY05 15.3 23.0 16.1 31.1 13.2 15.2 8.1 13.3<br />
FY06 11.4 18.8 27.9 22.1 13.8 18.7 20.3 26.4<br />
FY07 13.0 18.9 13.9 17.7 17.8 21.7 19.5 21.1<br />
FY08 14.0 15.0 16.6 11.1 17.5 21.2 31.7 40.4<br />
FY09 3.2 12.6 (5.4) (3.9) 13.4 24.9 3.4 (3.3)<br />
FY10 14.7 11.7 38.8 35.4 16.4 20.0 75.6 86.5<br />
FY11 19.0 24.5 19.6 23.4 16.8 23.4 13.0 14.1<br />
FY12E 14.6 26.0 20.4 15.6 15.1 25.9 16.7 13.7<br />
FY13E 15.0 15.0 24.0 23.7 15.1 14.8 17.3 17.0<br />
Margins and return ratio <strong>com</strong>parison<br />
Ratios (%)<br />
EBITDA<br />
margin<br />
PAT<br />
margin<br />
<strong>Berger</strong> <strong>Paints</strong> Asian <strong>Paints</strong><br />
RoE RoCE<br />
EBITDA<br />
margin<br />
PAT<br />
margin<br />
RoE RoCE<br />
FY05 9.7 7.0 29.4 29.6 15.1 9.0 31.8 41.0<br />
FY06 10.4 7.2 32.5 35.0 15.3 9.6 37.1 47.8<br />
FY07 10.0 7.1 32.9 32.7 15.0 9.5 39.3 50.8<br />
FY08 10.1 6.9 29.6 29.8 16.3 11.0 45.0 58.9<br />
FY09 8.5 5.9 23.2 26.3 13.5 8.5 36.0 49.1<br />
FY10 10.6 7.1 23.1 29.5 19.8 13.3 51.2 70.8<br />
FY11 10.2 7.1 22.7 31.3 18.1 12.3 43.3 59.7<br />
FY12E 9.7 6.5 23.2 31.8 16.8 11.1 38.0 53.9<br />
FY13E 10.5 7.0 24.3 33.4 17.1 11.3 34.9 49.9<br />
Raw material mix <strong>com</strong>parison<br />
Raw material cost<br />
as a % to sales<br />
Pigments Solvents<br />
<strong>Berger</strong> <strong>Paints</strong> Asian <strong>Paints</strong><br />
Resins and<br />
Oils<br />
Others Pigments Solvents<br />
Resins and<br />
Oils<br />
FY05 11.3 12.9 14.9 13.4 15.8 7.1 7.6 17.8<br />
FY06 10.5 13.6 12.8 13.6 14.7 7.4 7.3 16.6<br />
FY07 11.1 14.9 11.9 15.3 15.8 8.1 8.6 16.2<br />
FY08 9.5 13.4 12.2 16.3 14.7 7.1 8.4 16.5<br />
FY09 10.3 15.2 12.1 14.7 16.2 7.7 8.8 17.0<br />
FY10 11.2 12.1 12.1 13.9 17.0 5.8 7.2 16.1<br />
Note: Standalone financials<br />
Highlights<br />
Emkay Research 27 June 2011 14<br />
Others<br />
� Volumes for <strong>Berger</strong> <strong>Paints</strong> and Asian <strong>Paints</strong> have grown at an average velocity of 1.6x<br />
and 1.9x to GDP, respectively. Only remarkable difference between the growth rates has<br />
been in FY09, when <strong>Berger</strong> <strong>Paints</strong> witnessed a weak volume growth of 3.2% against<br />
13.4% for Asian <strong>Paints</strong>.<br />
� Historically, <strong>Berger</strong> <strong>Paints</strong> has witnessed lower margins than Asian <strong>Paints</strong>. However,<br />
with increasing scale, higher backward integration and shifting product mix towards<br />
premium -end of water based paints; there is a possibility that the margin gap could<br />
narrow in future.<br />
� Similarly, due to <strong>Berger</strong> <strong>Paints</strong>’ lower margin profile, the <strong>com</strong>pany has relatively lower<br />
RoE <strong>com</strong>pared to Asian <strong>Paints</strong>. Nevertheless, we expect it to remain at healthy levels of<br />
24%.