castrol india ltd - Myiris.com
castrol india ltd - Myiris.com
castrol india ltd - Myiris.com

Create successful ePaper yourself
Turn your PDF publications into a flip-book with our unique Google optimized e-Paper software.
Economy News<br />
� The finance ministry will pencil in fiscal deficit at 5.3% of GDP for this<br />
year, improving to 3% by 2016-17, in its soon-to-be-unveiled fiscal<br />
reforms blueprint, numbers it hopes will stave off a threatened ratings<br />
downgrade and shore up its fiscal credibility. (ET)<br />
� The inter-ministerial panel looking into tele<strong>com</strong> related issue has cleared<br />
the proposal to relax spectrum sharing rules for mobile phone <strong>com</strong>panies.<br />
In its last meeting, EGoM on spectrum headed by finance minister P<br />
Chidambaram decided that telcos will be allowed to share airwaves after<br />
they pay the one-time spectrum charge prospectively for all airwaves<br />
beyond the 4.4 MHz mark. There would also be no spectrum transfer<br />
charge for tele<strong>com</strong> M&As. (ET)<br />
� Both the private and cooperative sugar mills unanimously oppose import<br />
of raw and white sugar during the current crushing season. However,<br />
they differ on the extent of the import duty with the former having<br />
appealed to the Centre to increase import duty from 10% to 25%, the<br />
latter (cooperative) has asked the government not to scrap the 10%<br />
import duty. (BS)<br />
Corporate News<br />
� IndianOil (IOC) is considering expansion of Panipat refinery by 6mt.<br />
Located in Uttar Pradesh, the refinery currently distils 15mt of crude oil.<br />
The plan which is currently under preparation will also explore the<br />
possibilities of expanding petrochemicals capacities at Panipat from 18<br />
mt or 21 mt. (BL)<br />
� The face-off between the government and Reliance Industries Ltd<br />
(RIL) is nearing an end, with the petroleum ministry agreeing to exempt<br />
the <strong>com</strong>pany from a performance audit. Simultaneously, the pending<br />
approvals for RIL's KG-D6 block have also been granted. (BS)<br />
� India Cements has started the paper work on a brownfield expansion to<br />
add over 3mt at two of its cement plants in Tamil Nadu. The brownfield<br />
expansions are at Dalavoi (for 2.55mt), where a 40 MW coal-based<br />
captive power plant is also planned, and at Sankaridurg (for 0.7mt). (BL)<br />
� Cairn India, along with its partners Ravva Oil, ONGC and Videocon<br />
Industries, plans to invest about Rs5.3bn in new wells, which would help<br />
boost production from its Ravva field. Plan is to drill these wells and begin<br />
production by the end of 2013. (BS)<br />
� Bajaj Auto will <strong>com</strong>e out with the most expensive and technologically<br />
advanced bike in the 100 cc segment in January, a top <strong>com</strong>pany official<br />
has said yesterday. (BL)<br />
� LIC Housing Finance is targeting to raise up to Rs 12bn through an<br />
institutional placement offer by December. It has already appointed five<br />
merchant bankers and will be <strong>com</strong>pleting the QIP (qualified institutional<br />
placement) in a month or two. (BL)<br />
� Syndicate Bank has raised $ 500mn (about Rs 26bn) through bonds to<br />
fund its overseas business growth. The bond with maturity period of<br />
5.5yrs carries a coupon rate of 4.125% payable semi-annually in arrear.<br />
(BL)<br />
� The government is likely to revive the ailing state-run tele<strong>com</strong>munications<br />
equipment maker ITI because some of its plants are<br />
located in Congress bastions such as Rae Bareli and Allahabad, a senior<br />
official said. The defence ministry has evinced interest in taking under its<br />
fold the firm. (ET)<br />
Source: ET = Economic Times, BS = Business Standard, FE = Financial Express,<br />
BL = Business Line, ToI: Times of India, BSE = Bombay Stock Exchange<br />
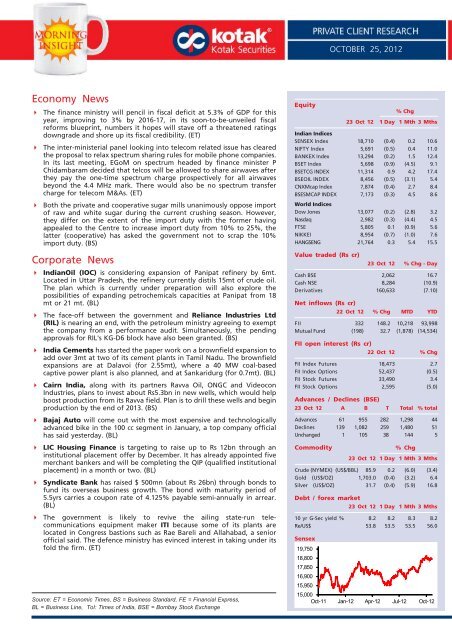
Equity<br />
OCTOBER 25, 2012<br />
% Chg<br />
23 Oct 12 1 Day 1 Mth 3 Mths<br />
Indian Indices<br />
SENSEX Index 18,710 (0.4) 0.2 10.6<br />
NIFTY Index 5,691 (0.5) 0.4 11.0<br />
BANKEX Index 13,294 (0.2) 1.5 12.4<br />
BSET Index 5,698 (0.9) (4.5) 9.1<br />
BSETCG INDEX 11,314 0.9 4.2 17.4<br />
BSEOIL INDEX 8,456 (0.5) (3.1) 5.4<br />
CNXMcap Index 7,874 (0.4) 2.7 8.4<br />
BSESMCAP INDEX<br />
World Indices<br />
7,173 (0.3) 4.5 8.6<br />
Dow Jones 13,077 (0.2) (2.8) 3.2<br />
Nasdaq 2,982 (0.3) (4.4) 4.5<br />
FTSE 5,805 0.1 (0.9) 5.6<br />
NIKKEI 8,954 (0.7) (1.0) 7.6<br />
HANGSENG 21,764 0.3 5.4 15.5<br />
Value traded (Rs cr)<br />
23 Oct 12 % Chg - Day<br />
Cash BSE 2,062 16.7<br />
Cash NSE 8,284 (10.9)<br />
Derivatives 160,633 (7.10)<br />
Net inflows (Rs cr)<br />
22 Oct 12 % Chg MTD YTD<br />
FII 332 148.2 10,218 93,998<br />
Mutual Fund (198) 32.7 (1,878) (14,534)<br />
FII open interest (Rs cr)<br />
22 Oct 12 % Chg<br />
FII Index Futures 18,473 2.7<br />
FII Index Options 52,437 (0.5)<br />
FII Stock Futures 33,490 3.4<br />
FII Stock Options 2,595 (5.0)<br />
Advances / Declines (BSE)<br />
23 Oct 12 A B T Total % total<br />
Advances 61 955 282 1,298 44<br />
Declines 139 1,082 259 1,480 51<br />
Unchanged 1 105 38 144 5<br />
Commodity % Chg<br />
23 Oct 12 1 Day 1 Mth 3 Mths<br />
Crude (NYMEX) (US$/BBL) 85.9 0.2 (6.0) (3.4)<br />
Gold (US$/OZ) 1,703.0 (0.4) (3.2) 6.4<br />
Silver (US$/OZ) 31.7 (0.4) (5.9) 16.8<br />
Debt / forex market<br />
23 Oct 12 1 Day 1 Mth 3 Mths<br />
10 yr G-Sec yield % 8.2 8.2 8.3 8.2<br />
Re/US$ 53.8 53.5 53.5 56.0<br />
Sensex<br />
19,750<br />
18,800<br />
17,850<br />
16,900<br />
15,950<br />
15,000<br />
Oct-11 Jan-12 Apr-12 Jul-12 Oct-12
INITIATING COVERAGE<br />
MORNING INSIGHT October 25, 2012<br />
Arun Agarwal<br />
arun.agarwal@kotak.<strong>com</strong><br />
+91 22 6621 6143<br />
Stock details<br />
BSE code : 500570<br />
NSE code : TATAMOTORS<br />
Market cap (Rs mn) : 844,163<br />
Free float (%) : 35<br />
52 wk Hi/Lo (Rs) : 321/142<br />
Avg daily volume (mn) : 15<br />
Shares (o/s) (mn) : 3,174<br />
Summary table<br />
(Rs mn) FY12 FY13 FY14E<br />
Sales 1,656,545 1,946,462 2,255,291<br />
Growth (%) 36 18 16<br />
EBITDA 223,112 253,463 305,298<br />
EBITDA margin (%) 13.5 13.0 13.5<br />
PBT 135,588 163,611 198,846<br />
Net profit 135,165 120,700 150,563<br />
EPS (Rs) 43 38 48<br />
Growth (%) 46 (11) 25<br />
CEPS (Rs) 60 60 75<br />
Book value (Rs/share) 103 136 179<br />
Dividend per share (Rs) 4 4 4<br />
ROE (%) 52 32 30<br />
ROCE (%) 31 29 29<br />
Net cash (debt) (213,807) (230,548) (213,875)<br />
NW Capital (Days) (27) (25) (26)<br />
P/E (x) 6.2 7.0 5.6<br />
P/BV (x) 2.6 1.9 1.5<br />
EV/Sales (x) 0.6 0.6 0.5<br />
EV/EBITDA (x) 4.7 4.2 3.5<br />
Sales<br />
Q2FY12 Q3FY12 Q4FY12 Q1FY13<br />
361,975 452,603 509,079 433,236<br />
EPS (Rs) 5.9 10.7 19.6 7.0<br />
Source: Company,<br />
Kotak Securities - Private Client Research<br />
TATA MOTORS LTD<br />
PRICE: RS.265 RECOMMENDATION: ACCUMULATE<br />
TARGET PRICE: RS.296 FY14E P/E: 5.6X<br />
With almost 70% sales <strong>com</strong>ing in from JLR, Tata Motors’ success hinges over<br />
the performance of JLR. We expect JLR to continue the growth momentum<br />
over the next few years. Strong demand from developing countries coupled<br />
with new launches should aid JLR's volume growth over the medium term.<br />
We expect JLR's geography mix and product mix to improve going ahead.<br />
On standalone operations, we expect FY13 to be a difficult year but expect<br />
recovery in FY14 and that will be critical for expected strong earnings<br />
growth in FY14. We initiate coverage on Tata Motors (TAMO) with an<br />
ACCUMULATE rating and SOTP based price target of Rs296.<br />
Key investment argument<br />
� JLR's growth momentum to continue; will remain key for TAMO. Global<br />
demand for luxury cars has been on an uptrend for the past couple of years.<br />
Growth has <strong>com</strong>e in from strong demand from both the developed and the<br />
developing markets. Rising in<strong>com</strong>e levels coupled with low penetration levels<br />
have led to strong demand for premium cars in developing economies. China<br />
will likely remain the key market for JLR. Volumes ahead are expected to gain<br />
momentum from the new launches that are planned over the next few quarters.<br />
� Product mix and geography mix expected to improve. JLR sells its products<br />
across geographies with no single market accounting for more than 25% of the<br />
volumes. With strong demand from China and other developing nations and<br />
relatively weak European scenario, we expect JLR's exposure to get further tilted<br />
in favor of growing markets. JLR's FY13 sales are expected to be largely driven<br />
by the success of Evoque. Being a relatively lower margin product, Evoque's<br />
increased share in the overall business will likely deteriorate the <strong>com</strong>pany's<br />
product mix in FY13. However, we expect the trend to change as <strong>com</strong>pany<br />
launches new models/refreshes/variants. We expect contribution from other<br />
models to increase which will strengthen the product portfolio.<br />
� Currently under pressure, domestic sales expected to recover in FY14.<br />
Volumes in the domestic auto segment are under pressure. Current scenario<br />
does not provide a lot of <strong>com</strong>fort in terms of quick volume recovery. However<br />
we remain optimistic about demand recovery over the medium to long term.<br />
Reasons for our positive view over the medium term include possible cut in<br />
interest rates, pent-up demand and expected economic recovery. Interest rate<br />
cycle is at its peak and any attempts from the RBI to lower rates will only be<br />
positive for the domestic auto sector. We expect the volumes from Indian<br />
operations to grow at 13% CAGR over FY12-FY14E.<br />
Valuations<br />
� We value TAMO on SOTP methodology and arrive at a fair value of Rs296. We<br />
have valued the <strong>com</strong>pany's standalone business at an EV/EBITDA of 7.5x which<br />
is similar to the multiple at which Ashok Leyland (M&HCV) and Maruti Suzuki<br />
(Passenger car) trades. Accordingly, we have arrived at a value of Rs82 per<br />
share. For the JLR business, we have valued it at EV/EBITDA of 3.5x to arrive at<br />
a value of Rs194 per share. We have valued TAMO's other subsidiaries at Rs20<br />
per share. We assume coverage on Tata Motors with an ACCUMULATE rating<br />
and price target of Rs296.<br />
Kotak Securities - Private Client Research Please see the disclaimer on the last page For Private Circulation 2
MORNING INSIGHT October 25, 2012<br />
Risk and Concerns<br />
� Lower than expected volume growth at JLR - JLR derives volumes from<br />
various geographies that include US and Europe. Recession in these geographies<br />
will have a negative impact on demand for luxury cars. Lower than expected<br />
volume growth will negatively impact sales and profitability of Tata Motors.<br />
� Delay in recovery in domestic demand - Currently the domestic macro factors<br />
are weak but we are expecting recovery going into FY14. We expect the<br />
volumes for TAMO to de-grow in FY13 but based on expected demand recovery,<br />
we have forecasted volumes to grow by 21% in FY14 on a subdued FY13 base.<br />
Any delay in domestic demand recovery will impact the <strong>com</strong>pany's revenues and<br />
profitability negatively.<br />
� Rise in raw material prices - Raw material cost forms the single largest cost for<br />
the <strong>com</strong>pany. Any steep increase in key raw material like steel, aluminum,<br />
rubber will have negative impact on the operating margins and subsequently on<br />
the net profits of Tata Motors.<br />
� Unfavorable currency movement - TAMO operates across various geographies<br />
and accordingly the <strong>com</strong>pany has exposure to different currencies. Significant<br />
unfavorable movement in related currencies can negatively impact the<br />
<strong>com</strong>pany's margins and profits.<br />
Kotak Securities - Private Client Research Please see the disclaimer on the last page For Private Circulation 3
RESULT UPDATE<br />
MORNING INSIGHT October 25, 2012<br />
Arun Agarwal<br />
arun.agarwal@kotak.<strong>com</strong><br />
+91 22 6621 6143<br />
Summary table<br />
(Rs mn) FY12 FY13E FY14E<br />
Sales 235,790 229,253 253,014<br />
Growth (%) 21.5 (2.8) 10.4<br />
EBITDA 36,188 34,142 37,859<br />
EBITDA margin (%) 15.3 14.9 15.0<br />
PBT 28,647 27,052 30,730<br />
Net profit 23,781 22,751 23,816<br />
EPS (Rs) 119.1 113.9 119.3<br />
Growth (%) 23.4 (4.3) 4.7<br />
CEPS (Rs) 132.7 129.3 136.7<br />
BV (Rs/share) 214.8 237.3 298.1<br />
Dividend / share (Rs) 45.0 50.0 50.0<br />
ROE (%) 65.6 50.4 44.5<br />
ROCE (%) 78.9 59.8 57.3<br />
Net cash (debt) 35,263 44,749 57,583<br />
NW Capital (Days) (14.7) (10.1) (11.3)<br />
P/E (x) 15.1 15.8 15.1<br />
P/BV (x) 8.4 7.6 6.0<br />
EV/Sales (x) 1.4 1.4 1.2<br />
EV/EBITDA (x) 8.9 9.2 8.0<br />
Source: Company, Kotak Securities - Private<br />
Client Research<br />
HERO MOTOCORP (HMC)<br />
PRICE: RS.1798 RECOMMENDATION: REDUCE<br />
TARGET PRICE: RS.1789 FY14E P/E: 15.1X<br />
Hero MotoCorp reported 2QFY13 numbers slightly ahead of our<br />
expectations. Revenues in 2QFY13 stood at Rs51,875, lower by 11% YoY due<br />
to 14% YoY dip in volumes. Decline in volumes impacted operating leverage<br />
leading to 110 bps dip in EBITDA margin. Net profit came in at Rs4,406mn,<br />
27% lower than 2QFY12 net profit of Rs6,036mn. HMC's volumes in 2QFY13<br />
were impacted on account of weak demand and inventory correction. While<br />
the <strong>com</strong>pany has indicated a good start to the festive season, we remain<br />
worried about demand sustainability post festive season as macro factors<br />
continue to remain weak. Further, HMC is also facing the heat of increase in<br />
<strong>com</strong>petition. We continue with our cautious approach on the <strong>com</strong>pany over<br />
the medium term. We maintain our REDUCE rating with a revised price<br />
target of Rs1,789 based on FY14 estimates.<br />
Quarterly performance<br />
(Rsmn) 2QFY13 2QFY12 YoY (%) 1QFY13 QoQ (%)<br />
Revenues 51,875 58,262 (11.0) 62,473 (17.0)<br />
Total expenditure 44,683 49,091 (9.0) 53,104 (15.9)<br />
RM consumed 37,702 42,237 (10.7) 46,026 (18.1)<br />
Employee cost 1,922 1,794 7.1 2,046 (6.1)<br />
Other expenses 5,059 5,060 (0.0) 5,032 0.5<br />
EBITDA 7,192 9,171 (21.6) 9,369 (23.2)<br />
EBITDA margin (%) 13.9 15.7 - 15.0 -<br />
Depreciation 2,895 2,785 4.0 3,035 (4.6)<br />
Interest cost 30 29 1.4 29 0.7<br />
Other In<strong>com</strong>e 993 888 11.9 1,044 (4.9)<br />
PBT 5,261 7,245 (27.4) 7,349 (28.4)<br />
PBT margins (%) 10.1 12.4 11.8<br />
Tax 855 1,208 (29.3) 1,194 (28.4)<br />
Tax rate (%) 16.3 16.7 - 16.3 -<br />
Reported PAT 4,406 6,036 (27.0) 6,155 (28.4)<br />
PAT margins (%) 8.5 10.4 - 9.9 -<br />
Reported EPS (Rs) 22.1 30.2 (27.0) 30.8 (28.4)<br />
Volumes (nos) 1,332,805 1,544,315 (13.7) 1,642,292 (18.8)<br />
Net Realization (Rs) 38,649 37,456 3.2 37,799 2.2<br />
RM cost per vehicle (Rs) 28,288 27,350 3.4 28,025 0.9<br />
Source: Company<br />
Result Highlight<br />
� Revenues during 2QFY13 came in at Rs51,875mn, a decline of 11% over<br />
2QFY12 revenues of Rs58,262mn.Volumes during the same period were down by<br />
14% on account of slowdown and inventory correction.<br />
� Blended realization increased in 2QFY13 by 3.2% YoY and 2.2% QoQ and was<br />
higher than our expectation. Sequential jump in realization came on account of<br />
1.Increased share of 125cc motorcycles 2.Increased share of scooter sales in the<br />
overall mix and 3.Spare parts revenue getting allocated over lower volume base.<br />
� In 1HFY13 gross revenues from spare parts segment stood at ~Rs8bn representing<br />
15% YoY growth.<br />
� Due to lower 2W volumes, share of high margin spare part business increased<br />
during the quarter leading to 100bps improvement in gross margins.<br />
Kotak Securities - Private Client Research Please see the disclaimer on the last page For Private Circulation 4
MORNING INSIGHT October 25, 2012<br />
� Employee cost increased 7% YoY but declined 6% QoQ. Other expenses remained<br />
flat QoQ despite 19% lower volumes.<br />
� Depreciation charge declined 5% QoQ due to lower royalty amortization expense<br />
during the quarter. In 2QFY13 the <strong>com</strong>pany benefitted to the tune of<br />
Rs140mn in royalty amortization over 1QFY13 on account of currency fluctuation.<br />
� HMC reported net profit of Rs4,406mn which was higher than our expectation of<br />
Rs4,087mn. However YoY net profits were down by 27% and QoQ was lower by<br />
28%.<br />
Conference Call Highlights<br />
� HMC expects the domestic 2W industry in FY13 to grow by ~5% and HMC's<br />
volumes to also grow in similar range.<br />
� During the 1st 15 days of October 2012 (Shradh period) the <strong>com</strong>pany was selling<br />
close to ~10,000 units per day which increased to 26,000 units per day during<br />
Navratra period, which is similar to volumes clocked during last year's Navrtra<br />
period.<br />
� Inventory level for the <strong>com</strong>pany is around 6 weeks (4weeks with dealer and<br />
2weeks in transit). In absolute terms the inventory is close to 600,000 units.<br />
� Currently the <strong>com</strong>pany is not offering any discounts. HMC has tied up with<br />
HDFC Bank where the bank is offering loan at 6.99%. Company has stated that<br />
they are not incurring any cost on the scheme.<br />
� HMC took a small price increase of Rs300 across models effective 1st October<br />
2012.<br />
� Company has incurred capex of Rs2.5bn in 1HFY13 and expects to incur Rs3-<br />
3.5bn in 2HFY13.<br />
� Company currently derives 46% of its sales from the rural areas.<br />
Outlook<br />
� Given the current macro factors, 2W demand is expected to remain subdued in<br />
the near term. While volumes could pick up during the festive season, we remain<br />
concerned over demand post festive season.Overall we expect the demand<br />
for 2W's to largely remain under pressure in 2HFY13.<br />
� HMC's domestic volumes in FY13 YTD have de-grown by 3% as against domestic<br />
industry volume growth of 3%. Accordingly the <strong>com</strong>pany's market share has<br />
dropped by 260bps from 45.3% in 1HFY12 to 42.7% in 1HFY13.<br />
� Scooter segment continues to grow at a healthy pace but HMC derives only 7%<br />
of sales from the scooter segment and thereby the positive impact of strong<br />
scooter demand will be limited.<br />
� HMC's market share in the domestic motorcycle segment has slipped from<br />
55.6% in 1HFY12 to 53.5% in 1HFY13 and that is major concern for the<br />
<strong>com</strong>pany.We note that the motorcycle demand growth is largely <strong>com</strong>ing from<br />
>110cc to 125cc segment which is not favorable for HMC.Competition in the<br />
100-125cc segment is on the rise for HMC and we expectthat will continue to<br />
put pressure on the market share, going ahead.<br />
� We expect export volumes for the <strong>com</strong>pany to grow in <strong>com</strong>ing years (on lower<br />
base). However meaningful contribution to the overall volumes will happen over<br />
the longer run as volume ramp-up in different geographies will take some time.<br />
So in the near to medium term, we do not expect any major contribution from<br />
exports flowing to HMC.<br />
� HMC's EBITDA margin has been under pressure over the past few quarters and<br />
we expect the trend to continue over the near to medium term as we do not see<br />
any positive trigger.<br />
Kotak Securities - Private Client Research Please see the disclaimer on the last page For Private Circulation 5
MORNING INSIGHT October 25, 2012<br />
We re<strong>com</strong>mend REDUCE on<br />
Hero MotoCorp with a price<br />
target of Rs.1789<br />
� Further slowdown in domestic volumes, rise in <strong>com</strong>petition and cost related to<br />
scaling of exports will only add to pressure.<br />
� Tax rate in FY14 is expected to increase to 23-25% from expected 16% in FY13<br />
post <strong>com</strong>pletion of 5 year 100% tax holiday at the Haridwar facility. This will to<br />
a certain extent restrict earnings growth in FY14.<br />
� Given weak 2W demand scenario, we are lowering our FY13 estimates. We are<br />
lowering our volume estimates by 5%. Accordingly our revised revenue and<br />
profit estimates stand lower by 6% and 5% respectively over earlier estimates.<br />
Change in estimates (FY13)<br />
(Rsmn) Old New % change<br />
Volumes (mn units) 6.3 6.0 -4.8<br />
Revenues 243,418 229,253 -5.8<br />
EBITDA margin (%) 15.2 14.9<br />
PAT 24,000 22,751 -5.2<br />
Source: Kotak Securities - Private Client Research<br />
� We are introducing FY14 numbers. For FY14, we have assumed 8% volume<br />
growth and stable EBITDA margin.<br />
� We maintain our REDUCE rating on the stock with a revised price target of<br />
Rs1,789 (earlier Rs1,803) based on FY14 estimates. We have valued the stock at<br />
15x expected FY14 EPS of Rs.119.3.<br />
Kotak Securities - Private Client Research Please see the disclaimer on the last page For Private Circulation 6
RESULT UPDATE<br />
MORNING INSIGHT October 25, 2012<br />
Teena Virmani<br />
teena.virmani@kotak.<strong>com</strong><br />
+91 22 6621 6302<br />
Summary table<br />
(Rs mn) FY12 FY13E FY14E<br />
Sales 3,666 5,177 6,490<br />
Growth (%) 74% 41% 25%<br />
EBITDA 2,114 3,111 4,018<br />
EBITDA margin (%) 57.7 60.1 61.9<br />
PBT 1,053 1,547 2,531<br />
Net profit 1,056 1,367 2,199<br />
EPS (Rs) 7.3 9.4 15.2<br />
Growth % 25% 29% 61%<br />
CEPS (Rs) 11.2 14.7 20.5<br />
BV per share (Rs) 118.1 125.2 138.0<br />
DPS (Rs) 2.0 2.0 2.0<br />
ROE (%) 6.2 7.8 11.5<br />
ROCE (%) 6.8 9.1 12.1<br />
Net debt 14,173 12,182 10,208<br />
NW Capital (Days) 133 93 93<br />
EV/Sales (x) 11.4 7.7 5.8<br />
EV/EBITDA (x) 19.8 12.8 9.4<br />
P/E (x) 26.2 20.2 12.6<br />
P/BV (x) 1.6 1.5 1.4<br />
Source: Company, Kotak Securities - Private<br />
Client Research<br />
PHOENIX MILLS LTD<br />
PRICE: RS.191 RECOMMENDATION: BUY<br />
TARGET PRICE: RS.230 FY14E P/E: 12.6X<br />
Result highlights: Revenues of the <strong>com</strong>pany were better than our estimates<br />
led by improvement in rentals. Strong operating margins and higher other<br />
in<strong>com</strong>e boosted net profit growth. Pune, Kurla and Bangalore market cities<br />
are slowly witnessing increased trading densities while Chennai market city<br />
is expected to <strong>com</strong>mence operations by Q3FY13. We maintain BUY on the<br />
stock.<br />
� Phoenix mills had reported a growth of 23.4% in revenues for Q2FY13 primarily<br />
led by improvement in rentals in high street phoenix.<br />
� Operating margins stood strong at 66% for Q2FY13 but adjusted with reclassification<br />
of electricity charges in revenues and expenses, margins stood at 76.7%.<br />
� Net profit growth was boosted by strong operating margins and higher other in<strong>com</strong>e.<br />
� We tweak our estimates to factor in improved rentals as well as reclassification<br />
of expenses related to electricity charges and expect revenues to grow at a<br />
CAGR of 33% between FY12-FY14. We also reduce valuations from Shangri-La<br />
project on account of continued delays seen in getting required clearances. We<br />
arrive at a revised price target of Rs230 on FY14 estimates (Rs 237 earlier) and<br />
continue to maintain BUY on the stock.<br />
Standalone financial highlights<br />
(Rs mn) Q2FY13 Q2FY12 YoY (%)<br />
Net Sales 664.5 538.5 23.4<br />
Total Expenditure 226.2 205.0 10.3<br />
EBITDA 438.3 333.5 31.4<br />
EBITDA % 66.0% 61.9%<br />
Depreciation 68.7 68.9<br />
EBIT 369.6 264.6 39.7<br />
Interest 71.8 30.5<br />
EBT(exc other in<strong>com</strong>e) 297.8 234.1 27.2<br />
Other In<strong>com</strong>e 155.7 88.8<br />
PBT 453.5 322.8<br />
Tax 123.2 83.9<br />
Tax (%) 27.2% 26.0%<br />
PAT 330.3 239.0 38.2<br />
Equity Capital 289.7 289.7<br />
Face Value (In Rs) 2.00 2.00<br />
EPS (Rs) 2.28 1.65 38.2<br />
Source: Company<br />
Revenue growth led by strong rentals<br />
� Phoenix mills has reported a growth of 23.4% in revenues for Q2FY13 primarily<br />
led by improvement in rentals in high street phoenix.<br />
� High Street Phoenix: Average rentals have improved to Rs.185 per sqft per<br />
month during Q2FY13 vsRs 171 in Q2FY12. Average sales per sqft(trading density)<br />
increased from Rs 1627 in Q2FY12 to Rs 1985 in Q2FY13, though footfalls<br />
have <strong>com</strong>e down to 4.2mn during Q2FY13 vs 5 mn in Q22FY12. PML also added<br />
Brands like Royal Selangor (Palladium), Daniel Hechter (Palladium), Mad Over<br />
Donuts (Courtyard), Audelade (Skyzone) and The Coffee Bean & Tea Leaf<br />
(Skyzone) which became operational during Q2FY13. A newly refurbished Big<br />
Bazaar also got re-opened during first week of Aug, 2012.<br />
Kotak Securities - Private Client Research Please see the disclaimer on the last page For Private Circulation 7
MORNING INSIGHT October 25, 2012<br />
� We tweak our estimates for High Street Phoenix to factor in improved rentals as<br />
well as reclassification of expenses related to electricity charges and expect revenues<br />
to grow at a CAGR of 33% between FY12-FY14 on a consolidated basis.<br />
Status of key market cities and hotel Shangri-La<br />
� Pune market city is 85 % leased with average rentals of nearly Rs65 per sqft<br />
per month. Occupancy levels have improved sequentially to 76% during Q2FY13<br />
as against 70% during Q1FY13 with opening of PVR Cinemas in Sep, 2012. Entertainment<br />
zone Blu O is expected to open in Q3FY13. Company has also sold<br />
nearly 85% of phase 1 <strong>com</strong>mercial area of nearly 0.26 mnsqft at Rs 6100 per sq<br />
ft. Footfalls in Pune market city are witnessing an increasing trend and have<br />
moved up to 2.69 mn during Q2FY13 as against 1.71 mn during Q1FY13. Overall<br />
revenues are expected to improve going forward due to improvement in occupancies<br />
as well as rentals. Pune market city reported revenues of Rs 284 mn and<br />
operating margins of 48% during Q2FY13 and has a current debt of Rs 4.56 bn.<br />
� Bangalore market city was opened in Oct, 2011 and is currently 88% leased<br />
with average rentals of nearly Rs 65-70 per sqft per month. No. of opened stores<br />
have now increased to 204 as against 189 in Jun, 2012. Occupancy levels have<br />
also improved to 66% versus 62% during June, 2012. During the quarter, Pure,<br />
Bombay High, Splash, Simba, OOD Life and Amoeba were opened and Copper<br />
Chimney, Noodle Bar and Blu O are expected to open in Q3FY13. Bangalore<br />
market city reported revenues of Rs 289mn and operating margins of 55% during<br />
Q2FY13 and has a current debt of Rs6.1 bn. Footfalls in Bangalore market<br />
city are also witnessing an increasing trend and have moved up to 1.26mn during<br />
Q2FY13 as against 1.11mn during Q1FY13.<br />
� Kurla market city is currently 84% leasedand has an occupancy of 70% (improved<br />
from 59% in Q1FY13) with average rentals of nearly Rs85-90 per sqft per<br />
month. Currently 209 stores have opened as against 189 stores during Jun, 2012.<br />
During the quarter, Zara, Lacoste, Nyasa, Funzone and Freezing Rains @ Snow<br />
World have be<strong>com</strong>e operational. PVR is expected to open from Oct, 2012. Along<br />
with this, Amoeba has partially opened with four Bowling Alleys which would<br />
ramp up to 14 lanes going forward.Kurla market city reported revenues of Rs<br />
288mn and operating margins of 68% during Q2FY13 and has a current debt of<br />
Rs6.67 bn. Footfalls in Bangalore market city are also witnessing an increasing<br />
trend and have moved up to 5.3mn during Q2FY13 as against 4.1mn during<br />
Q1FY13<br />
� Launch of Chennai market city is delayed and is now expected to be launched<br />
by Q3FY13. Key Brands viz. Big Bazaar,Croma, Lifestyle, Pantaloons, Satyam<br />
Cinemas, Man U, OOD life, etc. are undergoing fit-outs. Construction of residential<br />
space above mall structure is progressed up to 8th roof slab and out of total<br />
0.25 mnsqft (105 apartments), <strong>com</strong>pany has already sold nearly 0.2 mnsqft at an<br />
average sale price of Rs 7000 per sq ft. PML would have now have a stake of<br />
50% in Chennai market city. Company would have to pay only Rs 620 mn for increasing<br />
its stake to 50%.<br />
� Phoenix mills has launched Phase 1 of Bangalore(W) residential project -<br />
"One Bangalore West" and has sold nearly 7 lakh sqft across 5 towers (over 275<br />
apartments) at an average sale price of Rs 7200 per sq ft. It has booked sales of<br />
nearly Rs 5.3 bn.Project <strong>com</strong>prises of high-rise towers and one luxury tower. It is<br />
expected to be developed over four and a half years. Excavation work for 3 towers<br />
is nearly <strong>com</strong>plete and is in-progress for remaining two towers. Construction<br />
work of Phase1 is expected to begin during Q3FY13.<br />
� Phase wise handover of Shangri-La has <strong>com</strong>menced but PML had faced environmental<br />
clearance related issues which have delayed the <strong>com</strong>mencement.<br />
PML has already given presentations to <strong>com</strong>mittee reviewing its clearance and<br />
expects hotel to opensoon.<br />
Kotak Securities - Private Client Research Please see the disclaimer on the last page For Private Circulation 8
MORNING INSIGHT October 25, 2012<br />
We re<strong>com</strong>mend BUY on<br />
Phoenix Mills with a price<br />
target of Rs.230<br />
Operating margins stood strong<br />
� Operating margins stood strong at 66% for Q2FY13 on standalone basis but adjusted<br />
with reclassification of electricity charges in revenues and expenses, margins<br />
stood at 76.7%.<br />
� We tweak our estimates and expect operating margins to be 60.1% and 61.9%<br />
for FY13 and FY14 respectively on consolidated basis. Margins on consolidated<br />
basis are expected to improve going forward with improvement in occupancies,<br />
leasing as well as rentals in key market cities.<br />
Net profit growth marginally better than our estimates<br />
� Net profit growth was boosted by strong operating margins and higher other in<strong>com</strong>e.<br />
� Borrowings are likely to <strong>com</strong>e down once operations stabilize in different market<br />
cities.<br />
� We tweak our estimates and expect net profits to grow at a CAGR of 44.3% on<br />
consolidated basis between FY12-14.<br />
Valuation and re<strong>com</strong>mendation<br />
� At current price of Rs191, stock is trading at 20.2x and 12.6x P/E and 12.8x and<br />
9.4x EV/EBITDA.<br />
� We value the <strong>com</strong>pany on sum of the parts valuation and roll forward our valuation<br />
to FY14. We arrive at a target price of Rs 230 on FY14 estimates. (Rs 237<br />
earlier)<br />
� We remain positive on the <strong>com</strong>pany due to its robust business model, excellent<br />
operating cash flows from HSP and expertise to capitalize on the up<strong>com</strong>ing opportunities<br />
in the retail sector in various cities. However, we reduce our valuations<br />
from Shangri-La hotel to take into account delays in <strong>com</strong>mencement of the<br />
project.<br />
� Wemaintain BUY re<strong>com</strong>mendation on the stock.<br />
� Key risks for the stock would be further delays in launch of Shangri-La and lower<br />
than expected ramp up in occupancies in key market cities.<br />
Sum of the parts valuation<br />
Phnx Avg rent Avg Rate Value Per share<br />
Stake (Rs/sqft/m) (Rs/sqft) (Rsmn) (Rs)<br />
High Street Phoenix 100% 180 18632 129<br />
Phase IV @ HSP 100% 12000 3000 21<br />
Market cities<br />
Pune 58.60% 60 6200 1219 8<br />
Kurla 24.30% 95 9000 2411 17<br />
Bangalore(E) 46.6% 65 3000 1021 7<br />
Chennai* 31.00% 80 6500 1611 11<br />
Bangalore(W)-Residential 70% 7200 2086 14<br />
EWDL 40% 45-60 2278 16<br />
Big Apple 70% 35-40 662 5<br />
Shangri-La 53% 12000 446 3<br />
Total 230<br />
CMP 191.00<br />
% UPSIDE 20.6%<br />
* Stake in Chennai market city is likely to be enhanced to 50%; Source: Kotak Securities - Private<br />
Client Research<br />
Kotak Securities - Private Client Research Please see the disclaimer on the last page For Private Circulation 9
RESULT UPDATE<br />
MORNING INSIGHT October 25, 2012<br />
Sumit Pokharna<br />
sumit.pokharna@kotak.<strong>com</strong><br />
+91 22 6621 6313<br />
Summary table<br />
(Rs mn) CY11 CY12E CY13E<br />
Sales 29,818 31,383 33,423<br />
Growth (%) 9.0 5.3 6.5<br />
EBITDA 6,747 6,025 6,681<br />
EBITDA Margin 22.6 19.2 20.0<br />
PBT 7,160 6,393 7,068<br />
Net Profit 4,810 4,309 4,813<br />
EPS (Rs.) 9.4 8.7 9.7<br />
Growth (%) (52.3) -7.2 11.7<br />
CEPS 9.9 9.2 10.3<br />
Book Value (Rs/Share) 24.4 13.3 14.5<br />
DPS (Rs.) 15.0 6.5 7.3<br />
ROE (%) 58.5 52.6 53.4<br />
ROCE (%) 58.6 52.7 53.4<br />
Net Debt / (Cash) (5,490) (5,703) (6,522)<br />
NW Capital (Days) 12.6 11.3 11.5<br />
P/E (X) 34.4 37.1 33.2<br />
P/BV (X) 13.2 24.2 22.2<br />
EV/Sales (X) 2.4 2.3 2.2<br />
EV/EBITDA (X) 11.2 12.6 11.3<br />
Source: Company, Kotak Securities - Private<br />
Client Research<br />
CASTROL INDIA LTD (CIL)<br />
PRICE: RS.323 RECOMMENDATION: REDUCE<br />
TARGET PRICE: RS.302 CY13E P/E: 33.2X<br />
� Castrol India Ltd. has shown lower than expected performance in<br />
Q3CY12. CIL has reported a PAT de-growth of 9.9% YoY to Rs.8.57 Bn<br />
mainly on account of 1). Flat volume growth, 2). Higher total expenditure,<br />
3). Higher depreciation cost and 4). Lower other in<strong>com</strong>e.<br />
� Despite softening of base oil prices, cost of raw material increased significantly<br />
due to continuing rupee depreciation, putting margin under<br />
pressure. The adverse impact of the Rupee depreciation was Rs. 580 Mn,<br />
in Q3CY12.<br />
� Total volumes were flat versus the same quarter last year. Automotive<br />
volumes grew by 3%, faster than the market, enabled by strong marketing<br />
programs targeted towards consumers, trade and influencers. However,<br />
the increase was offset by decline in the industrial and marine volume<br />
which was impacted by the overall industrial slowdown.<br />
Outlook and valuation:<br />
� Our revised earnings estimate with EPS of Rs.8.7 CY12E and Rs.9.7 CY13E and<br />
cash EPS of Rs.9.2 CY12E and Rs.10.3 CY13E<br />
� On the basis of our estimates, the stock at current market price of Rs.323 is expensively<br />
valued at 11.3x EV/EBIDTA, 33.2x P/E and 22.2x P/BV on the basis of<br />
CY13E earnings.<br />
� Based on our DCF valuation model, the 12-month target price of Castrol is<br />
Rs.302. We believe the current price discounts most of the positives and hence<br />
we maintain REDUCE. Castrol's management has also guided that the next few<br />
quarters are likely to be challenging.<br />
Key developments:<br />
� In Q3CY12, Castrol re-launched its leading brand in the motorcycle segment -<br />
Castrol Activ, with new Actibond technology. Supported by a 360 degree campaign,<br />
the brand continues to grow well ahead of the market and has further<br />
strengthened its position as the leading motorcycle engine oil in India.<br />
� Management has guided that the next few quarters are likely to be challenging.<br />
The Indian Rupee remains volatile and crude prices have strengthened recently.<br />
This will continue to put Castrol's margins under pressure. Additionally, the sluggish<br />
economy, and slow automotive and industrial growth will continue to<br />
dampen lubricant demand growth.<br />
� In Q3CY12, automotive segment has shown growth but Industrial and Building &<br />
Construction lubricant segments have been adversely impacted due to reduced<br />
activity in these sectors and delays in a number of important projects. This has<br />
been further <strong>com</strong>pounded by cost cutting and down stocking in these sectors.<br />
� The <strong>com</strong>pany is focusing on driving volume growth through increasing distribution<br />
reach and strengthening advocacy amongst key stakeholders. Wider distribution<br />
network will improve the sales volume of the Company, going forward.<br />
Key risk remains in terms of:<br />
� The Company's management has indicated the lubricant market growth has<br />
been slower due to the economic slowdown and inflationary pressures. This has<br />
been <strong>com</strong>pounded by continuing input cost pressure and rupee depreciation<br />
which have impacted margins.<br />
� Any significant fall in the crude oil price will lower the base-oil price (with a lag<br />
of six months) which can improve its margins.<br />
� Any significant rupee appreciation will impact the raw material cost.<br />
Kotak Securities - Private Client Research Please see the disclaimer on the last page For Private Circulation 10
MORNING INSIGHT October 25, 2012<br />
Quarterly Result Analysis - Q3CY12<br />
(Rs mn) Sep-12 Sep-11 YoY (%) QoQ (%)<br />
No. of months 3 3<br />
Domestic Revenues 8,325 7,738 7.6 (15.4)<br />
Excise Duty 1,130 1,022 10.6 (15.2)<br />
Net Sales/In<strong>com</strong>e from ops 7,195 6,716 7.1 (15.5)<br />
Incr/(Decr) in stock (70) 212 (133.0) 204.3<br />
Total Expenditure 5,928 5,625 5.4 (12.8)<br />
EBIDTA 1,197 1,303 (8.1) (29.3)<br />
Depreciation 66 62 6.5 10.0<br />
EBIT 1,131 1,241 (8.9) (30.8)<br />
Other in<strong>com</strong>e 148 170 (12.9) (8.6)<br />
Interest-net 1.0 9.0 (88.9) (66.7)<br />
PBT 1,278 1,402 (8.8) (28.7)<br />
Extra ordinary Exp/(Inc)<br />
Tax 421 451 (6.7) (27.9)<br />
Current Tax 421 451 (6.7)<br />
PAT 857 951 (9.9) (29.1)<br />
Equity Capital 4,946 4,946 -<br />
Basic EPS 1.73 1.92 (9.9) (29.1)<br />
Source: Company<br />
Profitability Analysis<br />
(%) Sep-12 Sep-11 YoY (%) QoQ (%)<br />
EBITDA Margin 16.6 19.4 (2.8) (3.3)<br />
EBIT Margin 15.7 18.5 (2.8) (3.5)<br />
Adj. PAT Margin 11.9 14.2 (2.2) (2.3)<br />
Other In<strong>com</strong>e/PBT 11.6 12.1 (0.5) 2.5<br />
Tax/PBT 32.9 32.2 0.8 0.4<br />
Excise/net dom sales 13.6 13.2 0.4 0.0<br />
Excise/VoP 15.9 14.8 1.1 0.2<br />
Depreciation/ Avrg. Capital employed (%) 0.96 0.94 0.0 0.1<br />
Source: Company<br />
NOTE: The lubricant business is a seasonal business and volume gets affected due to<br />
various seasonal factors. Hence, quarter-on-quarter result <strong>com</strong>parison will not give<br />
the correct picture. We have observed that for Castrol Quarter 2 (April- June) and<br />
Quarter 4 (Oct-Dec) of the calendar year are generally the best quarters.<br />
Operational Parameters<br />
Sep-12 Sep-11 YoY (%) QoQ (%)<br />
Raw Materials 3,892 3,805 2.3 (14.7)<br />
Staff costs 310 318 (2.5) (8.6)<br />
Purchase of Finished Goods 372 355 4.8 (3.9)<br />
Advertisement Exp. 610 433 40.9 (7.4)<br />
Carriage, Freight & Insurance (CIF) 221 193 14.5 (10.9)<br />
Other Expenses 523 521 0.4 (12.7)<br />
Total 5,928 5,625 5.4 (12.8)<br />
Source: Company<br />
Kotak Securities - Private Client Research Please see the disclaimer on the last page For Private Circulation 11
MORNING INSIGHT October 25, 2012<br />
Cost Ratio Analysis (% of (Net sales + Inventory)<br />
Sep-12 Sep-11 YoY (%) QoQ (%)<br />
RM & Service cost 54.6 54.9 (0.3) 0.9<br />
Staff cost 4.4 4.6 (0.2) 0.4<br />
Purchase of FG 5.2 5.1 0.1 0.7<br />
Advertisement Exp. (Net Sales) 8.5 6.4 2.0 0.7<br />
Carriage, Freight & Insurance 3.1 2.8 0.3 0.2<br />
Other Expenses 7.3 7.5 (0.2) 0.3<br />
Source: Company<br />
Quarterly Result Analysis -<br />
� In Q3CY12, the net revenue has fallen by 15.5% QoQ but up by 7.1% YoY to<br />
Rs. 7.2 Bn mainly on account improved sales mix and pricing actions taken by<br />
the Company.<br />
� Raw material cost: In Q3CY12, raw material cost has decreased by 14.7%<br />
QoQ but was up by 2.3% YoY to Rs.3.89 Bn. Lube oil is a derivative of crude oil<br />
and Brent crude prices has decreased in Q3CY12 however the benefit was partly<br />
offset by weak rupee. Raw material cost to sales ratio has increased by 0.9%<br />
QoQ to 54.6%.<br />
� Trading activity - purchase of finished goods: In Q3CY12, finished goods<br />
purchased by the Company has fallen by 3.9% QoQ but up by 4.8% YoY to<br />
Rs.372 Mn.<br />
� Carriage, Freight & Insurance (CIF): CIF is dependent on imports of raw material.<br />
The Company has increased its volumes and as a result its CIF cost has also<br />
increased. In Q3CY12, carriage, freight & insurance cost has fallen by 10.9%<br />
QoQ but was up by 14.5% YoY to Rs.221 Mn.<br />
� Advertisement Expenses: In Q3CY12, advertisement expense has increased by<br />
40.9% YoY but down by 7.4% QoQ to Rs.610 Mn. In Q2CY12, the Company in<br />
order to promote new products has carried extensive and intensive marketing<br />
campaigns, resulting in higher advertisement expenses.<br />
� Employee Cost: Staff cost has fallen by 8.6% QoQ and 2.5% to Rs.310 Mn<br />
partly due to base effect.<br />
� Other Expenses: In Q3CY12, other expense has fallen by 12.7% QoQ but marginally<br />
up by 0.4% YoY to Rs.523 Mn.<br />
� Operating margin: Overall operating margin fell by 280bps YoY and 330bps<br />
QoQ to 16.6% in Q3CY12. Its margin was down sequentially basis due to rise in<br />
raw material cost to sales ratio. (Lube oil prices).<br />
� Depreciation: In Q3CY12, depreciation cost has increased by 6.5% YoY and<br />
10% QoQ to Rs. 66 Mn. Total capital employed by Castrol has increased by<br />
13.3% QoQ and by 0.7% to Rs. 7.33 Bn.<br />
� Other In<strong>com</strong>e: In Q3CY12, other in<strong>com</strong>e has fallen by 12.9% YoY and by 8.6%<br />
QoQ to Rs.148 Mn.<br />
� Finance/Bank charges has fallen to Rs.1.0 Mn from Rs. 9 Mn on YoY. As on 30th<br />
Sep'12, Castrol is a zero debt <strong>com</strong>pany.<br />
� Castrol's PAT margin has fallen by 220bps YoY and by 230bps to 11.9% in<br />
Q3CY12.<br />
� The Company's profit after tax (PAT) was fallen by 29.1% QoQ and 9.9% YoY<br />
to Rs. 857 Mn mainly on account of 1). Lower sales volume, 2). Lower realization,<br />
and 3). Higher depreciation.<br />
Kotak Securities - Private Client Research Please see the disclaimer on the last page For Private Circulation 12
MORNING INSIGHT October 25, 2012<br />
Operating margin performance<br />
Source: Kotak Securities - Private Client Research<br />
Segment-wise performance<br />
Segment Revenue (Net Sales)<br />
Sep-12 Sep-11 YoY (%) QoQ (%)<br />
Automotive 6,248 5,652 10.5 (16.9)<br />
Non-Automotive/Industrial and<br />
Building & Construction 947 1,064 (11.0) (4.9)<br />
Total 7,195 6,716 7.1 (15.5)<br />
Segment Revenue Contribution (%)<br />
Automotive 86.8 84.2 2.68 (1.5)<br />
Non-Automotive/Industrial and<br />
Building & Construction 13.2 15.8 (2.68) 1.5<br />
Segment EBIT (Adj for exceptional)<br />
Automotive 1,036 1,042 (0.6) (30.9)<br />
Non-Automotive/Industrial and<br />
Building & Construction 149 257 (42.0) (19.9)<br />
Total 1,185 1,299 (8.8) (29.7)<br />
Unallocated Exp/Corporate Exp. 54 58 (6.9) 5.9<br />
% of VoP 0.8% 0.8% (0.0) (0.6)<br />
EBIT Margin (%)<br />
Automotive 16.6 18.4 (1.85) (3.4)<br />
Non-Automotive/Industrial and<br />
Building & Construction 15.7 24.2 (8.42) (2.9)<br />
Segment EBIT Contribution (%)<br />
Automotive 87.4 80.2 7.2 (1.5)<br />
Non-Automotive/Industrial and<br />
Building & Construction 12.6 19.8 (7.2) 1.5<br />
Capital Employed (Rs. Mn)<br />
Automotive 2,046 2,445 (16.3) (3.6)<br />
Non-Automotive/Industrial and<br />
Building & Construction 1,042 1,174 (11.2) 2.1<br />
Unallocable 4,238 3,653 16.0 27.5<br />
Total 7,326 7,272 0.7 13.3<br />
EBIT/CE (%)<br />
Automotive 203 170 18.8 (80.0)<br />
Non-Automotive/Industrial and<br />
Building & Construction 57.2 87.6 -34.7 (15.7)<br />
Total 64.7 71.5 -9.4 (39.5)<br />
Source: Company<br />
Kotak Securities - Private Client Research Please see the disclaimer on the last page For Private Circulation 13
MORNING INSIGHT October 25, 2012<br />
We re<strong>com</strong>mend REDUCE on<br />
Castrol India with a price target<br />
of Rs.302<br />
Automotive Segment - YoY improved performance<br />
In Q3CY12, Castrol India shown net revenue de-growth of 16.9% QoQ but has<br />
shown growth of 10.5% YoY to Rs.6.25 Bn, partly due to base effect. Automotive<br />
segment had contributed ~86.8% of the revenue, up by 2.7% YoY but down by<br />
1.5% QoQ. Further, operating profit was flat YoY basis but down by 30.9% on sequential<br />
basis. EBIDTA margin has fallen by 190bps YoY and by 340bps QoQ to<br />
16.6%, EBIDTA for the quarter stand at Rs.1.04 Bn, down by 30.9% QoQ.<br />
Industrial and Building & Construction Segment<br />
In Q3CY12, Castrol India booked a revenue de-growth of 11% YoY and 4.9% QoQ<br />
to Rs.947 Mn. Industrial segment contributed ~13.2% of the total revenue down by<br />
2.7% YoY but up by 1.5% QoQ. It terms of operating profit, this segment has contributed<br />
12.6% of the total operating profit. EBIDTA margin has fallen by 840bps<br />
YoY and by 290bps QoQ to 15.7%, EBIDTA for the quarter stand at Rs.149 Mn.<br />
Industrial growth led to increase in lubricant consumption in<br />
manufacturing units<br />
Organisation for Economic Co-operation and Development (OECD) <strong>com</strong>posite leading<br />
indicators (CLIs) is pointing slowdown in economy OECD <strong>com</strong>posite leading indicators<br />
(CLIs) is designed to anticipate turning points in economic activity relative to<br />
trend, which point to an increasing pace of economic activity. Based on this, we<br />
believe India is a slowdown phase as the OECD (India) is at 97.5. We believe this<br />
will impact the industrial demand of lubricants in CY12.<br />
OECD Composite leading Indicators<br />
102<br />
101<br />
100<br />
99<br />
98<br />
97<br />
99.0<br />
100<br />
Source: Bloomberg<br />
100, long-term trend<br />
in industrial<br />
production<br />
INDIA CHINA OECD Reference series<br />
Slowdown<br />
Growth cycle phases of the CLI are defined as follows: expansion (increase above<br />
100), downturn (decrease above 100), slowdown (decrease below 100), recovery<br />
(increase below 100). CLI data is of 29 OECD member countries and 6 OECD nonmember<br />
economies.<br />
Comments: The horizontal line 100 shows the long-term trend in industrial production<br />
(the reference series). Expansion denotes a CLI increasing above 100. Downturn<br />
a CLI decreasing but still above 100 Slowdown a CLI decreasing below 100; recovery<br />
a CLI increasing but below 100<br />
Outlook and valuation:<br />
� Our revised earnings estimate with EPS of Rs.8.7 CY12E and Rs.9.7 CY13E and<br />
cash EPS of Rs.9.2 CY12E and Rs.10.3 CY13E<br />
� On the basis of our estimates, the stock at current market price of Rs.323 is expensively<br />
valued at 11.3x EV/EBIDTA, 33.2x P/E and 22.2x P/BV on the basis of<br />
CY13E earnings.<br />
� Based on our DCF valuation model, the 12-month target price of Castrol is<br />
Rs.302. We believe the current price discounts most of the positives and hence<br />
we maintain REDUCE. Castrol's management has also guided that the next few<br />
quarters are likely to be challenging.<br />
Kotak Securities - Private Client Research Please see the disclaimer on the last page For Private Circulation 14
MORNING INSIGHT October 25, 2012<br />
Bulk deals<br />
Trade details of bulk deals<br />
Date Scrip name Name of client Buy/ Quantity Avg.<br />
Sell of shares price<br />
23-Oct Aishwarya Tele G Rama Manohar Reddy S 147,486 12.23<br />
23-Oct Aishwarya Tele Hari Krishna Reddy Kallam B 116,000 12.22<br />
23-Oct Associated Fin Tidal Securities Pvt Ltd B 27,240 37.55<br />
23-Oct Boston Bio Payalben Purvin Patel S 50,000 4.24<br />
23-Oct Boston Bio Yadav Chhatrasinh Cheeranjilal S 44,025 4.43<br />
23-Oct Boston Bio Brijesh Parekh HUF B 50,000 4.22<br />
23-Oct Boston Bio Brijesh Jitendra Parekh B 100,000 4.33<br />
23-Oct Croitre Inds Rakesh Dua S 40,000 31.25<br />
23-Oct Croitre Inds Atul Mittal S 40,000 31.01<br />
23-Oct Croitre Inds Jehil Kalpesh Jhaveri B 40,000 31.25<br />
23-Oct Diamonpower-$ The Royal Bank Of Scotland<br />
Asia Merchant Bank Singapore Lt B 550,000 113.40<br />
23-Oct Diamonpower-$ Abn Amro Bank NV S 550,000 113.40<br />
23-Oct Eastern Sugar Nnp Trading & Investments Pvt Ltd S 85,000 9.35<br />
23-Oct Farry Inds Suresh Indravadan Jain B 24,870 18.75<br />
23-Oct Farry Inds Sheela Ashok Soni S 21,874 18.75<br />
23-Oct Gemstone Invest Ashirwad Investments Pvt Ltd B 400,839 18.00<br />
23-Oct Indergiri Fin Bridgeway Fiduciary Advisors Pvt Ltd S 30,000 9.40<br />
23-Oct Indergiri Fin Pritam Dutt B 61,570 9.40<br />
23-Oct Jaihind Proj Jagdish Amritlal Shah B 77,250 69.35<br />
23-Oct Jaihind Proj Anupam Narain Gupta S 50,475 69.50<br />
23-Oct KGN Inds The Royal Bank Of Scotland<br />
Asia Merchant Bank Singapore Ltd B 1,520,000 18.00<br />
23-Oct KGN Inds Abn Amro Bank NV S 1,520,000 18.00<br />
23-Oct Liberty Phos Grebal Capital Services Pvt Ltd B 72,813 173.05<br />
23-Oct Menon Pistons Savita Satish Gopi S 150,000 95.00<br />
23-Oct Menon Pistons Sachin Ram Menon B 150,000 95.00<br />
23-Oct Panchsheel Org Kishore Abhaychand Turakhia B 149,039 17.75<br />
23-Oct Panchsheel Org Arti Kishore Turakhia S 149,039 17.75<br />
23-Oct Panchsheel Org Paresha Rajesh Turakhia S 87,300 17.75<br />
23-Oct Panchsheel Org Rajesh Abhaychand Turakhia B 86,400 17.75<br />
23-Oct Pasupati Fin Orion Investmart Pvt Ltd B 170,266 28.62<br />
23-Oct Pasupati Fin Charishma Engineering Limited S 94,592 28.65<br />
23-Oct PFL Infotech The Royal Bank Of Scotland<br />
Asia Merchant Bank Singapore Lt B 342,726 26.25<br />
23-Oct PFL Infotech Abn Amro Bank NV S 347,250 26.25<br />
23-Oct Poly Medicure Vision Millenium Exports Pvt Ltd S 106,487 325.22<br />
23-Oct RCL Retail Golden Enterprises B 70,000 9.42<br />
23-Oct Shalibhadra Fin Shah Dhiren Anilbhai B 30,000 54.80<br />
23-Oct Shalibhadra Fin Dave Rakin Shivprasad S 30,000 54.80<br />
23-Oct Shreychem Kishor Valji Gohil S 35,000 74.07<br />
23-Oct Shreychem Vasani Tarunkumar Dalichand B 75,000 73.87<br />
23-Oct Tatia Global Battle Vyapaar Pvt Ltd S 1,347,725 3.50<br />
23-Oct Venus Power Ven Srikrishna Vadlamudi B 94,000 15.99<br />
23-Oct Visagar Fin Ser Chintpurni Distributors Pvt Ltd S 90,000 22.65<br />
23-Oct Visagar Fin Ser Santokhi Merchandise Pvt Ltd S 119,300 22.65<br />
23-Oct Visagar Fin Ser Chamunda Vinimay Pvt Ltd S 85,500 22.65<br />
Source: BSE<br />
Kotak Securities - Private Client Research Please see the disclaimer on the last page For Private Circulation 15<br />
(Rs)
MORNING INSIGHT October 25, 2012<br />
Gainers & Losers Nifty Gainers & Losers<br />
Fundamental Research Team<br />
Dipen Shah<br />
IT, Media<br />
dipen.shah@kotak.<strong>com</strong><br />
+91 22 6621 6301<br />
Sanjeev Zarbade<br />
Capital Goods, Engineering<br />
sanjeev.zarbade@kotak.<strong>com</strong><br />
+91 22 6621 6305<br />
Teena Virmani<br />
Construction, Cement, Mid Cap<br />
teena.virmani@kotak.<strong>com</strong><br />
+91 22 6621 6302<br />
Technical Research Team<br />
Shrikant Chouhan<br />
shrikant.chouhan@kotak.<strong>com</strong><br />
+91 22 6621 6360<br />
Derivatives Research Team<br />
Sahaj Agrawal<br />
sahaj.agrawal@kotak.<strong>com</strong><br />
+91 22 6621 6343<br />
Disclaimer<br />
Gainers<br />
Price (Rs) chg (%) Index points Volume (mn)<br />
L&T 1,701 1.8 5.2 3.0<br />
ICICI Bank 1,079 0.4 1.4 2.3<br />
BPCL 349 1.8 0.5 0.8<br />
Losers<br />
ITC 290 (1.4) (6.9) 3.5<br />
Infosys 2,353 (1.4) (5.0) 0.6<br />
Reliance Ind 810 (0.7) (3.0) 2.2<br />
Source: Bloomberg<br />
Saurabh Agrawal<br />
Metals, Mining<br />
agrawal.saurabh@kotak.<strong>com</strong><br />
+91 22 6621 6309<br />
Saday Sinha<br />
Banking, NBFC, Economy<br />
saday.sinha@kotak.<strong>com</strong><br />
+91 22 6621 6312<br />
Arun Agarwal<br />
Auto & Auto Ancillary<br />
arun.agarwal@kotak.<strong>com</strong><br />
+91 22 6621 6143<br />
Amol Athawale<br />
amol.athawale@kotak.<strong>com</strong><br />
+91 20 6620 3350<br />
Rahul Sharma<br />
sharma.rahul@kotak.<strong>com</strong><br />
+91 22 6621 6198<br />
Ruchir Khare<br />
Capital Goods, Engineering<br />
ruchir.khare@kotak.<strong>com</strong><br />
+91 22 6621 6448<br />
Ritwik Rai<br />
FMCG, Media<br />
ritwik.rai@kotak.<strong>com</strong><br />
+91 22 6621 6310<br />
Sumit Pokharna<br />
Oil and Gas<br />
sumit.pokharna@kotak.<strong>com</strong><br />
+91 22 6621 6313<br />
Premshankar Ladha<br />
premshankar.ladha@kotak.<strong>com</strong><br />
+91 22 6621 6261<br />
Malay Gandhi<br />
malay.gandhi@kotak.<strong>com</strong><br />
+91 22 6621 6350<br />
Amit Agarwal<br />
Logistics, Transportation<br />
agarwal.amit@kotak.<strong>com</strong><br />
+91 22 6621 6222<br />
Jayesh Kumar<br />
Economy<br />
kumar.jayesh@kotak.<strong>com</strong><br />
+91 22 6652 9172<br />
K. Kathirvelu<br />
Production<br />
k.kathirvelu@kotak.<strong>com</strong><br />
+91 22 6621 6311<br />
Prashanth Lalu<br />
prashanth.lalu@kotak.<strong>com</strong><br />
+91 22 6621 6110<br />
This document is not for public distribution and has been furnished to you solely for your information and must not be reproduced or redistributed to any other<br />
person. Persons into whose possession this document may <strong>com</strong>e are required to observe these restrictions.<br />
This material is for the personal information of the authorized recipient, and we are not soliciting any action based upon it. This report is not to be construed<br />
as an offer to sell or the solicitation of an offer to buy any security in any jurisdiction where such an offer or solicitation would be illegal. It is for the<br />
general information of clients of Kotak Securities Ltd. It does not constitute a personal re<strong>com</strong>mendation or take into account the particular investment objectives,<br />
financial situations, or needs of individual clients.<br />
We have reviewed the report, and in so far as it includes current or historical information, it is believed to be reliable though its accuracy or <strong>com</strong>pleteness<br />
cannot be guaranteed. Neither Kotak Securities Limited, nor any person connected with it, accepts any liability arising from the use of this document. The<br />
recipients of this material should rely on their own investigations and take their own professional advice. Price and value of the investments referred to in<br />
this material may go up or down. Past performance is not a guide for future performance. Certain transactions -including those involving futures, options and<br />
other derivatives as well as non-investment grade securities - involve substantial risk and are not suitable for all investors. Reports based on technical<br />
analysis centers on studying charts of a stock’s price movement and trading volume, as opposed to focusing on a <strong>com</strong>pany’s fundamentals and as such, may<br />
not match with a report on a <strong>com</strong>pany’s fundamentals.<br />
Opinions expressed are our current opinions as of the date appearing on this material only. While we endeavor to update on a reasonable basis the information<br />
discussed in this material, there may be regulatory, <strong>com</strong>pliance, or other reasons that prevent us from doing so. Prospective investors and others are cautioned<br />
that any forward-looking statements are not predictions and may be subject to change without notice. Our proprietary trading and investment businesses may<br />
make investment decisions that are inconsistent with the re<strong>com</strong>mendations expressed herein.<br />
Kotak Securities Limited has two independent equity research groups: Institutional Equities and Private Client Group. This report has been prepared by the<br />
Private Client Group . The views and opinions expressed in this document may or may not match or may be contrary with the views, estimates, rating, target<br />
price of the Institutional Equities Research Group of Kotak Securities Limited.<br />
We and our affiliates, officers, directors, and employees world wide may: (a) from time to time, have long or short positions in, and buy or sell the securities<br />
thereof, of <strong>com</strong>pany (ies) mentioned herein or (b) be engaged in any other transaction involving such securities and earn brokerage or other <strong>com</strong>pensation or<br />
act as a market maker in the financial instruments of the <strong>com</strong>pany (ies) discussed herein or act as advisor or lender / borrower to such <strong>com</strong>pany (ies) or have<br />
other potential conflict of interest with respect to any re<strong>com</strong>mendation and related information and opinions.<br />
The analyst for this report certifies that all of the views expressed in this report accurately reflect his or her personal views about the subject <strong>com</strong>pany or<br />
<strong>com</strong>panies and its or their securities, and no part of his or her <strong>com</strong>pensation was, is or will be, directly or indirectly related to specific re<strong>com</strong>mendations or<br />
views expressed in this report.<br />
No part of this material may be duplicated in any form and/or redistributed without Kotak Securities’ prior written consent.<br />
Registered Office: Kotak Securities Limited, Bakhtawar, 1st floor, 229 Nariman Point, Mumbai 400021 India.<br />
Correspondence address: Infinity IT Park, Bldg. No 21, Opp Film City Road, A K Vaidya Marg, Malad (East), Mumbai 400097.<br />
Tel No : 66056825.<br />
Securities and Exchange Board Of India: Registration No's: NSE INB/INF/INE 230808130, BSE INB 010808153/INF 011133230/<br />
INE 011207251, OTC INB 200808136, MCXSX INE 260808130. AMFI No: 0164.<br />
Investment in securities market is subject to market risk, please read the <strong>com</strong>bined risk disclosure document prior to investing.<br />
Kotak Securities - Private Client Research Please see the disclaimer on the last page For Private Circulation 16