PINC POWERPICKS - Myiris.com
PINC POWERPICKS - Myiris.com
PINC POWERPICKS - Myiris.com
You also want an ePaper? Increase the reach of your titles
YUMPU automatically turns print PDFs into web optimized ePapers that Google loves.
RESEARCH<br />
RESEARCH<br />
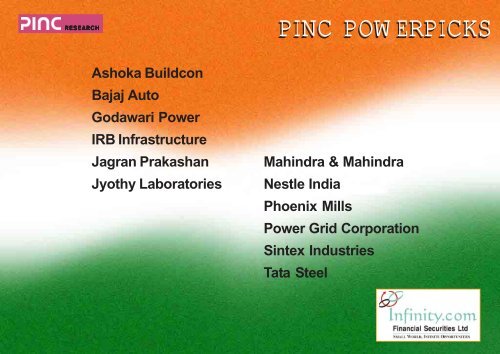
Ashoka Buildcon<br />
Bajaj Auto<br />
Godawari Power<br />
IRB Infrastructure<br />
Jagran Prakashan<br />
Jyothy Laboratories<br />
<strong>PINC</strong> <strong>POWERPICKS</strong><br />
Mahindra & Mahindra<br />
Nestle India<br />
Phoenix Mills<br />
Power Grid Corporation<br />
Sintex Industries<br />
Tata Steel
Top-Shelf Selections<br />
<strong>PINC</strong> <strong>POWERPICKS</strong> AUGUST 2011<br />
RESEARCH<br />
RESEARCH<br />
Here’s the roster for the <strong>PINC</strong> PowerPicks:<br />
Company Sector<br />
CMP<br />
(Rs)<br />
<strong>PINC</strong> <strong>POWERPICKS</strong> is a list of our high-conviction stock ideas, a choice of stocks from across sectors in our coverage universe.<br />
What moved in and what moved out:<br />
Re<strong>com</strong>.<br />
TP<br />
(Rs)<br />
Upside<br />
(%)<br />
Market Cap<br />
(Rs bn)<br />
P/E (x) EV/EBITDA (x) Earnings gr. (%) ROE (%) ROCE (%)<br />
FY12E FY13E FY12E FY13E (FY11-13E) FY12E FY12E<br />
Ashoka Buildcon Infrastructure 268 BUY 365 36 14 12.4 10.4 6.5 5.3 15.9 12.8 12.2<br />
Bajaj Auto Auto 1,457 BUY 1,665 14 422 13.6 11.8 9.6 8.1 16.8 54.5 68.5<br />
Godawari Power Metals 157 BUY 206 31 5 4.5 3.7 4.0 3.3 25.0 17.0 11.0<br />
IRB Infrastructure Infrastructure 165 BUY 227 37 55 11.5 14.4 8.6 8.5 (8.2) 18.1 21.5<br />
Jagran Prakashan Media 110 BUY 148 35 38 14.3 13.4 9.7 8.4 11.8 30.7 37.2<br />
Jyothy Laboratories FMCG 200 BUY 246 23 16 29.0 13.7 19.7 12.1 28.3 11.4 9.7<br />
Mahindra & Mahindra Auto 740 BUY 844 14 435 17.8 15.5 13.3 11.2 5.2 21.8 23.8<br />
Nestle India FMCG 4,147 SELL 3,400 (18) 400 40.9 34.0 27.6 22.9 19.8 81.2 102.7<br />
Phoenix Mills Real Estate 217 BUY 240 11 31 15.2 13.7 12.4 11.2 66.0 11.5 8.2<br />
Power Grid Corp. Power Utilities 104 BUY 122 18 480 16.5 13.8 11.1 9.9 13.6 13.0 9.3<br />
Sintex Industries Diversified 154 BUY 240 56 42 7.6 6.5 6.4 5.7 18.4 20.8 12.3<br />
Tata Steel Metals 476 BUY 629 32 487 11.5 11.5 4.7 5.2 (13.8) 9.9 6.2<br />
In our August issue of <strong>PINC</strong> Power Picks, we have introduced Power Grid Corporation of India Ltd.<br />
We have excluded HCL Tech and NIIT Tech in the August series because we are reviewing our outlook for the IT sector and these stocks are part of the<br />
review. These stocks may resume their position in <strong>PINC</strong> Power Picks on <strong>com</strong>pletion of our review.<br />
16th August 2011<br />
1 <strong>PINC</strong> Research reports are also available on Reuters, Thomson Publishers and Bloomberg PINV
<strong>PINC</strong> <strong>POWERPICKS</strong> RESEARCH<br />
RESEARCH<br />
ASHOKA BUILDCON: BUY, TP-Rs365 (36% upside)<br />
What’s the theme?<br />
Ashoka Buildcon (ABL) with an experience of decade in BOT road projects currently has 23 projects under its<br />
portfolio, with 16 projects operational. ABL is amongst the few BOT developers, who has seen a <strong>com</strong>plete life<br />
cycle of project and has handed over four BOT assets back to the govt. ABL also has a strong in-house EPC<br />
arm, which executes captive as well as third party contracts.<br />
What will move the stock?<br />
1) Post IPO, ABL is aiming for the next league with aggressive but calculated bidding strategy. In FY11<br />
ABL has won projects worth more than Rs30bn. We expect ABL to maintain its market share of 3.5%<br />
for FY12 & FY13 in NHAI bidding.<br />
2) No dilution likely in medium term; ABL would require equity of Rs8bn in next three years, which is likely<br />
to <strong>com</strong>e from internal accrual and securitization of existing projects.<br />
Valuation & Re<strong>com</strong>mendation<br />
We value BOT (DCF basis) at equity multiple of 1.6x and 1.1x FY12E and FY13E. Our SOTP based target<br />
price is Rs365, where BOT is valued at Rs220 and EPC division at Rs145 at 9x FY12E earning. We have<br />
a 'BUY' re<strong>com</strong>mendation on the stock.<br />
What will challenge our target price?<br />
1) Further increase in interest rate, would lower IRR; 2) Lower traffic growth; 3) Slowdown in execution of<br />
current orders; 4) Any change in government policy that may adversely affect tolling charges.<br />
(Rs mn) FY10 FY11 FY12E YoY % FY13E YoY %<br />
Net Sales 7,956 13,020 20,105 54.4 23,250 15.6<br />
EBITDA 2,143 2,496 3,755 50.4 4,651 23.9<br />
EBITDA Marg. (%) 26.9 19.2 18.2 (95)bps 19.5 7 bps<br />
Adj. Net Profits 804 1,008 1,139 12.9 1,353 18.8<br />
Dil. EPS (Rs) 17.6 19.2 21.6 12.9 25.7 18.8<br />
PER (x) 15.2 14.0 12.4 - 10.4 -<br />
ROE (%) 20.6 31.2 12.8 (1837)bps 14.1 129 bps<br />
ROCE (%) 12.5 17.1 12.2 (492)bps 9.9 (232)bps<br />
2<br />
Sector: Infrastructure<br />
CMP: Rs268; Mcap: Rs14bn<br />
Bloomberg: ASBL IN; Reuters: ABDL.BO<br />
Price performance<br />
350<br />
300<br />
250<br />
200<br />
Dec-10 Feb-11 Apr-11 Jun-11 Aug-11<br />
SOTP<br />
ASBL BSE (Rebased)<br />
Particulars Rs/Share Percentage<br />
BOT Operational (SPV) 90 24.6%<br />
BOT Operational (Standalone) 28 7.6%<br />
BOT Under construction 102 27.9%<br />
Construction business 145 39.7%<br />
Total 365<br />
Upside (%) 36<br />
vinod.nair@pinc.co.in +91-22-6618 6379<br />
subramaniam.yadav@pinc.co.in +91-22-6618 6371
<strong>PINC</strong> <strong>POWERPICKS</strong> RESEARCH<br />
RESEARCH<br />
BAJAJ AUTO: BUY, TP-Rs1,665 (14% upside)<br />
What’s the theme?<br />
With the success of Pulsar135 and Discover twins (100cc and 150cc), Bajaj Auto's brand-centric strategy has<br />
been validated. In its attempt to leverage these brands, Bajai Auto recently launched Discover125cc and is all<br />
set to launch Pulsar250cc in Sep'11. The high-margin brands, Pulsar and Discover, now account for 70% of<br />
the <strong>com</strong>pany's motorcycle sales. In addition, continued demand for 3-wheelers and robust exports would help<br />
Bajaj Auto achieve volume growth of 16.2% in FY12 and 11.9% in FY13.<br />
What will move the stock?<br />
1) Despite rising macro headwinds, we expect Bajaj Auto to be less sensitive to such concerns. Given a slew of<br />
product launches in the near future, Bajaj Auto would be able to maintain market share with domestic volume<br />
growth of 16%, in line with industry growth. 2) Export outlook continues to be stable with total exports expected<br />
to touch 1.4mn in FY12. 3) Management expects to improve market share with growth of 22% to 4.8mn units<br />
during FY12 as against our volume estimate of 4.5mn units. 4) Increased proportion of high-margin motorcycles<br />
and continued contribution of three-wheelers would enable the <strong>com</strong>pany to tide over the input cost pressures<br />
and restrict the contraction in margins to 70bps 5) Opening up of new permits for three wheelers in Karnataka<br />
would be a further boost to domestic sales 6) The <strong>com</strong>pany is in the process of reviving the Boxer brand with<br />
a 150cc motorcycle especially targeted at the rural segment wherein Hero MotoCorp is the dominant player.<br />
Where are we stacked versus consensus?<br />
Our FY12 and FY13 earnings estimates are Rs107.5 and Rs123.3 respectively. We have a 'BUY'<br />
re<strong>com</strong>mendation on the stock with a target price of Rs1,665, discounting FY13E earnings at 13.5x. Our<br />
FY12 earnings estimate is 6.1% higher than consensus estimate of Rs101.3.<br />
What will challenge our target price?<br />
1) Significant increase in prices of <strong>com</strong>modities such as steel and rubber are likely to pressurise margins.<br />
2) The <strong>com</strong>pany draws significant benefits from the DEPB scheme and withdrawal of the same would<br />
impact profitability. In case the incentive is entirely withdrawn, our earnings estimate would reduce ~10%.<br />
(Rs mn) FY10 FY11 FY12E YoY % FY13E YoY %<br />
Net Sales 115,085 159,981 192,131 20.1 218,257 13.6<br />
EBITDA 25,752 33,836 39,090 15.5 44,112 12.8<br />
EBITDA Marg. (%) 21.6 20.4 19.7 (70)bps 19.6 (10)bps<br />
Adj. Net Profits 18,118 26,152 31,106 18.9 35,691 14.7<br />
Dil. EPS (Rs) 62.6 90.4 107.5 18.9 123.3 14.7<br />
PER (x) 23.3 16.1 13.6 - 11.8 -<br />
ROE (%) 78.5 66.7 54.5 (1220)bps 48.0 (660)bps<br />
ROCE (%) 65.4 73.4 68.5 (490)bps 61.4 (710)bps<br />
3<br />
Sector: Auto<br />
CMP: Rs1,457; Mcap: Rs422bn<br />
Bloomberg: BJAUT IN; Reuters: BAJA.BO<br />
Price performance<br />
1,800<br />
1,600<br />
1,400<br />
1,200<br />
1,000<br />
Aug-10 Nov -10 Feb-11 May -11 Aug-11<br />
Sales Volume<br />
Units ('000s)<br />
1,200<br />
900<br />
600<br />
300<br />
0<br />
Sep-09<br />
BJAUT BSE BSE AUTO<br />
2-Wheelers 3-Wheelers Sales grow th (RHS)<br />
Dec-09<br />
Mar-10<br />
Jun-10<br />
Sep-10<br />
Dec-10<br />
Mar-11<br />
Jun-11<br />
100<br />
vineet.hetamasaria@pinc.co.in +91-22-6618 6388<br />
nikhil.deshpande@pinc.co.in +91-22-6618 6339<br />
tasmai.merchant@pinc.co.in +91-22-6618 6377<br />
75<br />
50<br />
25<br />
0<br />
(%)
<strong>PINC</strong> <strong>POWERPICKS</strong> RESEARCH<br />
RESEARCH<br />
GODAWARI POWER: BUY, TP-Rs206 (31% upside)<br />
What’s the theme?<br />
We expect GPIL to record 25% earnings CAGR over FY11-FY13E on volume growth and margin expansion.<br />
This would be driven by: higher output from Ari Dongri mines, 0.6mntpa pellet plant, and 20MW biomass<br />
power plant. Further, 0.6 mntpa pellet plant of 75% subsidiary Ardent Steel has also started stabilising with<br />
~40% CU in Q1FY12 and is expected to provide additional earnings growth.<br />
What will move the stock?<br />
1) Stabilisation of the newly <strong>com</strong>missioned 20MW biomass power plant; 2) Higher output from Ari Dongri<br />
iron ore mine and 0.6mntpa pellet plant, helping revenue growth and margin expansion; 3) Stabilisation of<br />
operations at Ardent Steel to provide additional volume and earnings growth; 4) Mining <strong>com</strong>mencing at<br />
the Boria Tibu, impacted by delay in handover of forest area.<br />
Where are we stacked versus consensus?<br />
Our earnings estimates are almost in line with the consensus estimates.<br />
What will challenge our target price?<br />
1) Impediments in ramping up output from the pellet plant (own as well as in sub. Ardent Steel) and 20MW<br />
power plant; 2) Negative impact of foray into 50MW Solar power project. GPIL already invested Rs1.2bn<br />
equity (valued at 10% discount to invested capital) and achieved financial closure for debt of Rs5.8bn for<br />
the project,); 3) Continued delay in acquiring forest land in the Boria Tibu mine, and 4) Simultaneous<br />
decline in steel prices and power tariff.<br />
Consolidated (Rs mn) FY10 FY11 FY12E YoY % FY13E YoY %<br />
Net Sales 8,224 11,161 18,488 65.7 20,063 8.5<br />
EBITDA 1,305 2,323 2,915 25.5 3,361 15.3<br />
EBITDA Marg. (%) 15.9 20.8 15.8 (505)bps 16.8 98 bps<br />
Adj. Net Profits 572 859 1,116 30.0 1,342 20.2<br />
Dil. EPS (Rs) 20.4 27.0 35.2 30.0 42.3 20.2<br />
PER (x) 7.2 5.8 4.5 - 3.7 -<br />
ROE (%) 12.1 15.6 17.0 145 bps 17.4 42 bps<br />
ROCE (%) 9.2 12.4 11.0 (136)bps 11.1 3 bps<br />
4<br />
Sector: Metals<br />
CMP: Rs157; Mcap: Rs5bn<br />
Bloomberg: GODPI IN; Reuters: GDPI.BO<br />
Price performance<br />
330<br />
280<br />
230<br />
180<br />
130<br />
Aug-10 Nov -10 Feb-11 May -11 Aug-11<br />
Volume growth and margin expansion (standalone)<br />
1000<br />
800<br />
600<br />
400<br />
200<br />
0<br />
('000 mt)<br />
Godaw ari Pow er BSE (Rebased)<br />
Sponge Iron Pellets<br />
Billets HB Wire<br />
OPM (%) - RHS<br />
FY09 FY10 FY11 FY12E FY13E<br />
bikash.bhalotia@pinc.co.in +91-22-6618 6387<br />
harleen.babber@pinc.co.in +91-22-6618 6389<br />
dipti.vijaywargi@pinc.co.in +91-22-6618 6393<br />
25<br />
20<br />
15<br />
10<br />
5<br />
-
<strong>PINC</strong> <strong>POWERPICKS</strong> RESEARCH<br />
RESEARCH<br />
IRB INFRASTRUCTURE: BUY, TP-Rs227 (37% upside)<br />
What’s the theme?<br />
Within the Infra segment that has been languishing due to fundamental issues, we prefer IRB due to its<br />
unique ability to manage and win <strong>com</strong>petitive projects. We strongly believe in the sustainability of IRB's<br />
business model. The <strong>com</strong>pany is well positioned to add projects worth $1bn per annum.<br />
What will move the stock?<br />
1) NHAI's is likely to award 7,300km of projects in FY12. With the Ahm-Vado project in its bag, the road<br />
ahead be<strong>com</strong>es easier. We expect IRB to maintain 8% share in the medium term.<br />
2) Recent underperformance due to the Ahm-Vado project provides cushion to stock price; we expect this<br />
project to be a strategic fit for IRB and forecast the project to provide 12% equity IRR and 7% project IRR.<br />
Where are we stacked versus consensus?<br />
Our FY12E and FY13E earnings estimates are at Rs14.3 and Rs11.5, which are 3.2% and 30.3% lower<br />
for FY12 and FY13 consensus estimates respectively. We expect top-line growth of 27.7% at Rs 31.1bn<br />
for FY12E and 18.1% at Rs36.8bn for FY13E vs. consensus estimate of 34.7% at Rs32.8bn and 31.7% at<br />
Rs43.2bn.<br />
We believe the recent correction in stock price provides a good entry point for long-term investors. The<br />
stock offers upside potential of 36.9% at our SOTP-based target price of Rs227 vs. consensus target of<br />
Rs233.<br />
What will challenge our target price?<br />
1) Further increase in interest rate would lower IRR. 2) Infusion of Rs12.8bn equity in Ahm-Vado project<br />
may strain the balance sheet 3) Lower traffic growth would hurt revenue 4) Any change in government<br />
policy would adversely affect IRB's tolling charges.<br />
5<br />
(Rs mn) FY10 FY11 FY12E YoY % FY13E YoY %<br />
Net Sales 17,049 24,381 31,138 27.7 36,780 18.1<br />
EBITDA 7,990 10,939 12,539 14.6 14,213 13.4<br />
EBITDA Marg. (%) 46.9 44.9 40.3 (460)bps 38.6 (163)bps<br />
Adj. Net Profits 3,854 4,524 4,761 5.2 3,808 (20.0)<br />
Dil. EPS (Rs) 11.6 13.6 14.3 5.2 11.5 (20.0)<br />
PER (x) 14.3 12.2 11.5 - 14.4 -<br />
ROE (%) 20.4 20.2 18.1 (217)bps 12.7 (535)bps<br />
ROCE (%) 19.4 23.8 21.5 (227)bps 16.4 (510)bps<br />
Sector: Construction & Infrastructure<br />
CMP: Rs165; Mcap: Rs55bn<br />
Bloomberg: IRB IN; Reuters: IRBI BO<br />
Price performance<br />
370<br />
310<br />
250<br />
190<br />
130<br />
Aug-10 Nov -10 Feb-11 May -11 Aug-11<br />
SOTP<br />
IRB BSE (Rebased)<br />
IRB BSE<br />
Particulars Rs/Share Percentage<br />
BOT 126 55.6%<br />
Construction business 75 33.3%<br />
Real Estate 10 4.4%<br />
Cash in hand 15 6.6%<br />
Total 227<br />
Upside (%) 36.9<br />
vinod.nair@pinc.co.in +91-22-6618 6379<br />
subramaniam.yadav@pinc.co.in +91-22-6618 6371
<strong>PINC</strong> <strong>POWERPICKS</strong> RESEARCH<br />
RESEARCH<br />
JAGRAN PRAKASHAN (JPL): BUY, TP-Rs148 (35% upside)<br />
What’s the theme?<br />
We like JPL for its leadership in the UP market (the largest print market in terms of readership and print ad<br />
value). The <strong>com</strong>pany's well-entrenched position in growing regions such as Bihar and Jharkhand, and its<br />
phased and planned expansion into new media businesses and a wide portfolio (including Mid-day, I-next<br />
and Cityplus) strengthen our belief that it is well poised to benefit from steady growth in the print media<br />
sector. We take <strong>com</strong>fort from JPL’s well-balanced business model as it derives more than 30% revenue<br />
from circulation and other media businesses. Moreover its growth strategy to further increase penetration<br />
in its current market and monetisation of its high readership base insulates it from slowdown in the advertising<br />
market given the current sluggish macroeconomic scenario.<br />
What will move the stock?<br />
1) Momentum in ad revenue underpinned by anticipated growth across sectors such as education and financial<br />
services; 2) Broad-based growth across various other new media businesses; 3) Attractive valuation: At CMP,<br />
the stock is trading attractively at 14xFY13E EPS.<br />
Where are we stacked versus consensus?<br />
Our revenue estimate for FY13 is in line with consensus. However our EPS estimate of Rs8.2 for FY13 is<br />
5% below consensus. We have a 'BUY' re<strong>com</strong>mendation on the stock with a target price of Rs148 (18xFY13E<br />
EPS).<br />
What will challenge our target price?<br />
1) Increase in newsprint prices; 2) Slowdown in the economy; 3) Increased <strong>com</strong>petition in current markets<br />
where JPL has a presence.<br />
6<br />
(Rs mn) FY10 FY11 FY12E YoY % FY13E YoY %<br />
Net Sales 9,419 12,210 13,740 12.5 15,257 11.0<br />
EBITDA 2,821 3,568 3,972 11.3 4,422 11.3<br />
EBITDA Marg. (%) 29.9 29.2 28.9 (31)bps 29.0 7 bps<br />
Adj. Net Profits 1,757 2,080 2,427 16.7 2,598 7.0<br />
Dil. EPS (Rs) 5.8 6.6 7.7 16.8 8.2 7.0<br />
PER (x) 19.0 16.7 14.3 - 13.4 -<br />
ROE (%) 28.7 29.6 30.7 112 bps 29.1 (168)bps<br />
ROCE (%) 33.6 33.1 37.2 403 bps 37.3 14 bps<br />
Sector: Media<br />
CMP: Rs110; Mcap: Rs38bn<br />
Bloomberg: JAGP IN: Reuters: JAGP BO<br />
Price performance<br />
148<br />
136<br />
124<br />
112<br />
100<br />
Aug-10 Nov -10 Feb-11 May -11 Aug-11<br />
Financial Performance<br />
(%)<br />
42<br />
34<br />
26<br />
18<br />
10<br />
Jagran Prakashan BSE (Rebased)<br />
ROE ROCE<br />
FY07 FY08 FY09 FY10 FY11 FY12E FY13E<br />
namrata.sharma@pinc.co.in +91-22-6618 6412<br />
sakshee.chhabra@pinc.co.in +91-22-6618 6633
<strong>PINC</strong> <strong>POWERPICKS</strong> RESEARCH<br />
RESEARCH<br />
JYOTHY LABORATORIES: BUY, TP-Rs246 (23% upside)<br />
What’s the theme?<br />
Jyothy Laboratories (Jyothy) is in the transformation phase following the acquisition of Henkel India. The<br />
strong operational performance of Henkel India in Q2CY11 gives us confidence of a turnaround. We see<br />
various operational synergies following the acquisition and expect numerous positives for Jyothy Labs in<br />
the medium to long term, which would improve overall profitability. Jyothy is among the few <strong>com</strong>panies in<br />
the FMCG space which has immense potential for long-term profitability growth.<br />
What will move the stock?<br />
1) The acquisition of Henkel India added 4-5 established brands that improved Jyothy's sales mix; 2) Full<br />
impact of the price increase of Ujala Supreme will support revenue and profitability growth; 3) Maxo Military<br />
will add Rs600mn and Rs700mn revenue in FY12 and FY13 respectively; 4) We expect improvement in<br />
profitability in Henkel India; 5) Debt restructuring can lead to higher profitability; 6) Merger of Jyothy and<br />
Henkel India will engender massive tax benefits of Rs1.2bn; 7) Restructuring of Jyothy's distribution model<br />
would improve EBITDA margin by 3%.<br />
Where are we stacked versus consensus?<br />
Our estimates for FY13 are among the highest on the street, led by expectation of profitability improvement<br />
in Henkel India. We assign 16x to FY13 earnings and add Rs12/share NPV on tax saving of Rs1.2bn<br />
@12% discount rate to derive the TP of Rs246.<br />
What will challenge our target price?<br />
1) We are cautious on FY12 performance due to restructuring over next 6-9 months; 2) Any delay in operational<br />
improvement in Henkel India will impact the overall profitability; 3) Higher brand building investments; 4) Change<br />
in our estimates for input costs owing to volatility in crude prices and 5) Inability to attract retail clients in the<br />
laundry business.<br />
7<br />
(Rs mn) FY10 FY11 FY12E YoY % FY13E YoY %<br />
Net Sales 5,975 6,230 11,963 92.0 13,872 16.0<br />
EBITDA 929 775 1,110 43.3 1,778 60.1<br />
EBITDA Marg. (%) 15.5 12.4 9.3 (316)bps 12.8 353bps<br />
Adj. Net Profits 742 717 557 (22.3) 1,180 111.9<br />
Dil. EPS (Rs) 9.2 8.9 6.9 (22.3) 14.6 111.9<br />
PER (x) 21.8 22.6 29.0 - 13.7 -<br />
ROE (%) 19.1 11.2 11.4 23bps 20.8 936bps<br />
ROCE (%) 23.2 11.0 9.7 (137)bps 15.4 571bps<br />
Sector: FMCG<br />
CMP: Rs200; Mcap: Rs16bn<br />
Bloomberg: JYL IN; Reuters: JYOI.BO<br />
Price performance<br />
360<br />
310<br />
260<br />
210<br />
Jy othy Lab BSE (Rebased) BSE FMCG (Rebased)<br />
160<br />
Aug-10 Nov -10 Feb-11 May -11 Aug-11<br />
Product Portfolio post acquisition Rs mn<br />
Brands FY11P FY12E FY13E<br />
Ujala Supreme 2,119 2,519 2,884<br />
Techno Bright and Ujala 660 686 810<br />
Henko 1,378 982 1,197<br />
Mr White 550 578 606<br />
Check 400 420 441<br />
Stiff & Shine 255 265 310<br />
Maxo & Maxo Military 1,426 1,606 1,881<br />
EXO 1,140 1,220 1,647<br />
Prill 702 648 749<br />
Margo 756 678 734<br />
Fa 201 179 213<br />
Laundry Business 119 374 460<br />
naveent@pinc.co.in +91-22-6618 6384
<strong>PINC</strong> <strong>POWERPICKS</strong> RESEARCH<br />
RESEARCH<br />
MAHINDRA & MAHINDRA: BUY, TP-Rs844 (14% upside)<br />
What’s the theme?<br />
M&M has been successful in maintaining its dominance in the utility vehicle (UV) segment due to its<br />
extensive product range. This has helped the <strong>com</strong>pany maintain profitability at a healthy level despite<br />
increasing raw material costs. A strong rural presence places M&M in an advantageous position with a<br />
forecast of normal monsoon and higher crop prices. Due to this, we expect the tractor segment to grow<br />
11.1% during FY12. Volumes in the automotive segment too are expected to record double-digit growth of<br />
13.2%.<br />
What will move the stock?<br />
1) New product launches in the pickup segment has helped M&M maintain the demand momentum. In the<br />
UV segment, the <strong>com</strong>pany expects to launch a new SUV by the year end. 2) Demand for small <strong>com</strong>mercial<br />
vehicles (SCVs), the fastest-growing <strong>com</strong>mercial vehicles (CV) segment, remains strong and M&M has<br />
been successful in garnering 20% market share in the segment in less than 2 years of launch. 3) M&M is<br />
working on turning around its recent acquisition of Ssangyong, Korea. In CY11, M&M targets revenue of<br />
USD3bn from Ssangyong vs.USD2bn in CY10. Two SUVs from the Ssangyong Motors' portfolio (Rexton<br />
and Korando) would be assembled at M&M's Chakan facility. 4) Through its JV with Navistar, M&M continues<br />
to expand its sales network for <strong>com</strong>mercial vehicles 5) Post separation with the JV partner, the passenger<br />
car segment has been gaining strength every month and new launches in H2FY12 would fortify this.<br />
Where are we stacked versus consensus?<br />
We expect EPS of Rs41.6 and Rs47.9 in FY12 and FY13 respectively. Our FY12 earnings estimate is<br />
7.8% lower than consensus estimate of Rs45.2. We value M&M using SOTP at Rs844, discounting the<br />
standalone business at 13x FY13E earnings.<br />
What will challenge our target price?<br />
1) Imposition of additional taxes on diesel powered vehicles or dual pricing for diesel would adversely<br />
impact demand for M&M's products; 2) Global turbulence may delay turnaround at Ssangyong.<br />
(Rs mn) FY10 FY11 FY12E YoY % FY13E YoY %<br />
Net Sales 180,381 227,575 250,403 10.0 279,739 11.7<br />
EBITDA 29,758 34,581 33,729 (2.5) 38,589 14.4<br />
EBITDA Marg. (%) 16.0 14.7 13.1 (160)bps 13.4 30 bps<br />
Adj. Net Profits 20,181 25,443 24,447 (3.9) 28,135 15.1<br />
Dil. EPS (Rs) 36.3 44.1 41.6 (5.7) 47.9 15.1<br />
PER (x) 20.4 16.8 17.8 - 15.5 -<br />
ROE (%) 30.9 28.1 21.8 (620)bps 21.4 (40)bps<br />
ROCE (%) 28.0 28.5 23.8 (470)bps 24.0 20 bps<br />
8<br />
Sector: Auto<br />
CMP: Rs740; Mcap: Rs435bn<br />
Bloomberg: MM IN; Reuters: MAHM.BO<br />
Price performance<br />
900<br />
800<br />
700<br />
600<br />
M&M BSE (Rebased) BSE AUTO (Rebased)<br />
500<br />
Aug-10 Nov -10 Feb-11 May -11 Aug-11<br />
SOTP Valuation<br />
Valuation Per share Value<br />
Method (Rs) Multiple (Rs)<br />
M&M (Standalone) P/E 44.9 13 583<br />
M&M Veh. Mfg. (MVML) EV/EBITDA 8.5 4 34<br />
Tech Mahindra CMP 75.9 0.8 61<br />
Mahindra Holidays CMP 43.0 0.8 34<br />
M&M Financial Services CMP 66.3 0.8 53<br />
Mahindra Lifespace CMP 12.1 0.8 10<br />
M&M (Treasury Stocks) CMP 65.3 0.8 52<br />
Swaraj Engines CMP 3.2 0.8 3<br />
Mahindra Forgings CMP 4.9 0.8 4<br />
Mahindra Ugine Steel CMP 1.4 0.8 1<br />
Mahindra Composites CMP 1.2 0.8 1<br />
Mahindra Navistar P/BV 5.1 1.5 8<br />
SOTP Value (Rs) 844<br />
vineet.hetamasaria@pinc.co.in +91-22-6618 6388<br />
nikhil.deshpande@pinc.co.in +91-22-6618 6339<br />
tasmai.merchant@pinc.co.in +91-22-6618 6377
<strong>PINC</strong> <strong>POWERPICKS</strong> RESEARCH<br />
RESEARCH<br />
NESTLE INDIA: SELL, TP-Rs3,400 (18% downside)<br />
What’s the theme?<br />
The rising <strong>com</strong>petitive scenario in most of Nestle's categories along with high capex for capacity addition would<br />
force the <strong>com</strong>pany to maintain volume market share. Therefore, we expect pressure on pricing power of key<br />
brands. Nestle trades at a ~40% premium to the FMCG sector and we argue that this premium would narrow.<br />
What will move the stock?<br />
1) Intense <strong>com</strong>petition in the noodle segment (consist ~35% of total EBITDA) would impact the pricing<br />
power. We expect decline in EBITDA margin by 31bps and 40bps in CY11 and CY12; 2) Nestle currently<br />
trades at ~40% premium over FMCG sector however considering lower pricing power for key products<br />
and pressure on return ratios we argue that Nestle should trade at a 25% premium (last two-year average).<br />
Where are we stacked versus consensus?<br />
Our estimates and target price are among the lowest on the street, led by pressure on EBITDA margin and<br />
argument of narrowing down the Nestle's P/E premium. We assign P/E of 30x on next 12-months earnings<br />
to derive TP of Rs3,400.<br />
What will challenge our target price?<br />
1) We expect Nestle would focus on retaining the volume market share for Maggi noodles therefore<br />
assumes volume driven growth going forward. This assumption would result in lower profitability for Nestle<br />
and any change in this proposition might change our estimates; 2) We expect ITC, GSK consumer and<br />
HUL to be very aggressive in noodle segment, any delay in such efforts would again help Nestle to earn<br />
better profitability.<br />
9<br />
(Rs mn) CY09 CY10 CY11E YoY % CY12E YoY %<br />
Net Sales 51,395 62,609 76,556 22.3 94,126 23.0<br />
EBITDA 10,448 12,559 15,122 20.4 18,212 20.4<br />
EBITDA Marg. (%) 20.3 20.1 19.8 (31)bps 19.3 (40)bps<br />
Adj. Net Profits 6,575 8,188 9,782 19.5 11,745 20.1<br />
Dil. EPS (Rs) 68.2 84.9 101.4 19.5 121.8 20.1<br />
PER (x) 60.8 48.8 40.9 - 34.0 -<br />
ROE (%) 113.1 95.7 81.2 (1,449)bps 72.4 (886)bps<br />
ROCE (%) 179.7 146.8 102.7 (4,412)bps 96.3 (640)bps<br />
Sector: FMCG<br />
CMP: Rs4,147; Mcap: Rs400bn<br />
Bloomberg: NEST IN; Reuters: NEST.BO<br />
Price performance<br />
4,500<br />
4,000<br />
3,500<br />
3,000<br />
Nestle BSE (Rebased) BSE FMCG (Rebased)<br />
2,500<br />
Aug-10 Nov -10 Feb-11 May -11 Aug-11<br />
Key brands’ sales (Rsmn), growth (%) & market share (%)<br />
100<br />
75<br />
50<br />
25<br />
0<br />
Coffee<br />
Ev ery day<br />
Dairy<br />
Baby /Infant<br />
Foods<br />
Sauces<br />
Milkmaid<br />
Milk (UHT)<br />
Curd<br />
Soup<br />
Chocolates<br />
Noodles<br />
10.0 18.0 26.0 34.0<br />
Source: <strong>PINC</strong> Research, Industry, Company<br />
Note: X Axis –Expected Sales Growth in CY10 (%), Y Axis – Expected Market<br />
Share in CY10 (%), Size of bubble – Expected Revenue in CY10<br />
naveent@pinc.co.in +91-22-6618 6384
<strong>PINC</strong> <strong>POWERPICKS</strong> RESEARCH<br />
RESEARCH<br />
PHOENIX MILLS: BUY, TP-Rs240 (11% upside)<br />
What’s the theme?<br />
PHNX's key project, High Street Phoenix (HSP) is now fully operational and is likely to generate rental<br />
in<strong>com</strong>e of Rs2-2.2bn in FY12E. Q1FY12 saw the launch of Pune Market City (PHNX stake 58.5%). This<br />
will strengthen the rental model of PHNX. Presently PHNX's rental revenue (FY11-Rs1,760mn) <strong>com</strong>es<br />
from HSP and the launch of Pune Market City is likely to further add Rs500mn to top line of PHNX in<br />
FY12E.<br />
What will move the stock?<br />
We see the following near-term triggers for the stock: (i) Commencement of Kurla and Bengaluru Market<br />
City projects by Q3FY12 end. (ii) Commencement of the first phase of Shangri- La Hotel in Q3FY12.<br />
(iii) HSP-Phase IV (at present 0.25 msf) will provide a strong delta to the <strong>com</strong>pany's valuation if it manages<br />
to get hospitality FSI (5x). (v) The <strong>com</strong>pany may further choose to increase stake in the Bengaluru and<br />
Chennai market city projects, which would enhance stock valuation.<br />
Where are we stacked versus consensus?<br />
Our EPS estimates for FY12 and FY13 are Rs14.3 and Rs15.8 respectively. Our FY12 earnings estimate<br />
is 52% is higher than consensus estimate of Rs9.4. We have a 'BUY' re<strong>com</strong>mendation on the stock with a<br />
target price of Rs240, which discounts FY12E Gross NAV by 20%.<br />
What will challenge our target price?<br />
1) Slowdown in execution in Market City projects and extending free rental periods may hamper the holding<br />
<strong>com</strong>pany's profitability; economic slowdown may affect revenue from Market City and HSP.<br />
(Rs mn) FY10 FY11 FY12E YoY % FY13E YoY %<br />
Net Sales 1,230 2,102 5,095 142.4 6,194 21.6<br />
EBITDA 775 1,406 3,106 120.9 3,461 11.4<br />
EBITDA Marg. (%) 63.0 61.5 61.0 (59)bps 55.9 (508)bps<br />
Adj. Net Profits 620 818 2,064 152.4 2,288 10.8<br />
Dil. EPS (Rs) 4.3 5.7 14.3 148.7 15.8 10.8<br />
PER (x) 50.7 37.9 15.2 - 13.7 -<br />
ROE (%) 4.0 7.2 11.5 430 bps 11.4 (3)bps<br />
ROCE (%) 3.2 5.3 8.2 288 bps 8.1 (2)bps<br />
10<br />
Sector: Real Estate<br />
CMP: Rs217; Mcap: Rs31bn<br />
Bloomberg: PHNX IN; Reuters: PHOE.BO<br />
Price performance<br />
300<br />
250<br />
200<br />
150<br />
PHNX Sensex Rebased BSE Realty<br />
100<br />
Aug-10 Nov -10 Feb-11 May -11 Aug-11<br />
PHNX One year forward NAV<br />
Project NAV (Rs)<br />
High Street Phoenix 141<br />
Market City (Kurla, Bengaluru, Chennai, Pune) 94<br />
Other Residential 18<br />
Investment in Treasure World Developers 18<br />
Investment in Galaxy Entertainment 1<br />
Investment in Phoenix construction 0.1<br />
Other investments 27<br />
Shangrila hotel 21<br />
HSP Phase IV 14<br />
Less: Net Debt 36<br />
G. NAV 298<br />
Less: 20% Discount to NAV 60<br />
Net NAV 238<br />
suman.memani@pinc.co.in +91-22-6618 6479<br />
abhishek.kumar@pinc.co.in +91-22-6618 6398
<strong>PINC</strong> <strong>POWERPICKS</strong> RESEARCH<br />
RESEARCH<br />
POWER GRID: BUY, TP-Rs122 (18% upside)<br />
What’s the theme?<br />
With 68% of the XIth Plan targeted capex of Rs550bn already spent over the first four years, PGCIL is the<br />
only <strong>com</strong>pany in the power sector to be on track to meet its capex guidance. This, coupled with increased<br />
capex run-rate should translate into 21% CAGR in its regulated equity base over FY11-15E. In addition,<br />
the <strong>com</strong>pany is insulated from risks of rising fuel cost and SEB defaults (as payments are secured through<br />
a tripartite agreement). We believe the stock offers safe and steady returns <strong>com</strong>pared with its private<br />
sector peers.<br />
What will move the stock?<br />
1) Conversion of the large CWIP into regulatory assets translating into increased earnings for the <strong>com</strong>pany,<br />
2) Increase in capex run-rate to meet its XIIth Plan target of Rs1.2tn (which is more than double its XIth<br />
plan target) 3) Increased capex leading to higher capitalisation and resulting in higher earnings and<br />
4) Turnaround of the tele<strong>com</strong> division.<br />
Where are we stacked versus consensus?<br />
Our PAT estimate for FY12 and FY13 is lower than consensus by 3% and 1% respectively. We value<br />
PGCIL on FCFE basis to arrive at a target price of Rs122 (terminal growth rate 3% and 14% Ke)<br />
What will challenge our target price?<br />
1) Delays in capitalisation of projects under construction.<br />
2) Lower incentives and STOA in<strong>com</strong>e impact earnings estimates.<br />
(Rs mn) FY10 FY11P FY12E YoY % FY13E YoY %<br />
Net Sales 72,233 84,147 100,995 20.0 117,458 16.3<br />
EBITDA 59,652 70,774 85,570 20.9 100,283 17.2<br />
EBITDA Mar (%) 82.6 84.1 84.7 62 bps 85.4 65 bps<br />
Adj. Net Profits 21,372 27,013 29,081 7.7 34,868 19.9<br />
Dil. EPS (Rs) 4.8 5.8 6.3 7.8 7.5 19.9<br />
PER (x) 21.4 17.8 16.5 - 13.8 -<br />
RoE (%) 14.0 14.5 13.0 (145)bps 14.3 126 bps<br />
ROCE (%) 8.8 9.4 9.3 (13)bps 9.7 40 bps<br />
11<br />
Sector: Power Utilities<br />
CMP: Rs104; Mcap: Rs480bn<br />
Bloomberg: PWGR IN; Reuters: PGRD.BO<br />
Price performance<br />
120<br />
110<br />
100<br />
90<br />
80<br />
Aug-10 Nov -10 Feb-11 May -11 Aug-11<br />
Financial Performance<br />
(Rs bn)<br />
280<br />
210<br />
140<br />
70<br />
0<br />
Pow er Grid BSE (Rebased)<br />
Capex Capitalisation Regulated Equity<br />
FY11 FY12E FY13E FY14E FY15E<br />
hitul.gutka@pinc.co.in +91-22-6618 6410<br />
vinod.nair@pinc.co.in +91-22-6618 6379<br />
madhura.joshi@pinc.co.in +91-22-6618 6395
<strong>PINC</strong> <strong>POWERPICKS</strong> RESEARCH<br />
RESEARCH<br />
SINTEX INDUSTRIES: BUY, TP-Rs240 (56% upside)<br />
What’s the theme?<br />
Sintex has a diversified business model marked by low volatility in sales, profit and cash flows. It is a<br />
market leader in the Monolithic and Prefab segment.<br />
What will move the stock?<br />
We like Sintex primarily because of: -<br />
� Its market leadership in the prime Monolithic and Prefab segments which are expected to show CAGR<br />
of 25% and 27% during FY11-FY13E respectively.<br />
� Acquisition of overseas and domestic subsidiaries showing operational improvement.<br />
� Further WC improvement leading to increase in operational cash flow.<br />
Where are we stacked versus consensus?<br />
Our earnings EPS estimates for FY12 and FY13 are Rs20.2 and Rs23.6 respectively. Our FY12 earnings<br />
estimate is 2% higher than consensus estimate of Rs19.9. We have a 'BUY' re<strong>com</strong>mendation on the stock<br />
with a target price of Rs240, which discounts FY12E earnings by 12x.<br />
What will challenge our target price?<br />
� Execution risks in the Monolithic and Prefab segments.<br />
� Fluctuation in raw material prices denting margin.<br />
� Delay in improvement of subsidiaries.<br />
(Rs mn) FY10 FY11 FY12E YoY % FY13E YoY %<br />
Net Sales 32,816 44,751 53,371 19.3 61,880 15.9<br />
EBITDA 5,005 8,154 9,161 12.3 10,426 13.8<br />
EBITDA Marg. (%) 15.3 18.2 17.2 (106)bps 16.8 (32)bps<br />
Adj. Net Profits 3,311 4,583 5,501 20.0 6,430 16.9<br />
Dil. EPS (Rs) 12.1 16.8 20.2 20.0 23.6 16.9<br />
PER (x) 14.9 10.8 9.0 - 7.7 -<br />
ROE (%) 18.1 21.1 20.8 (39)bps 20.0 (78)bps<br />
ROCE (%) 9.2 11.4 12.3 87 bps 12.5 26 bps<br />
12<br />
Sector: Diversified<br />
CMP: Rs154; Mcap: Rs42bn<br />
Bloomberg: SINT IN; Reuters: SNTX.BO<br />
Price performance<br />
260<br />
220<br />
180<br />
140<br />
100<br />
Aug-10 Nov -10 Feb-11 May -11 Aug-11<br />
Revenue<br />
(Rs mn)<br />
80000<br />
60000<br />
40000<br />
20000<br />
0<br />
SINT Sensex Rebased<br />
Consolidated Rev enue Standalone Rev enue<br />
FY09 FY10 FY11 FY12E FY13E<br />
suman.memani@pinc.co.in +91-22-6618 6479<br />
abhishek.kumar@pinc.co.in +91-22-6618 6398
<strong>PINC</strong> <strong>POWERPICKS</strong> RESEARCH<br />
RESEARCH<br />
TATA STEEL: BUY, TP-Rs629 (32% upside)<br />
What’s the theme?<br />
We expect Tata Steel to undergo positive transformation led by : 1) Improving share of the highly profitable<br />
integrated Indian operations (EBITDA/t of USD350+, one of the highest globally) with <strong>com</strong>pletion of 2.9mntpa<br />
brownfield expansion at Jamshedpur in FY12; 2) Transformation steps taken at TSE (reduced headcount,<br />
sale of TCP, downsizing at Scunthorpe) to improve profitability, 3) Improved capital structure: FY11 net<br />
D/E of 1.0x - improved further to 0.76x following post proceeds from the TCP settlement and sale of<br />
investment in Riversdale, Tata Refractories in Q1FY12; and 4) Hedging of high RM cost at TSE on<br />
<strong>com</strong>mencement of mining at Riversdale (2HFY12) and New Millennium (FY13). We find the stock attractively<br />
valued at 4.7x FY12E EV/EBITDA.<br />
What will move the stock?<br />
1) Brownfield expansion of 2.9mntpa at Jamshedpur to increase share of the profitable Indian operations<br />
(FY11 EBITDA/t of USD353 vs. consolidated USD138); 2) Improved capital structure with manageable<br />
financial leverage (FY11 net D/E of 1.0x vs. 1.3x in FY10); 3) Progress in raw material integration at TSE;<br />
4) Commencement of coal mining from Riversdale's Benga project, in which Tata Steel holds 35% stake<br />
with 40% offtake rights; 5) Expected improvement in steel profitability as high raw material prices ease;<br />
Where are we stacked versus consensus?<br />
Our consolidated estimates are lower than the street. We value Tata Steel at Rs629 using SOTP<br />
methodology.<br />
What will challenge our target price?<br />
1) Raw material prices remaining high, squeezing margin for the non-integrated operations of TSE resulting<br />
in losses at the EBITDA level; 2) Delay in brownfield expansion; and 3) Delay in <strong>com</strong>mencing mining at<br />
Riversdale/ New Millennium.<br />
(Rs mn) FY10 FY11 FY12E YoY % FY13E YoY %<br />
Net Sales 1,023,931 1,187,531 1,186,784 (0.1) 1,193,305 0.5<br />
EBITDA 80,427 159,956 138,723 (13.3) 148,525 7.1<br />
EBITDA Marg. (%) 7.9 13.5 11.7 (178) bps 12.4 76 bps<br />
Adj. Net Profits (14,414) 57,743 42,727 (26.0) 42,917 0.4<br />
Dil. EPS (Rs) (15.2) 56.5 41.3 (26.9) 41.5 0.4<br />
PER (x) - 8.4 11.5 - 11.5 -<br />
ROE (%) (5.0) 17.3 9.9 (744) bps 8.9 (101)bps<br />
ROCE (%) - 8.8 6.2 (254) bps 6.5 28 bps<br />
13<br />
Sector: Metals<br />
CMP: Rs476; Mcap: Rs487bn<br />
Bloomberg: TATA IN; Reuters: TISC.BO<br />
Price performance<br />
750<br />
670<br />
590<br />
510<br />
Tata Steel BSE (Rebased)<br />
430<br />
Aug-10 Nov -10 Feb-11 May -11 Aug-11<br />
SOTP Valuation ( Based on FY12E EV/EBITDA multiple)<br />
In Rs mn Target Target Residual Target<br />
EV/EBIDTA EV Equity Price (Rs)<br />
Tata Steel India 6 716,145 743,012 719<br />
Tata Steel Europe<br />
(Corus) 4.5 75,412 (104,434) (101)<br />
Tata Steel Thailand 4.5 2,225 2,225 2<br />
Natsteel 4.5 9,509 9,509 9<br />
Tata Steel consol. 5.8 803,291 650,313 629<br />
bikash.bhalotia@pinc.co.in +91-22-6618 6387<br />
harleen.babber@pinc.co.in +91-22-6618 6389<br />
dipti.vijaywargi@pinc.co.in +91-22-6618 6393
RESEARCH<br />
RESEARCH<br />
EQUITY DESK<br />
T E A M<br />
Sadanand Raje Head - Institutional Sales sadanand.raje@pinc.co.in 91-22-6618 6366<br />
Technical Analyst<br />
RESEARCH<br />
Vineet Hetamasaria, CFA Head of Research, Auto, Cement vineet.hetamasaria@pinc.co.in 91-22-6618 6388<br />
Nikhil Deshpande Auto, Auto Ancillary, Cement nikhil.deshpande@pinc.co.in 91-22-6618 6339<br />
Tasmai Merchant Auto, Auto Ancillary, Cement tasmai.merchant@pinc.co.in 91-22-6618 6377<br />
Vinod Nair Construction, Power, Capital Goods vinod.nair@pinc.co.in 91-22-6618 6379<br />
Ankit Babel Capital Goods, Engineering ankit.b@pinc.co.in 91-22-6618 6551<br />
Hitul Gutka Power hitul.gutka@pinc.co.in 91-22-6618 6410<br />
Subramaniam Yadav Construction subramaniam.yadav@pinc.co.in 91-22-6618 6371<br />
Madhura Joshi Power madhura.joshi@pinc.co.in 91-22-6618 6395<br />
Satish Mishra Fertiliser, Natural Gas satish.mishra@pinc.co.in 91-22-6618 6488<br />
Urvashi Biyani Fertiliser, Natural Gas urvashi.biyani@pinc.co.in 91-22-6618 6334<br />
Naveen Trivedi FMCG naveent@pinc.co.in 91-22-6618 6384<br />
Rohit Kumar Anand IT Services rohit.anand@pinc.co.in 91-22-6618 6372<br />
Namrata Sharma Media namrata.sharma@pinc.co.in 91-22-6618 6412<br />
Sakshee Chhabra Media sakshee.chhabra@pinc.co.in 91-22-6618 6516<br />
Bikash Bhalotia Metals, Mining bikash.bhalotia@pinc.co.in 91-22-6618 6387<br />
Harleen Babber Metals, Mining harleen.babber@pinc.co.in 91-22-6618 6389<br />
Dipti Vijaywargi Metals, Mining dipti.vijaywargi @pinc.co.in 91-22-6618 6393<br />
Sushant Dalmia, CFA Pharma sushant.dalmia@pinc.co.in 91-22-6618 6462<br />
Poonam Sanghavi Pharma poonam.sanghavi@pinc.co.in 91-22-6618 6709<br />
Suman Memani Real Estate, Mid caps suman.memani@pinc.co.in 91-22-6618 6479<br />
Abhishek Kumar Real Estate, Mid caps abhishek.kumar@pinc.co.in 91-22-6618 6398<br />
C Krishnamurthy Technical Analyst krishnamurthy.c@pinc.co.in 91-22-6618 6747<br />
SALES<br />
Rajeev Gupta Equities rajeev.gupta@pinc.co.in 91-22-6618 6486<br />
Ankur Varman Equities ankur.varman@pinc.co.in 91-22-6618 6380<br />
Himanshu Varia Equities himanshu.varia@pinc.co.in 91-22-6618 6342<br />
Shailesh Kadam Derivatives shaileshk@pinc.co.in 91-22-6618 6349<br />
Ganesh Gokhale Derivatives ganeshg@pinc.co.in 91-22-6618 6347<br />
DEALING<br />
Mehul Desai Head - Sales Trading mehul.desai@pinc.co.in 91-22-6618 6303<br />
Naresh Panjnani Co-Head - Sales Trading naresh.panjnani@pinc.co.in 91-22-6618 6333<br />
Amar Margaje amar.margaje@pinc.co.in 91-22-6618 6327<br />
Ashok Savla ashok.savla@pinc.co.in 91-22-6618 6321<br />
Sajjid Lala sajjid.lala@pinc.co.in 91-22-6618 6337<br />
Raju Bhavsar rajub@pinc.co.in 91-22-6618 6322<br />
Kinjal Mehta kinjal.mehta@pinc.co.in 91-22-6618 6333<br />
Chandani Bhatia chandani.bhatia@pinc.co.in 91-22-6618 6324<br />
Hasmukh D. Prajapati hasmukhp@pinc.co.in 91-22-6618 6325<br />
Kamlesh Purohit kamlesh.purohit@pinc.co.in 91-22-6618 6357<br />
SINGAPORE DESK<br />
Amul Shah<br />
DIRECTORS<br />
amul.shah@sg.pinc.co.in 65-6327 0626<br />
Gaurang Gandhi gaurangg@pinc.co.in 91-22-6618 6400<br />
Hemang Gandhi hemangg@pinc.co.in 91-22-6618 6400<br />
Ketan Gandhi ketang@pinc.co.in 91-22-6618 6400<br />
COMPLIANCE<br />
Rakesh Bhatia Head Compliance rakeshb@pinc.co.in 91-22-6618 6400
ight thinking<br />
Infinity.<strong>com</strong><br />
Financial Securities Ltd<br />
SMALL WORLD, INFINITE OPPORTUNITIES<br />
Member : Bombay Stock Exchange & National Stock Exchange of India Ltd. : Sebi Reg No: INB 010989331. Clearing No : 211<br />
1216, Maker Chambers V, Nariman Point, Mumbai - 400 021; Tel.: 91-22-66186633/6400 Fax : 91-22-22049195<br />
Disclaimer: This document has been prepared by the Research Desk of M/s Infinity.<strong>com</strong> Financial Securities Ltd. (<strong>PINC</strong>) and is meant for use of the recipient only and is not for public<br />
circulation. Each recipient of this document should make such investigations as it deems necessary to arrive at an independent evaluation of an investment in the securities of <strong>com</strong>panies<br />
referred to in this document (including the merits and risks involved), and should consult its own advisors to determine the merits and risks of such an investment. The investment discussed<br />
or views expressed may not be suitable for all investors<br />
The information contained herein is obtained and collated from sources believed reliable and <strong>PINC</strong> has not independently verified all the information given in this document. Accordingly,<br />
no representation or warranty, express or implied, is made as to the accuracy, <strong>com</strong>pleteness or fairness of the information and opinions contained in this document.<br />
The Disclosures of Interest Statement incorporated in this document is provided solely to enhance the transparency and should not be treated as endorsement of the views expressed in the<br />
report. The opinion expressed or estimates made are as per the best judgement as applicable at that point of time and <strong>PINC</strong> reserves the right to make modifications and alternations to this<br />
statement as may be required from time to time without any prior approval<br />
<strong>PINC</strong>, its affiliates, their directors, employees and their dependant family members may from time to time, effect or have effected an own account transaction in, or deal as principal or agent<br />
in or for the securities mentioned in this document. They may perform or seek to perform investment banking or other services for, or solicit investment banking or other business from, any<br />
<strong>com</strong>pany referred to in this report. Each of these entities functions as a separate, distinct and independent of each other. The recipient should take this into account before interpreting the<br />
document<br />
This report has been prepared on the basis of information, which is already available in publicly accessible media or developed through analysis of <strong>PINC</strong>. The views expressed are those of<br />
analyst and the <strong>PINC</strong> may or may not subscribe to all the views expressed therein<br />
This document is being supplied to you solely for your information and may not be reproduced, redistributed or passed on, directly or indirectly, to any other person or published, copied, in<br />
whole or in part, for any purpose. Neither this document nor any copy of it may be taken or transmitted into the United State (to U.S.Persons), Canada, or Japan or distributed, directly or<br />
indirectly, in the United States or Canada or distributed or redistributed in Japan or to any resident thereof. The distribution of this document in other jurisdictions may be restricted by law,<br />
and persons into whose possession this document <strong>com</strong>es should inform themselves about, and observe, any such restrictions<br />
Neither <strong>PINC</strong>, not its directors, employees, agents or representatives shall be liable for any damages whether direct or indirect, incidental, special or consequential including lost revenue or<br />
lost profits that may arise from or in connection with the use of the information.<br />
Copyright in this document vests exclusively with <strong>PINC</strong> and this document is not to be reported or circulated or copied or made available to others.<br />
Our reports are also available on Reuters, Thomson Publishers and Bloomberg PINV


