CEMENT PRODUCTS Everest Industries Ltd. - Myiris.com
CEMENT PRODUCTS Everest Industries Ltd. - Myiris.com
CEMENT PRODUCTS Everest Industries Ltd. - Myiris.com

Create successful ePaper yourself
Turn your PDF publications into a flip-book with our unique Google optimized e-Paper software.
BUY<br />
Price<br />
Target<br />
<strong>CEMENT</strong><br />
<strong>PRODUCTS</strong><br />
EARLIER RECO<br />
Rs.219<br />
Rs.284<br />
Date Oct.22, 2012<br />
SHARE HOLDING (%)<br />
Promoters 49.5<br />
FII 0.1<br />
FI 8.9<br />
Body Corporates 7.0<br />
Public & Others 34.5<br />
Reuters Code<br />
Bloomberg Code<br />
BSE Code<br />
NSE Symbol<br />
Market<br />
Capitalization*<br />
Shares<br />
Outstanding*<br />
STOCK DATA<br />
EVRI.BO<br />
EVI.IN<br />
508906<br />
EVERESTIND<br />
Rs.2580 mn<br />
$ 46 mn<br />
15.2 mn<br />
52 Weeks (H/L) Rs. 283 / 156<br />
Avg. Daily<br />
Volume (6m)<br />
17,568 shares<br />
Price Performance (%)<br />
1M 3M 6M<br />
(11) (17) (30)<br />
200 Days EMA: Rs.207<br />
*On fully diluted equity shares<br />
ANALYST<br />
Bharti Gupta | +91 22 4093 5069<br />
bharti.gupta@sushilfinance.<strong>com</strong><br />
SALES<br />
Devang Shah | +91 22 4093 6060/61<br />
devang.shah@sushilfinance.<strong>com</strong><br />
Please refer to important disclosures at the end of the report<br />
Sushil Financial Services Private Limited<br />
Regd. Office : 12, Homji Street, Fort, Mumbai 400 001.<br />
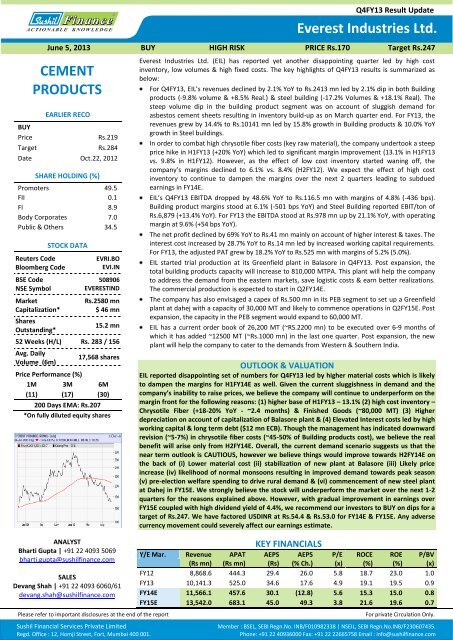
<strong>Everest</strong> <strong>Industries</strong> <strong>Ltd</strong>. (EIL) has reported yet another disappointing quarter led by high cost<br />
inventory, low volumes & high fixed costs. The key highlights of Q4FY13 results is summarized as<br />
below:<br />
For Q4FY13, EIL’s revenues declined by 2.1% YoY to Rs.2413 mn led by 2.1% dip in both Building<br />
products (-9.8% volume & +8.5% Real.) & steel building (-17.2% Volumes & +18.1% Real). The<br />
steep volume dip in the building product segment was on account of sluggish demand for<br />
asbestos cement sheets resulting in inventory build-up as on March quarter end. For FY13, the<br />
revenues grew by 14.4% to Rs.10141 mn led by 15.8% growth in Building products & 10.0% YoY<br />
growth in Steel buildings.<br />
In order to <strong>com</strong>bat high chrysotile fiber costs (key raw material), the <strong>com</strong>pany undertook a steep<br />
price hike in H1FY13 (+20% YoY) which led to significant margin improvement (13.1% in H1FY13<br />
vs. 9.8% in H1FY12). However, as the effect of low cost inventory started waning off, the<br />
<strong>com</strong>pany’s margins declined to 6.1% vs. 8.4% (H2FY12). We expect the effect of high cost<br />
inventory to continue to dampen the margins over the next 2 quarters leading to subdued<br />
earnings in FY14E.<br />
EIL’s Q4FY13 EBITDA dropped by 48.6% YoY to Rs.116.5 mn with margins of 4.8% (-436 bps).<br />
Building product margins stood at 6.1% (-501 bps YoY) and Steel Building reported EBIT/ton of<br />
Rs.6,879 (+13.4% YoY). For FY13 the EBITDA stood at Rs.978 mn up by 21.1% YoY, with operating<br />
margin at 9.6% (+54 bps YoY).<br />
The net profit declined by 69% YoY to Rs.41 mn mainly on account of higher interest & taxes. The<br />
interest cost increased by 28.7% YoY to Rs.14 mn led by increased working capital requirements.<br />
For FY13, the adjusted PAT grew by 18.2% YoY to Rs.525 mn with margins of 5.2% (5.0%).<br />
EIL started trial production at its Greenfield plant in Balasore in Q4FY13. Post expansion, the<br />
total building products capacity will increase to 810,000 MTPA. This plant will help the <strong>com</strong>pany<br />
to address the demand from the eastern markets, save logistic costs & earn better realizations.<br />
The <strong>com</strong>mercial production is expected to start in Q2FY14E.<br />
The <strong>com</strong>pany has also envisaged a capex of Rs.500 mn in its PEB segment to set up a Greenfield<br />
plant at dahej with a capacity of 30,000 MT and likely to <strong>com</strong>mence operations in Q2FY15E. Post<br />
expansion, the capacity in the PEB segment would expand to 60,000 MT.<br />
EIL has a current order book of 26,200 MT (~RS.2200 mn) to be executed over 6-9 months of<br />
which it has added ~12500 MT (~Rs.1000 mn) in the last one quarter. Post expansion, the new<br />
plant will help the <strong>com</strong>pany to cater to the demands from Western & Southern India.<br />
OUTLOOK & VALUATION<br />
EIL reported disappointing set of numbers for Q4FY13 led by higher material costs which is likely<br />
to dampen the margins for H1FY14E as well. Given the current sluggishness in demand and the<br />
<strong>com</strong>pany’s inability to raise prices, we believe the <strong>com</strong>pany will continue to underperform on the<br />
margin front for the following reasons: (1) higher base of H1FY13 – 13.1% (2) high cost inventory –<br />
Chrysotile Fiber (+18-20% YoY - ~2.4 months) & Finished Goods (~80,000 MT) (3) Higher<br />
depreciation on account of capitalization of Balasore plant & (4) Elevated Interest costs led by high<br />
working capital & long term debt ($12 mn ECB). Though the management has indicated downward<br />
revision (~5-7%) in chrysotile fiber costs (~45-50% of Building products cost), we believe the real<br />
benefit will arise only from H2FY14E. Overall, the current demand scenario suggests us that the<br />
near term outlook is CAUTIOUS, however we believe things would improve towards H2FY14E on<br />
the back of (i) Lower material cost (ii) stabilization of new plant at Balasore (iii) Likely price<br />
increase (iv) likelihood of normal monsoons resulting in improved demand towards peak season<br />
(v) pre-election welfare spending to drive rural demand & (vi) <strong>com</strong>mencement of new steel plant<br />
at Dahej in FY15E. We strongly believe the stock will underperform the market over the next 1-2<br />
quarters for the reasons explained above. However, with gradual improvement in earnings over<br />
FY15E coupled with high dividend yield of 4.4%, we re<strong>com</strong>mend our investors to BUY on dips for a<br />
target of Rs.247. We have factored USDINR at Rs.54.4 & Rs.53.0 for FY14E & FY15E. Any adverse<br />
currency movement could severely affect our earnings estimate.<br />
KEY FINANCIALS<br />
Q4FY13 Result Update<br />
<strong>Everest</strong> <strong>Industries</strong> <strong>Ltd</strong>.<br />
June 5, 2013 BUY HIGH RISK PRICE Rs.170 Target Rs.247<br />
Y/E Mar. Revenue<br />
(Rs mn)<br />
APAT<br />
(Rs mn)<br />
AEPS<br />
(Rs)<br />
AEPS<br />
(% Ch.)<br />
P/E<br />
(x)<br />
ROCE<br />
(%)<br />
ROE<br />
(%)<br />
P/BV<br />
(x)<br />
FY12 8,868.6 444.3 29.4 26.0 5.8 18.7 23.0 1.0<br />
FY13 10,141.3 525.0 34.6 17.6 4.9 19.1 19.5 0.9<br />
FY14E 11,566.1 457.6 30.1 (12.8) 5.6 15.3 15.0 0.8<br />
FY15E 13,542.0 683.1 45.0 49.3 3.8 21.6 19.6 0.7<br />
For private Circulation Only.<br />
Member : BSEL, SEBI Regn.No. INB/F010982338 | NSEIL, SEBI Regn.No.INB/F230607435.<br />
Phone: +91 22 40936000 Fax: +91 22 22665758 Email : info@sushilfinance.<strong>com</strong>
<strong>Everest</strong> <strong>Industries</strong> <strong>Ltd</strong>.<br />
QUARTERLY STATEMENT<br />
Rs.mn<br />
Y/E March Q4FY12 Q3FY13 Q4FY13<br />
Net Sales 2,465.3 2,581.4 2,413.0<br />
(%) Chg YoY 24.6 22.8 (2.1)<br />
Raw Materials 1,403.9 1,466.5 1,449.3<br />
Personnel Cost 214.1 220.8 235.3<br />
Other Costs 620.8 704.5 611.9<br />
Total Expenditure 2,238.8 2,391.8 2,296.5<br />
PBIDT 226.5 189.6 116.5<br />
(%) Chg YoY 26.3 19.3 (48.6)<br />
% OPM 9.2 7.3 4.8<br />
Depreciation 53.0 56.1 57.7<br />
Interest 10.8 13.1 13.9<br />
Other In<strong>com</strong>e 29.8 21.9 31.8<br />
PBT incl OI 192.5 142.3 76.7<br />
Tax 60.4 46.2 36.0<br />
RPAT 132.1 96.1 40.7<br />
(%) Chg YoY 24.4 31.6 (69.2)<br />
% NPM 5.4 3.7 1.7<br />
PROFIT & LOSS STATEMENT<br />
Rs.mn<br />
Y/E March FY12 FY13 FY14E FY15E<br />
Net Sales 8,868.6 10,141.3 11,566.1 13,542.0<br />
COGS 5,917.4 6,819.8 7,918.2 9,060.6<br />
Personnel Cost 797.5 921.0 1,052.5 1,239.1<br />
Freight 712.7 757.3 896.4 1,049.5<br />
Selling & Admin 633.4 665.4 742.5 877.5<br />
EBITDA 807.6 977.8 956.5 1,315.3<br />
Depreciation 200.8 220.5 243.1 270.4<br />
Interest 44.4 55.8 125.0 131.8<br />
Other In<strong>com</strong>e 177.9 87.5 98.6 114.1<br />
PBT incl OI 740.3 789.0 687.1 1,027.2<br />
Tax 212.7 264.0 229.5 344.1<br />
RPAT 527.6 525.0 457.6 683.1<br />
APAT 444.3 525.0 457.6 683.1<br />
BALANCE SHEET STATEMENT<br />
Rs.mn<br />
As on 31st March FY12 FY13E FY14E FY15E<br />
Share Capital 151.1 151.9 151.9 151.9<br />
Reserves & Surplus 2,344.0 2,745.8 3,071.0 3,612.8<br />
Net Worth 2,495.1 2,897.7 3,222.9 3,764.7<br />
Total Loan funds 810.4 1,733.2 1,452.7 1,225.3<br />
Deferred Tax 239.0 245.6 248.3 253.5<br />
Capital Employed 3,544.5 4,876.5 4,923.9 5,243.6<br />
Net Block 2,202.6 2,024.9 2,306.4 2,581.9<br />
Cap. WIP 78.8 459.8 517.2 80.3<br />
Investments 0.2 0.2 0.2 0.2<br />
Inventories 1,579.8 2,541.7 2,661.9 2,988.4<br />
Debtors 417.0 523.5 563.0 683.5<br />
Cash & Bank Bal 351.3 528.4 266.5 695.7<br />
Loans & Advances 512.5 921.8 1,034.8 1,083.3<br />
Curr Liab & Prov 1,603.2 2,136.1 2,438.4 2,882.1<br />
Net Current Assets 1,262.9 2,391.6 2,100.0 2,581.1<br />
Capital Deployed 3,544.5 4,876.5 4,923.9 5,243.6<br />
Source : Company, Sushil Finance Research Estimates<br />
June 5, 2013<br />
FINANCIAL RATIO STATEMENT<br />
Y/E March FY12 FY13E FY14E FY15E<br />
Growth (%)<br />
Net Sales 22.6 14.4 14.0 17.1<br />
EBITDA 19.1 21.1 (2.2) 37.5<br />
Net Profit 26.2 18.2 (12.8) 49.3<br />
Profitability (%)<br />
EBIDTA Margin (%) 9.1 9.6 8.3 9.7<br />
Net Profit Margin (%) 5.0 5.2 4.0 5.0<br />
ROCE (%) 18.7 19.1 15.3 21.6<br />
ROE (%) 23.0 19.5 15.0 19.6<br />
Per Share Data (Rs.)<br />
AEPS (Rs.) 29.4 34.6 30.1 45.0<br />
CEPS (Rs.) 48.1 49.5 46.3 63.1<br />
BVPS (Rs) 165.1 190.8 212.2 247.8<br />
Valuation<br />
PER (x) 5.8 4.9 5.6 3.8<br />
P/BV (x) 1.0 0.9 0.8 0.7<br />
EV/EBITDA (x) 3.7 3.9 3.9 2.4<br />
EV/Net Sales (x) 0.3 0.4 0.3 0.2<br />
Turnover<br />
Inventory Days 96 110 120 114<br />
Debtor Days 16 17 17 17<br />
Creditor Days 43 46 49 48<br />
Gearing Ratio<br />
D/E 0.3 0.6 0.5 0.3<br />
2
<strong>Everest</strong> <strong>Industries</strong> <strong>Ltd</strong>.<br />
Rating Scale<br />
This is a guide to the rating system used by our Institutional Research Team. Our rating<br />
system <strong>com</strong>prises of six rating categories, with a corresponding risk rating.<br />
Risk Rating<br />
Risk Description<br />
Low Risk<br />
Medium Risk<br />
High Risk<br />
Predictability of Earnings / Dividends; Price Volatility<br />
High predictability / Low volatility<br />
Moderate predictability / volatility<br />
Low predictability / High volatility<br />
Total Expected Return Matrix<br />
Rating Low Risk Medium<br />
High Risk<br />
Buy Over 15 %<br />
Risk<br />
Over 20% Over 25%<br />
Accumulate 10 % to 15 15% to 20% to 25%<br />
Hold % 0% to 10 % 202020% 0% to<br />
Sell<br />
Neutral<br />
Not Rated<br />
Please Note<br />
Negative<br />
Returns Not<br />
Applicable Not<br />
Applicable<br />
15% Negative<br />
Returns Not<br />
Applicable Not<br />
Applicable<br />
0% to 20%<br />
Negative Returns<br />
Not Applicable<br />
Not Applicable<br />
•Re<strong>com</strong>mendations with “Neutral” Rating imply reversal of our earlier opinion (i.e. Book Profits / Losses).<br />
•** Indicates that the stock is illiquid With a view to <strong>com</strong>bat the higher acquisition cost for illiquid stocks, we have<br />
enhanced our return criteria for such stocks by five percentage points.<br />
•Stock Review Reports: These are Soft coverage’s on <strong>com</strong>panies where Management access is difficult or Market<br />
capitalization is below Rs. 2000 mn. Views and re<strong>com</strong>mendation on such <strong>com</strong>panies may not necessarily be based<br />
on management meeting but may be based on the publicly available information and/or attending Company AGMs.<br />
Hence Stock Reviews may be just one-time coverage’s with an occasional Update, wherever possible.<br />
Additional information with respect to any securities referred to herein will be available upon request.<br />
This report is prepared for the exclusive use of Sushil Group clients only and should not be reproduced, re-circulated,<br />
published in any media, website or otherwise, in any form or manner, in part or as a whole, without the express<br />
consent in writing of Sushil Financial Services Private Limited. Any unauthorized use, disclosure or public<br />
dissemination of information contained herein is prohibited. This report is to be used only by the original recipient to<br />
whom it is sent.<br />
This is for private circulation only and the said document does not constitute an offer to buy or sell any securities<br />
mentioned herein. While utmost care has been taken in preparing the above, we claim no responsibility for its<br />
accuracy. We shall not be liable for any direct or indirect losses arising from the use thereof and the investors are<br />
requested to use the information contained herein at their own risk.<br />
This report has been prepared for information purposes only and is not a solicitation, or an offer, to buy or sell any<br />
security. It does not purport to be a <strong>com</strong>plete description of the securities, markets or developments referred to in<br />
the material. The information, on which the report is based, has been obtained from sources, which we believe to be<br />
reliable, but we have not independently verified such information and we do not guarantee that it is accurate or<br />
<strong>com</strong>plete. All expressions of opinion are subject to change without notice.<br />
Sushil Financial Services Private Limited and its connected <strong>com</strong>panies, and their respective directors, officers and<br />
employees (to be collectively known as SFSPL), may, from time to time, have a long or short position in the securities<br />
mentioned and may sell or buy such securities. SFSPL may act upon or make use of information contained herein<br />
prior to the publication thereof.<br />
The Investment horizon of this report is approximately 1 year. Any calls which lapse the time duration of a year<br />
would be auto closed without any further notifications/updates. Clients are requested to keep track of the same<br />
June 5, 2013<br />
3