You also want an ePaper? Increase the reach of your titles
YUMPU automatically turns print PDFs into web optimized ePapers that Google loves.
May 28, 2013<br />
Balwindar Singh<br />
balwindarsingh@plindia.<strong>com</strong><br />
+91-22-66322239<br />
Rating Accumulate<br />
Price Rs307<br />
Target Price Rs330<br />
Implied Upside 7.5%<br />
Sensex 20,031<br />
Nifty 6,083<br />
(Prices as on May 27, 2013)<br />
Trading data<br />
Market Cap. (Rs bn) 78.2<br />
Shares o/s (m) 254.8<br />
3M Avg. Daily value (Rs m) 130.1<br />
Major shareholders<br />
Promoters 31.06%<br />
Foreign 18.04%<br />
Domestic Inst. 26.88%<br />
Public & Other 24.02%<br />
Stock Performance<br />
(%) 1M 6M 12M<br />
Absolute (4.3) (1.1) (1.4)<br />
Relative (8.1) (7.5) (24.9)<br />
How we differ from Consensus<br />
EPS (Rs) PL Cons. % Diff.<br />
2014 33.0 37.7 ‐12.4<br />
2015 37.1 40.6 ‐8.7<br />
Price Performance (RIC: TTCH.BO, BB: TTCH IN)<br />
(Rs)<br />
400<br />
350<br />
300<br />
250<br />
200<br />
150<br />
100<br />
50<br />
0<br />
May-12<br />
Jul-12<br />
Sep-12<br />
Source: Bloomberg<br />
Nov-12<br />
Jan-13<br />
Mar-13<br />
May-13<br />
<strong>Tata</strong> <strong>Chemicals</strong><br />
Business environment remains challenging in the near term<br />
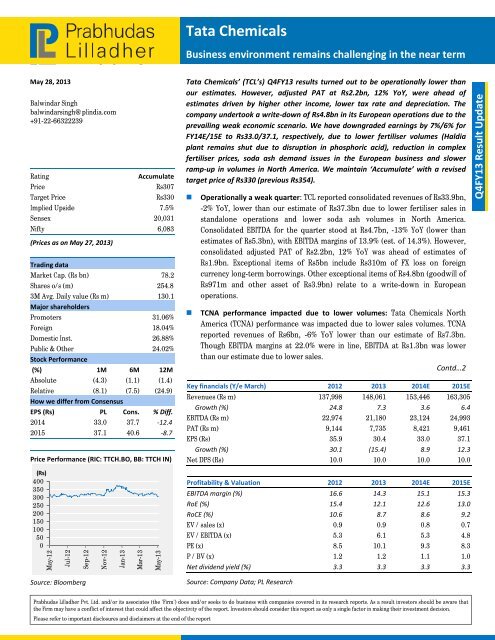
<strong>Tata</strong> <strong>Chemicals</strong>’ (TCL’s) Q4FY13 results turned out to be operationally lower than<br />
our estimates. However, adjusted PAT at Rs2.2bn, 12% YoY, were ahead of<br />
estimates driven by higher other in<strong>com</strong>e, lower tax rate and depreciation. The<br />
<strong>com</strong>pany undertook a write‐down of Rs4.8bn in its European operations due to the<br />
prevailing weak economic scenario. We have downgraded earnings by 7%/6% for<br />
FY14E/15E to Rs33.0/37.1, respectively, due to lower fertiliser volumes (Haldia<br />
plant remains shut due to disruption in phosphoric acid), reduction in <strong>com</strong>plex<br />
fertiliser prices, soda ash demand issues in the European business and slower<br />
ramp‐up in volumes in North America. We maintain ‘Accumulate’ with a revised<br />
target price of Rs330 (previous Rs354).<br />
Operationally a weak quarter: TCL reported consolidated revenues of Rs33.9bn,<br />
-2% YoY, lower than our estimate of Rs37.3bn due to lower fertiliser sales in<br />
standalone operations and lower soda ash volumes in North America.<br />
Consolidated EBITDA for the quarter stood at Rs4.7bn, -13% YoY (lower than<br />
estimates of Rs5.3bn), with EBITDA margins of 13.9% (est. of 14.3%). However,<br />
consolidated adjusted PAT of Rs2.2bn, 12% YoY was ahead of estimates of<br />
Rs1.9bn. Exceptional items of Rs5bn include Rs310m of FX loss on foreign<br />
currency long-term borrowings. Other exceptional items of Rs4.8bn (goodwill of<br />
Rs971m and other asset of Rs3.9bn) relate to a write-down in European<br />
operations.<br />
TCNA performance impacted due to lower volumes: <strong>Tata</strong> <strong>Chemicals</strong> North<br />
America (TCNA) performance was impacted due to lower sales volumes. TCNA<br />
reported revenues of Rs6bn, -6% YoY lower than our estimate of Rs7.3bn.<br />
Though EBITDA margins at 22.0% were in line, EBITDA at Rs1.3bn was lower<br />
than our estimate due to lower sales.<br />
Contd…2<br />
Key financials (Y/e March) 2012 2013 2014E 2015E<br />
Revenues (Rs m) 137,998 148,061 153,446 163,305<br />
Growth (%) 24.8 7.3 3.6 6.4<br />
EBITDA (Rs m) 22,974 21,180 23,124 24,993<br />
PAT (Rs m) 9,144 7,735 8,421 9,461<br />
EPS (Rs) 35.9 30.4 33.0 37.1<br />
Growth (%) 30.1 (15.4) 8.9 12.3<br />
Net DPS (Rs) 10.0 10.0 10.0 10.0<br />
Profitability & Valuation 2012 2013 2014E 2015E<br />
EBITDA margin (%) 16.6 14.3 15.1 15.3<br />
RoE (%) 15.4 12.1 12.6 13.0<br />
RoCE (%) 10.6 8.7 8.6 9.2<br />
EV / sales (x) 0.9 0.9 0.8 0.7<br />
EV / EBITDA (x) 5.3 6.1 5.3 4.8<br />
PE (x) 8.5 10.1 9.3 8.3<br />
P / BV (x) 1.2 1.2 1.1 1.0<br />
Net dividend yield (%) 3.3 3.3 3.3 3.3<br />
Source: Company Data; PL Research<br />
Prabhudas Lilladher Pvt. Ltd. and/or its associates (the 'Firm') does and/or seeks to do business with <strong>com</strong>panies covered in its research reports. As a result investors should be aware that<br />
the Firm may have a conflict of interest that could affect the objectivity of the report. Investors should consider this report as only a single factor in making their investment decision.<br />
Please refer to important disclosures and disclaimers at the end of the report<br />
Q4FY13 Result Update
Exhibit 1: Q4FY13 Result Overview (Rs m) – Consolidated<br />
<strong>Tata</strong> <strong>Chemicals</strong><br />
<strong>Tata</strong> <strong>Chemicals</strong> Europe/Africa reported revenues of Rs5.1bn, -5% YoY lower than<br />
our estimate of Rs5.7bn due to lower volumes. However, EBITDA stood at<br />
Rs880m, -21% YoY above estimates. IMACID reported revenues of Rs740m, 40%<br />
YoY in line with our estimates. EBITDA for the quarter stood at Rs80m, with<br />
margins of 10.8%. However, IMACID’s performance is likely to be impacted in<br />
Q1FY14E due to non-agreement over phosphoric acid rates.<br />
Downgrade earnings; maintain ‘Accumulate’ with a revised target price of<br />
Rs330: We have downgraded earnings to reflect near-term challenges. Though<br />
management indicated that soda ash prices in the South-East Asian market have<br />
bottomed out, TCL’s re-negotiation of pricing contracts are still sometime away.<br />
We maintain ‘Accumulate’ with a revised target price of Rs330. At CMP of<br />
Rs307, stock trades at 9.3x FY14E earnings of Rs33.0.<br />
Y/e March Q4FY13 Q4FY12 YoY gr (%) Q3FY13 FY13 FY12 YoY gr (%)<br />
Net Sales 33,915 34,650 (2.1) 41,968 148,061 137,998 7.3<br />
Expenditure<br />
Raw Materials 11,741 13,488 (13.0) 19,217 57,743 56,533 2.1<br />
% of Net sales 34.6 38.9 45.8 39.0 41.0<br />
Personnel 2,841 2,625 8.2 2,796 11,255 9,710 15.9<br />
% of Net sales 8.4 7.6 6.7 7.6 7.0<br />
Other Expenditure 14,627 13,129 11.4 14,593 57,883 48,781 18.7<br />
% of Net sales 43.1 37.9 34.8 39.1 35.3<br />
Total Expenditure 29,209 29,242 (0.1) 36,606 126,881 115,024 10.3<br />
EBITDA 4,706 5,408 (13.0) 5,362 21,180 22,974 (7.8)<br />
Margin (%) 13.9 15.6 12.8 14.3 16.6<br />
Depreciation 1,191 1,360 (12.4) 1,378 5,339 5,087 5.0<br />
EBIT 3,514 4,049 (13.2) 3,984 15,841 17,887 (11.4)<br />
Interest 1,067 1,208 (11.7) 1,184 4,639 4,270 8.6<br />
Other In<strong>com</strong>e 732 291 152.0 163 1,726 1,228 40.6<br />
PBT 3,179 3,131 1.5 2,963 12,929 14,845 (12.9)<br />
Tax 684 803 (14.8) 733 3,154 3,661 (13.8)<br />
Tax Rate (%) 21.5 25.6 24.7 24.4 24.7<br />
Adjusted PAT before minority 2,495 2,329 7.1 2,230 9,774 11,185 (12.6)<br />
Minority/associate 376 437 481 2,101 2,019<br />
Adjusted PAT 2,119 1,891 12.0 1749 7758 9,144 (15.2)<br />
EO items 3,999 506 690.0 (491) 3,754 768 388.7<br />
Reported PAT (1,880) 1,385 NA 2,241 4,004 8,375 (52.2)<br />
Adjusted EPS 8.3 7.4 12.0 6.9 30.4 35.9 (15.2)<br />
Source: Company Data, PL Research<br />
May 28, 2013 2
Exhibit 3: Consolidated Volumes ('000mt)<br />
Soda ash ‐ Sales<br />
Revision in estimates<br />
<strong>Tata</strong> <strong>Chemicals</strong><br />
We have revised our estimates to reflect lower fertiliser volumes, prices and<br />
pressure on margins. Revised earnings stand at Rs 33.0/37.1 for FY14E/15E,<br />
respectively.<br />
Exhibit 2: Revision in estimates<br />
Old<br />
Estimates<br />
FY14E FY15E<br />
New<br />
Estimates<br />
% Change<br />
Old<br />
Estimates<br />
New<br />
Estimates<br />
% Change<br />
Net sales (Rs m) 161,015 153,446 (4.7) 170,735 163,305 (4.4)<br />
EBITDA (Rs m) 24,474 23,124 (5.5) 26,222 24,993 (4.7)<br />
Margin (%) 15.2 15.1 (13) 15.4 15.3 (5)<br />
APAT (Rs m) 9,025 8,421 (6.7) 10,025 9,461 (5.6)<br />
AEPS (Rs) 35.4 33.0 (6.6) 39.3 37.1 (5.5)<br />
Source: Company Data, PL Research<br />
Q4FY12 Q1FY13 Q2FY13 Q3FY13 Q4FY13 YoY gr. (%) QoQ gr. (%) FY13 FY12 YoY gr. (%)<br />
Domestic 184 154 157 172 177 (3.8) 2.9 660 681 (3.1)<br />
Europe 185 195 186 171 164 (11.4) (4.1) 716 786 (8.9)<br />
Africa 120 104 103 117 103 (14.2) (12.0) 427 484 (11.8)<br />
US 588 575 566 629 573 (2.6) (8.9) 2,343 2,376 (1.4)<br />
Total 1,077 1,028 1,012 1,089 1,017 (5.6) (6.6) 4,146 4,327 (4.2)<br />
Fertilisers<br />
Urea 254 222 322 319 280 10.2 (12.2) 1,143 1,138 0.4<br />
Complex 96 - 112 194 155 61.5 (20.1) 461 589 (21.7)<br />
Others<br />
Salt 219 228 229 223 243 11.0 9.0 923 860 7.3<br />
Soda ash ‐ Production<br />
Domestic 206 179 187 204 202 (1.9) (1.0) 772 760 1.6<br />
Europe 199 196 190 173 176 (11.6) 1.7 735 805 (8.7)<br />
Africa 109 103 128 104 108 (0.9) 3.8 443 482 (8.1)<br />
US 527 566 576 614 575 9.1 (6.4) 2,331 2,299 1.4<br />
Total 1,041 1,044 1,081 1,095 1,061 1.9 (3.1) 4,281 4,346 (1.5)<br />
Source: Company Data, PL Research<br />
May 28, 2013 3
Exhibit 4: Q4FY13 Result Overview (Rs m) – Standalone<br />
Standalone Performance<br />
<strong>Tata</strong> <strong>Chemicals</strong><br />
On a standalone basis, TCL reported sales of Rs19.9bn, -4% YoY lower than our<br />
estimate of Rs21.1bn. Inorganic chemicals reported revenues of Rs7.7bn, 18% YoY in<br />
line with estimates. However, fertilisers reported revenues of Rs12.1bn, -10% YoY<br />
lower than estimates. Standalone EBITDA for the quarter stood at Rs1.8bn, -32% YoY<br />
(estimates of Rs2.9bn) with margins of 9.1% (estimates of 13.9%). Adjusted PAT for<br />
standalone operations stood at Rs761m, -46% YoY. PAT has been adjusted for<br />
Rs310m of exchange loss and Rs1.1bn of profit arising on sale of long-term<br />
investments. Fertiliser EBIT includes Rs 280m of provisioning related to reduction of<br />
prices on inventory.<br />
Y/e March Q4FY13 Q4FY12 YoY gr (%) Q3FY13 FY13 FY12 YoY gr (%)<br />
Net Sales 19,979 20,813 (4.0) 25,455 84,771 79,810 6.2<br />
Expenditure<br />
Raw Materials 10,230 11,554 (11.5) 15,706 46,670 46,232 0.9<br />
% of Net sales 51.2 55.5 61.7 55.1 57.9<br />
Personnel 712 682 4.5 645 2,736 2,398 14.1<br />
% of Net sales 3.6 3.3 2.5 3.2 3.0<br />
Other Expenditure 7,216 5,897 22.4 6,211 25,543 20,723 23.3<br />
% of Net sales 36.1 28.3 24.4 30.1 26.0<br />
Total Expenditure 18,159 18,133 0.1 22,562 74,948 69,353 8.1<br />
EBITDA 1,821 2,680 (32.1) 2,894 9,823 10,457 (6.1)<br />
Margin (%) 9.1 12.9 11.4 11.6 13.1<br />
Depreciation 429 575 (25.3) 550 2,143 2,247 (4.6)<br />
EBIT 1,392 2,106 (33.9) 2,344 7,681 8,211 (6.5)<br />
Interest 455 553 (17.6) 516 2,033 2,102 (3.3)<br />
Other In<strong>com</strong>e 309 277 11.3 244 1,395 1,464 (4.7)<br />
PBT 1,245 1,830 (32.0) 2,072 7,044 7,572 (7.0)<br />
Tax 484 432 12.1 454 1,821 1,778 2.4<br />
Tax Rate (%) 38.9 23.6 21.9 25.8 23.5<br />
Adjusted PAT 761 1,398 (45.6) 1,619 5,127 5,711 (10.2)<br />
EO items (837) (453) NA (803) (1,306) (155) NA<br />
Reported PAT 1,598 1,851 (13.7) 2,422 6,434 5,866 9.7<br />
Adjusted EPS 3.0 5.5 (45.6) 6.4 20.1 22.4 (10.2)<br />
Source: Company Data, PL Research<br />
Exhibit 5: Standalone sales volume analysis ('000 mt)<br />
Q4FY12 Q1FY13 Q2FY13 Q3FY13 Q4FY13 YoY gr. (%) QoQ gr. (%) FY13 FY12 YoY gr. (%)<br />
Soda Ash - India 184 154 157 172 177 (3.8) 2.9 660 681 (3.1)<br />
Food additives - Salt 219 228 229 223 243 11.0 9.0 923 860 7.3<br />
Fertilisers<br />
Urea 254 222 322 319 280 10.2 ‐12.2 1143 1138 0.4<br />
DAP + NPK 96 0 112 194 155 61.5 ‐20.1 461 589 ‐21.7<br />
Source: Company Data, PL Research<br />
May 28, 2013 4
Exhibit 6: TCNA financial performance (Rs m)<br />
Subsidiaries Results<br />
<strong>Tata</strong> <strong>Chemicals</strong><br />
<strong>Tata</strong> <strong>Chemicals</strong> North America (TCNA) ‐ lower sales volumes impact<br />
performance<br />
<strong>Tata</strong> <strong>Chemicals</strong> North America reported revenues of Rs 6bn, -6% YoY lower than our<br />
estimate of Rs7.3bn due to lower volumes. Sales volumes for the quarter stood at<br />
573,000mt, -3% YoY lower than estimates of 676,000mt. EBITDA for this business<br />
stood at Rs1.3bn lower than our estimate of Rs1.6bn. However, margins at 22.0%<br />
were in line with estimates. Despite increase in capacity, sales volumes have not<br />
kept pace in this segment due to operational issues. However, management<br />
indicated that operations have now stabilized and improvement is expected.<br />
Y/e March Q4FY12 Q1FY13 Q2FY13 Q3FY13 Q4FY13 YoY gr. (%) QoQ gr (%) FY13 FY12 YoY gr. (%)<br />
Sales (000 mt) 588 575 566 629 573 (2.6) (8.9) 2,343 2,376 (1.4)<br />
Realisation / Rs mt 10,867 11,635 11,396 10,970 10,489 (3.5) (4.4) 11,118 9,710 14.5<br />
Net Sales 6,390 6,690 6,450 6,900 6,010 (5.9) (12.9) 26,050 23,070 12.9<br />
EBITDA 1,440 1,780 1,510 1,630 1,320 (8.3) (19.0) 6,240 5,880 6.1<br />
Margin (%) 22.5 26.6 23.4 23.6 22.0 (57) (166) 24.0 25.5 (153)<br />
APAT 500 780 590 680 541 8.2 (20.4) 2,591 2,700 (4.0)<br />
Source: Company Data, PL Research<br />
Exhibit 7: Financial performance (Rs m)<br />
<strong>Tata</strong> <strong>Chemicals</strong> Europe/Africa ‐ impairment of Rs4.8bn taken due to<br />
weak macro conditions<br />
This segment reported revenues of Rs5.1bn, -5% YoY lower than our estimate of<br />
Rs5.7bn due to lower volumes. However, EBITDA stood at Rs880m, -21% YoY above<br />
estimates. The <strong>com</strong>pany undertook impairment of Rs4.8bn in the European business.<br />
Soda ash demand continues to remain under pressure in the European region due to<br />
a weak macro outlook.<br />
Y/e March Q4FY12 Q1FY13 Q2FY13 Q3FY13 Q4FY13 YoY gr. (%) QoQ gr. (%) FY13 FY12 YoY gr. (%)<br />
Sales (000 mt) 305 299 289 288 267 (12.5) (7.6) 1,143 1,270 (10.0)<br />
Realisation / Rs mt 17,639 19,431 20,035 19,306 19,213 8.9 (4.1) 19,501 16,433 18.7<br />
Net Sales 5,380 5,810 5,790 5,560 5,130 (4.6) (11.4) 22,290 20,870 6.8<br />
EBITDA 1,120 740 750 370 880 (21.4) 17.3 2,740 3,900 (29.7)<br />
Margin (%) 20.8 12.7 13.0 6.7 17.2 (366) 420 12.3 18.7 (639)<br />
Source: Company Data, PL Research<br />
May 28, 2013 5
Exhibit 8: IMACID's financial performance (Rs m)<br />
<strong>Tata</strong> <strong>Chemicals</strong><br />
IMACID‐ performance in line; Q1FY14E likely to be impacted due to<br />
non‐agreement over phosphoric acid rates<br />
IMACID reported revenues of Rs740m, 40% YoY in line with our estimates. EBITDA<br />
for the quarter stood at Rs80m with margins of 10.8%. However, IMACID’s<br />
performance is likely to be impacted in Q1FY14E due to non-agreement over<br />
phosphoric acid rates.<br />
Y/e March Q4FY12 Q1FY13 Q2FY13 Q3FY13 Q4FY13 YoY gr. (%) QoQ gr. (%) FY13 FY12 YoY gr. (%)<br />
Net Sales 530 420 1,740 2,030 740 39.6 (63.5) 4,930 5,760 (14.4)<br />
EBITDA (20) (100) 100 80 80 NA NA 160 700 (77.1)<br />
Margin (%) (3.8) (23.8) 5.7 3.9 10.8 (386) 174 3.2 12.2 (73)<br />
APAT (30) (120) 70 60 48 NA (20) 58 540 (89.3)<br />
Source: Company Data, PL Research<br />
May 28, 2013 6
In<strong>com</strong>e Statement (Rs m)<br />
Y/e March 2012 2013 2014E 2015E<br />
Net Revenue 137,998 148,061 153,446 163,305<br />
Raw Material Expenses 85,559 74,236 75,044 80,269<br />
Gross Profit 52,439 73,826 78,402 83,035<br />
Employee Cost 11,454 11,255 11,818 12,409<br />
Other Expenses 18,012 41,390 43,460 45,633<br />
EBITDA 22,974 21,180 23,124 24,993<br />
Depr. & Amortization 5,087 5,339 5,828 5,828<br />
Net Interest 3,042 2,913 3,216 3,256<br />
Other In<strong>com</strong>e 1,228 1,726 1,444 1,444<br />
Profit before Tax 14,845 12,929 14,080 15,909<br />
Total Tax 3,439 3,025 3,753 4,253<br />
Profit after Tax 11,406 9,903 10,327 11,656<br />
Ex-Od items / Min. Int. 1,727 1,972 1,906 2,196<br />
Adj. PAT 9,144 7,735 8,421 9,461<br />
Avg. Shares O/S (m) 254.8 254.8 254.8 254.8<br />
EPS (Rs.) 35.9 30.4 33.0 37.1<br />
Cash Flow Abstract (Rs m)<br />
Y/e March 2012 2013 2014E 2015E<br />
C/F from Operations 12,439 5,588 21,229 21,450<br />
C/F from Investing (7,947) (5,189) (6,000) (8,000)<br />
C/F from Financing (1,953) 1,255 (11,027) (11,357)<br />
Inc. / Dec. in Cash 2,539 1,654 4,203 2,094<br />
Opening Cash 14,241 16,780 18,434 22,637<br />
Closing Cash 16,780 18,434 22,637 24,731<br />
FCFF (1,331) (272) 9,447 6,554<br />
FCFE 6,982 9,773 7,947 5,054<br />
Key Financial Metrics<br />
Y/e March 2012 2013 2014E 2015E<br />
Growth<br />
Revenue (%) 24.8 7.3 3.6 6.4<br />
EBITDA (%) 23.3 (7.8) 9.2 8.1<br />
PAT (%) 30.1 (15.4) 8.9 12.3<br />
EPS (%) 30.1 (15.4) 8.9 12.3<br />
Profitability<br />
EBITDA Margin (%) 16.6 14.3 15.1 15.3<br />
PAT Margin (%) 6.6 5.2 5.5 5.8<br />
RoCE (%) 10.6 8.7 8.6 9.2<br />
RoE (%) 15.4 12.1 12.6 13.0<br />
Balance Sheet<br />
Net Debt : Equity 0.7 0.8 0.7 0.5<br />
Net Wrkng Cap. (days) 27 61 59 54<br />
Valuation<br />
PER (x) 8.5 10.1 9.3 8.3<br />
P / B (x) 1.2 1.2 1.1 1.0<br />
EV / EBITDA (x) 5.3 6.1 5.3 4.8<br />
EV / Sales (x) 0.9 0.9 0.8 0.7<br />
Earnings Quality<br />
Eff. Tax Rate 23.2 23.4 26.7 26.7<br />
Other Inc / PBT 8.3 13.4 10.3 9.1<br />
Eff. Depr. Rate (%) 5.1 5.2 5.4 5.0<br />
FCFE / PAT 76.4 126.3 94.4 53.4<br />
Source: Company Data, PL Research.<br />
<strong>Tata</strong> <strong>Chemicals</strong><br />
Balance Sheet Abstract (Rs m)<br />
Y/e March 2012 2013 2014E 2015E<br />
Shareholder's Funds 64,180 64,136 69,596 76,095<br />
Total Debt 59,461 69,506 68,006 66,506<br />
Other Liabilities 18,279 21,175 21,175 21,175<br />
Total Liabilities 141,920 154,816 158,776 163,776<br />
Net Fixed Assets 48,990 46,703 46,875 49,047<br />
Goodwill 64,034 66,270 66,270 66,270<br />
Investments 11,787 12,807 13,591 13,591<br />
Net Current Assets 17,109 29,056 32,061 34,889<br />
Cash & Equivalents 16,780 18,434 22,637 24,731<br />
Other Current Assets 48,240 56,572 55,545 57,630<br />
Current Liabilities 47,911 45,950 46,122 47,472<br />
Other Assets — (21) (21) (21)<br />
Total Assets 141,920 154,816 158,776 163,776<br />
Quarterly Financials (Rs m)<br />
Y/e March Q1FY13 Q2FY13 Q3FY13 Q4FY13<br />
Net Revenue 30,661 41,518 41,968 33,915<br />
EBITDA 4,948 6,165 5,362 4,706<br />
% of revenue 16.1 14.8 12.8 13.9<br />
Depr. & Amortization 1,368 1,402 1,378 1,191<br />
Net Interest 861 696 1,021 335<br />
Other In<strong>com</strong>e 383 449 163 732<br />
Profit before Tax 2,719 4,067 2,963 3,179<br />
Total Tax 450 1,158 733 684<br />
Profit after Tax 1,076 2,568 2,241 (1,875)<br />
Adj. PAT 1,563 2,327 1,749 2,123<br />
Source: Company Data, PL Research.<br />
May 28, 2013 7
Prabhudas Lilladher Pvt. Ltd.<br />
3rd Floor, Sadhana House, 570, P. B. Marg, Worli, Mumbai-400 018, India<br />
Tel: (91 22) 6632 2222 Fax: (91 22) 6632 2209<br />
Rating Distribution of Research Coverage<br />
% of Total Coverage<br />
60%<br />
50%<br />
40%<br />
30%<br />
20%<br />
10%<br />
0%<br />
24.0%<br />
53.5%<br />
21.7%<br />
0.8%<br />
BUY Accumulate Reduce Sell<br />
PL’s Re<strong>com</strong>mendation Nomenclature<br />
BUY : Over 15% Outperformance to Sensex over 12-months Accumulate : Outperformance to Sensex over 12-months<br />
<strong>Tata</strong> <strong>Chemicals</strong><br />
Reduce : Underperformance to Sensex over 12-months Sell : Over 15% underperformance to Sensex over 12-months<br />
Trading Buy : Over 10% absolute upside in 1-month Trading Sell : Over 10% absolute decline in 1-month<br />
Not Rated (NR) : No specific call on the stock Under Review (UR) : Rating likely to change shortly<br />
This document has been prepared by the Research Division of Prabhudas Lilladher Pvt. Ltd. Mumbai, India (PL) and is meant for use by the recipient only as<br />
information and is not for circulation. This document is not to be reported or copied or made available to others without prior permission of PL. It should not be<br />
considered or taken as an offer to sell or a solicitation to buy or sell any security.<br />
The information contained in this report has been obtained from sources that are considered to be reliable. However, PL has not independently verified the accuracy<br />
or <strong>com</strong>pleteness of the same. Neither PL nor any of its affiliates, its directors or its employees accept any responsibility of whatsoever nature for the information,<br />
statements and opinion given, made available or expressed herein or for any omission therein.<br />
Recipients of this report should be aware that past performance is not necessarily a guide to future performance and value of investments can go down as well. The<br />
suitability or otherwise of any investments will depend upon the recipient's particular circumstances and, in case of doubt, advice should be sought from an<br />
independent expert/advisor.<br />
Either PL or its affiliates or its directors or its employees or its representatives or its clients or their relatives may have position(s), make market, act as principal or<br />
engage in transactions of securities of <strong>com</strong>panies referred to in this report and they may have used the research material prior to publication.<br />
We may from time to time solicit or perform investment banking or other services for any <strong>com</strong>pany mentioned in this document.<br />
May 28, 2013 8


