
You also want an ePaper? Increase the reach of your titles
YUMPU automatically turns print PDFs into web optimized ePapers that Google loves.
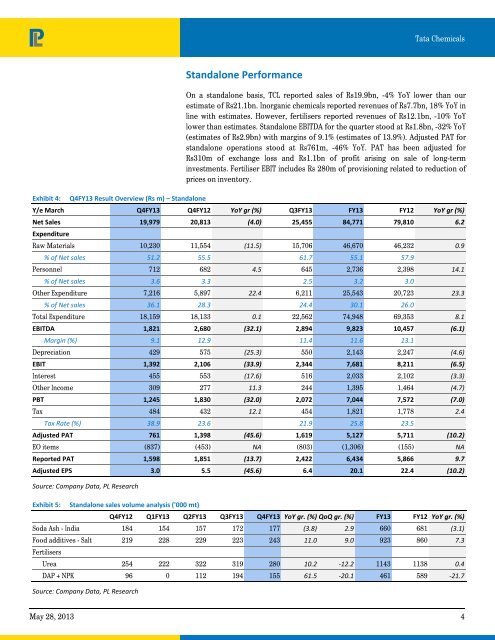
Exhibit 4: Q4FY13 Result Overview (Rs m) – Standalone<br />
Standalone Performance<br />
<strong>Tata</strong> <strong>Chemicals</strong><br />
On a standalone basis, TCL reported sales of Rs19.9bn, -4% YoY lower than our<br />
estimate of Rs21.1bn. Inorganic chemicals reported revenues of Rs7.7bn, 18% YoY in<br />
line with estimates. However, fertilisers reported revenues of Rs12.1bn, -10% YoY<br />
lower than estimates. Standalone EBITDA for the quarter stood at Rs1.8bn, -32% YoY<br />
(estimates of Rs2.9bn) with margins of 9.1% (estimates of 13.9%). Adjusted PAT for<br />
standalone operations stood at Rs761m, -46% YoY. PAT has been adjusted for<br />
Rs310m of exchange loss and Rs1.1bn of profit arising on sale of long-term<br />
investments. Fertiliser EBIT includes Rs 280m of provisioning related to reduction of<br />
prices on inventory.<br />
Y/e March Q4FY13 Q4FY12 YoY gr (%) Q3FY13 FY13 FY12 YoY gr (%)<br />
Net Sales 19,979 20,813 (4.0) 25,455 84,771 79,810 6.2<br />
Expenditure<br />
Raw Materials 10,230 11,554 (11.5) 15,706 46,670 46,232 0.9<br />
% of Net sales 51.2 55.5 61.7 55.1 57.9<br />
Personnel 712 682 4.5 645 2,736 2,398 14.1<br />
% of Net sales 3.6 3.3 2.5 3.2 3.0<br />
Other Expenditure 7,216 5,897 22.4 6,211 25,543 20,723 23.3<br />
% of Net sales 36.1 28.3 24.4 30.1 26.0<br />
Total Expenditure 18,159 18,133 0.1 22,562 74,948 69,353 8.1<br />
EBITDA 1,821 2,680 (32.1) 2,894 9,823 10,457 (6.1)<br />
Margin (%) 9.1 12.9 11.4 11.6 13.1<br />
Depreciation 429 575 (25.3) 550 2,143 2,247 (4.6)<br />
EBIT 1,392 2,106 (33.9) 2,344 7,681 8,211 (6.5)<br />
Interest 455 553 (17.6) 516 2,033 2,102 (3.3)<br />
Other In<strong>com</strong>e 309 277 11.3 244 1,395 1,464 (4.7)<br />
PBT 1,245 1,830 (32.0) 2,072 7,044 7,572 (7.0)<br />
Tax 484 432 12.1 454 1,821 1,778 2.4<br />
Tax Rate (%) 38.9 23.6 21.9 25.8 23.5<br />
Adjusted PAT 761 1,398 (45.6) 1,619 5,127 5,711 (10.2)<br />
EO items (837) (453) NA (803) (1,306) (155) NA<br />
Reported PAT 1,598 1,851 (13.7) 2,422 6,434 5,866 9.7<br />
Adjusted EPS 3.0 5.5 (45.6) 6.4 20.1 22.4 (10.2)<br />
Source: Company Data, PL Research<br />
Exhibit 5: Standalone sales volume analysis ('000 mt)<br />
Q4FY12 Q1FY13 Q2FY13 Q3FY13 Q4FY13 YoY gr. (%) QoQ gr. (%) FY13 FY12 YoY gr. (%)<br />
Soda Ash - India 184 154 157 172 177 (3.8) 2.9 660 681 (3.1)<br />
Food additives - Salt 219 228 229 223 243 11.0 9.0 923 860 7.3<br />
Fertilisers<br />
Urea 254 222 322 319 280 10.2 ‐12.2 1143 1138 0.4<br />
DAP + NPK 96 0 112 194 155 61.5 ‐20.1 461 589 ‐21.7<br />
Source: Company Data, PL Research<br />
May 28, 2013 4