
You also want an ePaper? Increase the reach of your titles
YUMPU automatically turns print PDFs into web optimized ePapers that Google loves.
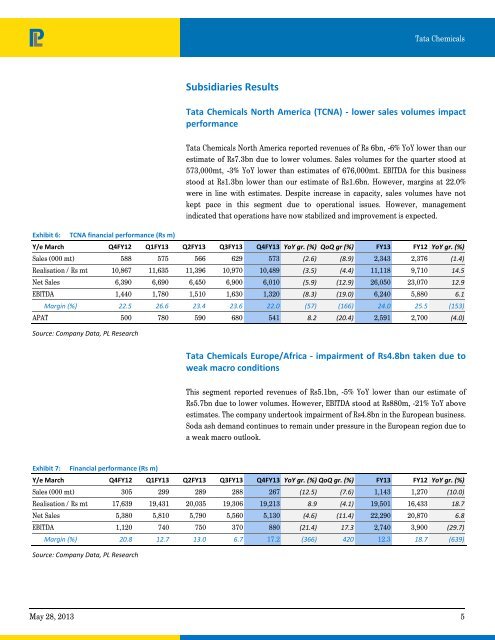
Exhibit 6: TCNA financial performance (Rs m)<br />
Subsidiaries Results<br />
<strong>Tata</strong> <strong>Chemicals</strong><br />
<strong>Tata</strong> <strong>Chemicals</strong> North America (TCNA) ‐ lower sales volumes impact<br />
performance<br />
<strong>Tata</strong> <strong>Chemicals</strong> North America reported revenues of Rs 6bn, -6% YoY lower than our<br />
estimate of Rs7.3bn due to lower volumes. Sales volumes for the quarter stood at<br />
573,000mt, -3% YoY lower than estimates of 676,000mt. EBITDA for this business<br />
stood at Rs1.3bn lower than our estimate of Rs1.6bn. However, margins at 22.0%<br />
were in line with estimates. Despite increase in capacity, sales volumes have not<br />
kept pace in this segment due to operational issues. However, management<br />
indicated that operations have now stabilized and improvement is expected.<br />
Y/e March Q4FY12 Q1FY13 Q2FY13 Q3FY13 Q4FY13 YoY gr. (%) QoQ gr (%) FY13 FY12 YoY gr. (%)<br />
Sales (000 mt) 588 575 566 629 573 (2.6) (8.9) 2,343 2,376 (1.4)<br />
Realisation / Rs mt 10,867 11,635 11,396 10,970 10,489 (3.5) (4.4) 11,118 9,710 14.5<br />
Net Sales 6,390 6,690 6,450 6,900 6,010 (5.9) (12.9) 26,050 23,070 12.9<br />
EBITDA 1,440 1,780 1,510 1,630 1,320 (8.3) (19.0) 6,240 5,880 6.1<br />
Margin (%) 22.5 26.6 23.4 23.6 22.0 (57) (166) 24.0 25.5 (153)<br />
APAT 500 780 590 680 541 8.2 (20.4) 2,591 2,700 (4.0)<br />
Source: Company Data, PL Research<br />
Exhibit 7: Financial performance (Rs m)<br />
<strong>Tata</strong> <strong>Chemicals</strong> Europe/Africa ‐ impairment of Rs4.8bn taken due to<br />
weak macro conditions<br />
This segment reported revenues of Rs5.1bn, -5% YoY lower than our estimate of<br />
Rs5.7bn due to lower volumes. However, EBITDA stood at Rs880m, -21% YoY above<br />
estimates. The <strong>com</strong>pany undertook impairment of Rs4.8bn in the European business.<br />
Soda ash demand continues to remain under pressure in the European region due to<br />
a weak macro outlook.<br />
Y/e March Q4FY12 Q1FY13 Q2FY13 Q3FY13 Q4FY13 YoY gr. (%) QoQ gr. (%) FY13 FY12 YoY gr. (%)<br />
Sales (000 mt) 305 299 289 288 267 (12.5) (7.6) 1,143 1,270 (10.0)<br />
Realisation / Rs mt 17,639 19,431 20,035 19,306 19,213 8.9 (4.1) 19,501 16,433 18.7<br />
Net Sales 5,380 5,810 5,790 5,560 5,130 (4.6) (11.4) 22,290 20,870 6.8<br />
EBITDA 1,120 740 750 370 880 (21.4) 17.3 2,740 3,900 (29.7)<br />
Margin (%) 20.8 12.7 13.0 6.7 17.2 (366) 420 12.3 18.7 (639)<br />
Source: Company Data, PL Research<br />
May 28, 2013 5