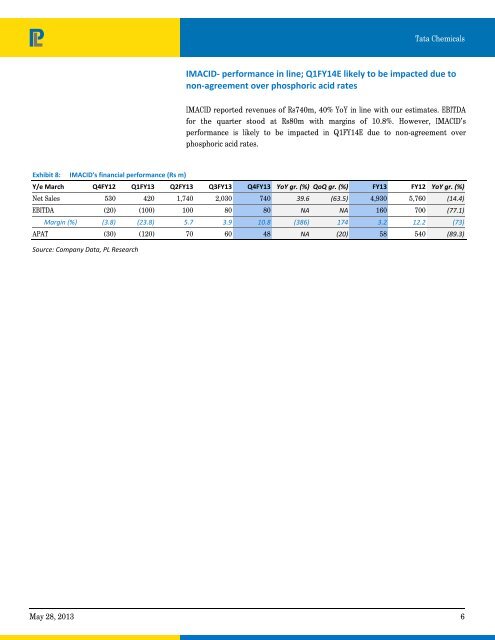
Exhibit 8: IMACID's financial performance (Rs m) <strong>Tata</strong> <strong>Chemicals</strong> IMACID‐ performance in line; Q1FY14E likely to be impacted due to non‐agreement over phosphoric acid rates IMACID reported revenues of Rs740m, 40% YoY in line with our estimates. EBITDA for the quarter stood at Rs80m with margins of 10.8%. However, IMACID’s performance is likely to be impacted in Q1FY14E due to non-agreement over phosphoric acid rates. Y/e March Q4FY12 Q1FY13 Q2FY13 Q3FY13 Q4FY13 YoY gr. (%) QoQ gr. (%) FY13 FY12 YoY gr. (%) Net Sales 530 420 1,740 2,030 740 39.6 (63.5) 4,930 5,760 (14.4) EBITDA (20) (100) 100 80 80 NA NA 160 700 (77.1) Margin (%) (3.8) (23.8) 5.7 3.9 10.8 (386) 174 3.2 12.2 (73) APAT (30) (120) 70 60 48 NA (20) 58 540 (89.3) Source: Company Data, PL Research May 28, 2013 6
In<strong>com</strong>e Statement (Rs m) Y/e March 2012 2013 2014E 2015E Net Revenue 137,998 148,061 153,446 163,305 Raw Material Expenses 85,559 74,236 75,044 80,269 Gross Profit 52,439 73,826 78,402 83,035 Employee Cost 11,454 11,255 11,818 12,409 Other Expenses 18,012 41,390 43,460 45,633 EBITDA 22,974 21,180 23,124 24,993 Depr. & Amortization 5,087 5,339 5,828 5,828 Net Interest 3,042 2,913 3,216 3,256 Other In<strong>com</strong>e 1,228 1,726 1,444 1,444 Profit before Tax 14,845 12,929 14,080 15,909 Total Tax 3,439 3,025 3,753 4,253 Profit after Tax 11,406 9,903 10,327 11,656 Ex-Od items / Min. Int. 1,727 1,972 1,906 2,196 Adj. PAT 9,144 7,735 8,421 9,461 Avg. Shares O/S (m) 254.8 254.8 254.8 254.8 EPS (Rs.) 35.9 30.4 33.0 37.1 Cash Flow Abstract (Rs m) Y/e March 2012 2013 2014E 2015E C/F from Operations 12,439 5,588 21,229 21,450 C/F from Investing (7,947) (5,189) (6,000) (8,000) C/F from Financing (1,953) 1,255 (11,027) (11,357) Inc. / Dec. in Cash 2,539 1,654 4,203 2,094 Opening Cash 14,241 16,780 18,434 22,637 Closing Cash 16,780 18,434 22,637 24,731 FCFF (1,331) (272) 9,447 6,554 FCFE 6,982 9,773 7,947 5,054 Key Financial Metrics Y/e March 2012 2013 2014E 2015E Growth Revenue (%) 24.8 7.3 3.6 6.4 EBITDA (%) 23.3 (7.8) 9.2 8.1 PAT (%) 30.1 (15.4) 8.9 12.3 EPS (%) 30.1 (15.4) 8.9 12.3 Profitability EBITDA Margin (%) 16.6 14.3 15.1 15.3 PAT Margin (%) 6.6 5.2 5.5 5.8 RoCE (%) 10.6 8.7 8.6 9.2 RoE (%) 15.4 12.1 12.6 13.0 Balance Sheet Net Debt : Equity 0.7 0.8 0.7 0.5 Net Wrkng Cap. (days) 27 61 59 54 Valuation PER (x) 8.5 10.1 9.3 8.3 P / B (x) 1.2 1.2 1.1 1.0 EV / EBITDA (x) 5.3 6.1 5.3 4.8 EV / Sales (x) 0.9 0.9 0.8 0.7 Earnings Quality Eff. Tax Rate 23.2 23.4 26.7 26.7 Other Inc / PBT 8.3 13.4 10.3 9.1 Eff. Depr. Rate (%) 5.1 5.2 5.4 5.0 FCFE / PAT 76.4 126.3 94.4 53.4 Source: Company Data, PL Research. <strong>Tata</strong> <strong>Chemicals</strong> Balance Sheet Abstract (Rs m) Y/e March 2012 2013 2014E 2015E Shareholder's Funds 64,180 64,136 69,596 76,095 Total Debt 59,461 69,506 68,006 66,506 Other Liabilities 18,279 21,175 21,175 21,175 Total Liabilities 141,920 154,816 158,776 163,776 Net Fixed Assets 48,990 46,703 46,875 49,047 Goodwill 64,034 66,270 66,270 66,270 Investments 11,787 12,807 13,591 13,591 Net Current Assets 17,109 29,056 32,061 34,889 Cash & Equivalents 16,780 18,434 22,637 24,731 Other Current Assets 48,240 56,572 55,545 57,630 Current Liabilities 47,911 45,950 46,122 47,472 Other Assets — (21) (21) (21) Total Assets 141,920 154,816 158,776 163,776 Quarterly Financials (Rs m) Y/e March Q1FY13 Q2FY13 Q3FY13 Q4FY13 Net Revenue 30,661 41,518 41,968 33,915 EBITDA 4,948 6,165 5,362 4,706 % of revenue 16.1 14.8 12.8 13.9 Depr. & Amortization 1,368 1,402 1,378 1,191 Net Interest 861 696 1,021 335 Other In<strong>com</strong>e 383 449 163 732 Profit before Tax 2,719 4,067 2,963 3,179 Total Tax 450 1,158 733 684 Profit after Tax 1,076 2,568 2,241 (1,875) Adj. PAT 1,563 2,327 1,749 2,123 Source: Company Data, PL Research. May 28, 2013 7