
You also want an ePaper? Increase the reach of your titles
YUMPU automatically turns print PDFs into web optimized ePapers that Google loves.
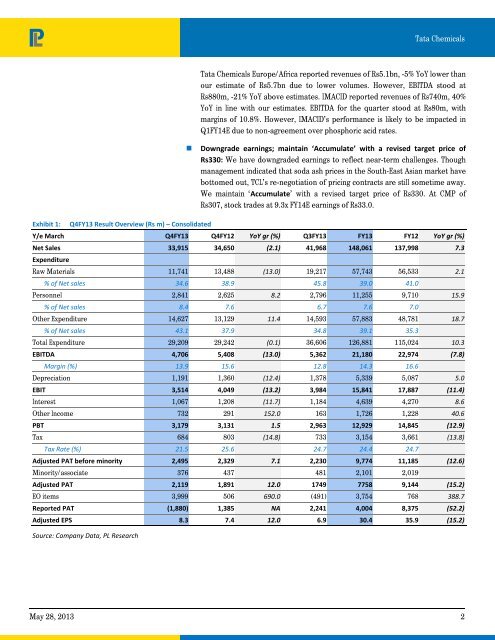
Exhibit 1: Q4FY13 Result Overview (Rs m) – Consolidated<br />
<strong>Tata</strong> <strong>Chemicals</strong><br />
<strong>Tata</strong> <strong>Chemicals</strong> Europe/Africa reported revenues of Rs5.1bn, -5% YoY lower than<br />
our estimate of Rs5.7bn due to lower volumes. However, EBITDA stood at<br />
Rs880m, -21% YoY above estimates. IMACID reported revenues of Rs740m, 40%<br />
YoY in line with our estimates. EBITDA for the quarter stood at Rs80m, with<br />
margins of 10.8%. However, IMACID’s performance is likely to be impacted in<br />
Q1FY14E due to non-agreement over phosphoric acid rates.<br />
Downgrade earnings; maintain ‘Accumulate’ with a revised target price of<br />
Rs330: We have downgraded earnings to reflect near-term challenges. Though<br />
management indicated that soda ash prices in the South-East Asian market have<br />
bottomed out, TCL’s re-negotiation of pricing contracts are still sometime away.<br />
We maintain ‘Accumulate’ with a revised target price of Rs330. At CMP of<br />
Rs307, stock trades at 9.3x FY14E earnings of Rs33.0.<br />
Y/e March Q4FY13 Q4FY12 YoY gr (%) Q3FY13 FY13 FY12 YoY gr (%)<br />
Net Sales 33,915 34,650 (2.1) 41,968 148,061 137,998 7.3<br />
Expenditure<br />
Raw Materials 11,741 13,488 (13.0) 19,217 57,743 56,533 2.1<br />
% of Net sales 34.6 38.9 45.8 39.0 41.0<br />
Personnel 2,841 2,625 8.2 2,796 11,255 9,710 15.9<br />
% of Net sales 8.4 7.6 6.7 7.6 7.0<br />
Other Expenditure 14,627 13,129 11.4 14,593 57,883 48,781 18.7<br />
% of Net sales 43.1 37.9 34.8 39.1 35.3<br />
Total Expenditure 29,209 29,242 (0.1) 36,606 126,881 115,024 10.3<br />
EBITDA 4,706 5,408 (13.0) 5,362 21,180 22,974 (7.8)<br />
Margin (%) 13.9 15.6 12.8 14.3 16.6<br />
Depreciation 1,191 1,360 (12.4) 1,378 5,339 5,087 5.0<br />
EBIT 3,514 4,049 (13.2) 3,984 15,841 17,887 (11.4)<br />
Interest 1,067 1,208 (11.7) 1,184 4,639 4,270 8.6<br />
Other In<strong>com</strong>e 732 291 152.0 163 1,726 1,228 40.6<br />
PBT 3,179 3,131 1.5 2,963 12,929 14,845 (12.9)<br />
Tax 684 803 (14.8) 733 3,154 3,661 (13.8)<br />
Tax Rate (%) 21.5 25.6 24.7 24.4 24.7<br />
Adjusted PAT before minority 2,495 2,329 7.1 2,230 9,774 11,185 (12.6)<br />
Minority/associate 376 437 481 2,101 2,019<br />
Adjusted PAT 2,119 1,891 12.0 1749 7758 9,144 (15.2)<br />
EO items 3,999 506 690.0 (491) 3,754 768 388.7<br />
Reported PAT (1,880) 1,385 NA 2,241 4,004 8,375 (52.2)<br />
Adjusted EPS 8.3 7.4 12.0 6.9 30.4 35.9 (15.2)<br />
Source: Company Data, PL Research<br />
May 28, 2013 2