PINC POWERPICKS - Myiris.com
PINC POWERPICKS - Myiris.com
PINC POWERPICKS - Myiris.com

You also want an ePaper? Increase the reach of your titles
YUMPU automatically turns print PDFs into web optimized ePapers that Google loves.
<strong>PINC</strong> <strong>POWERPICKS</strong> RESEARCH<br />
RESEARCH<br />
POWER GRID: BUY, TP-Rs122 (18% upside)<br />
What’s the theme?<br />
With 68% of the XIth Plan targeted capex of Rs550bn already spent over the first four years, PGCIL is the<br />
only <strong>com</strong>pany in the power sector to be on track to meet its capex guidance. This, coupled with increased<br />
capex run-rate should translate into 21% CAGR in its regulated equity base over FY11-15E. In addition,<br />
the <strong>com</strong>pany is insulated from risks of rising fuel cost and SEB defaults (as payments are secured through<br />
a tripartite agreement). We believe the stock offers safe and steady returns <strong>com</strong>pared with its private<br />
sector peers.<br />
What will move the stock?<br />
1) Conversion of the large CWIP into regulatory assets translating into increased earnings for the <strong>com</strong>pany,<br />
2) Increase in capex run-rate to meet its XIIth Plan target of Rs1.2tn (which is more than double its XIth<br />
plan target) 3) Increased capex leading to higher capitalisation and resulting in higher earnings and<br />
4) Turnaround of the tele<strong>com</strong> division.<br />
Where are we stacked versus consensus?<br />
Our PAT estimate for FY12 and FY13 is lower than consensus by 3% and 1% respectively. We value<br />
PGCIL on FCFE basis to arrive at a target price of Rs122 (terminal growth rate 3% and 14% Ke)<br />
What will challenge our target price?<br />
1) Delays in capitalisation of projects under construction.<br />
2) Lower incentives and STOA in<strong>com</strong>e impact earnings estimates.<br />
(Rs mn) FY10 FY11P FY12E YoY % FY13E YoY %<br />
Net Sales 72,233 84,147 100,995 20.0 117,458 16.3<br />
EBITDA 59,652 70,774 85,570 20.9 100,283 17.2<br />
EBITDA Mar (%) 82.6 84.1 84.7 62 bps 85.4 65 bps<br />
Adj. Net Profits 21,372 27,013 29,081 7.7 34,868 19.9<br />
Dil. EPS (Rs) 4.8 5.8 6.3 7.8 7.5 19.9<br />
PER (x) 21.4 17.8 16.5 - 13.8 -<br />
RoE (%) 14.0 14.5 13.0 (145)bps 14.3 126 bps<br />
ROCE (%) 8.8 9.4 9.3 (13)bps 9.7 40 bps<br />
11<br />
Sector: Power Utilities<br />
CMP: Rs104; Mcap: Rs480bn<br />
Bloomberg: PWGR IN; Reuters: PGRD.BO<br />
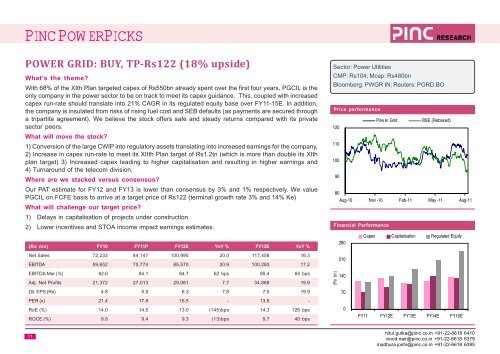
Price performance<br />
120<br />
110<br />
100<br />
90<br />
80<br />
Aug-10 Nov -10 Feb-11 May -11 Aug-11<br />
Financial Performance<br />
(Rs bn)<br />
280<br />
210<br />
140<br />
70<br />
0<br />
Pow er Grid BSE (Rebased)<br />
Capex Capitalisation Regulated Equity<br />
FY11 FY12E FY13E FY14E FY15E<br />
hitul.gutka@pinc.co.in +91-22-6618 6410<br />
vinod.nair@pinc.co.in +91-22-6618 6379<br />
madhura.joshi@pinc.co.in +91-22-6618 6395