Eros International (EROINT) - Myiris.com
Eros International (EROINT) - Myiris.com
Eros International (EROINT) - Myiris.com

Create successful ePaper yourself
Turn your PDF publications into a flip-book with our unique Google optimized e-Paper software.
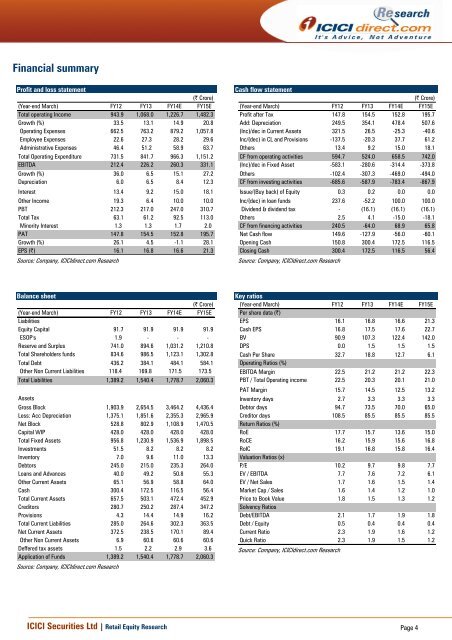
Financial summary<br />
Profit and loss statement<br />
(| Crore)<br />
(Year-end March) FY12 FY13 FY14E FY15E<br />
Total operating In<strong>com</strong>e 943.9 1,068.0 1,226.7 1,482.3<br />
Growth (%) 33.5 13.1 14.9 20.8<br />
Operating Expenses 662.5 763.2 879.2 1,057.8<br />
Employee Expenses 22.6 27.3 28.2 29.6<br />
Administrative Expenses 46.4 51.2 58.9 63.7<br />
Total Operating Expenditure 731.5 841.7 966.3 1,151.2<br />
EBITDA 212.4 226.2 260.3 331.1<br />
Growth (%) 36.0 6.5 15.1 27.2<br />
Depreciation 6.0 6.5 8.4 12.3<br />
Interest 13.4 9.2 15.0 18.1<br />
Other In<strong>com</strong>e 19.3 6.4 10.0 10.0<br />
PBT 212.3 217.0 247.0 310.7<br />
Total Tax 63.1 61.2 92.5 113.0<br />
Minority Interest 1.3 1.3 1.7 2.0<br />
PAT 147.8 154.5 152.8 195.7<br />
Growth (%) 26.1 4.5 -1.1 28.1<br />
EPS (|) 16.1 16.8 16.6 21.3<br />
Source: Company, ICICIdirect.<strong>com</strong> Research<br />
Cash flow statement<br />
(| Crore)<br />
(Year-end March) FY12 FY13 FY14E FY15E<br />
Profit after Tax 147.8 154.5 152.8 195.7<br />
Add: Depreciation 249.5 354.1 478.4 507.6<br />
(Inc)/dec in Current Assets 321.5 26.5 -25.3 -40.6<br />
Inc/(dec) in CL and Provisions -137.5 -20.3 37.7 61.2<br />
Others 13.4 9.2 15.0 18.1<br />
CF from operating activities 594.7 524.0 658.5 742.0<br />
(Inc)/dec in Fixed Asset -583.1 -280.6 -314.4 -373.8<br />
Others -102.4 -307.3 -469.0 -494.0<br />
CF from investing activities -685.6 -587.9 -783.4 -867.9<br />
Issue/(Buy back) of Equity 0.3 0.2 0.0 0.0<br />
Inc/(dec) in loan funds 237.6 -52.2 100.0 100.0<br />
Dividend & dividend tax - (16.1) (16.1) (16.1)<br />
Others 2.5 4.1 -15.0 -18.1<br />
CF from financing activities 240.5 -64.0 68.9 65.8<br />
Net Cash flow 149.6 -127.9 -56.0 -60.1<br />
Opening Cash 150.8 300.4 172.5 116.5<br />
Closing Cash 300.4 172.5 116.5 56.4<br />
Source: Company, ICICIdirect.<strong>com</strong> Research<br />
Balance sheet<br />
(| Crore)<br />
(Year-end March) FY12 FY13 FY14E FY15E<br />
Liabilities<br />
Equity Capital 91.7 91.9 91.9 91.9<br />
ESOP's 1.9 - - -<br />
Reserve and Surplus 741.0 894.6 1,031.2 1,210.8<br />
Total Shareholders funds 834.6 986.5 1,123.1 1,302.8<br />
Total Debt 436.2 384.1 484.1 584.1<br />
Other Non Current Liabilities 118.4 169.8 171.5 173.5<br />
Total Liabilities 1,389.2 1,540.4 1,778.7 2,060.3<br />
Assets<br />
Gross Block 1,903.9 2,654.5 3,464.2 4,436.4<br />
Less: Acc Depreciation 1,375.1 1,851.6 2,355.3 2,965.9<br />
Net Block 528.8 802.9 1,108.9 1,470.5<br />
Capital WIP 428.0 428.0 428.0 428.0<br />
Total Fixed Assets 956.8 1,230.9 1,536.9 1,898.5<br />
Investments 51.5 8.2 8.2 8.2<br />
Inventory 7.0 9.6 11.0 13.3<br />
Debtors 245.0 215.0 235.3 264.0<br />
Loans and Advances 40.0 49.2 50.8 55.3<br />
Other Current Assets 65.1 56.9 58.8 64.0<br />
Cash 300.4 172.5 116.5 56.4<br />
Total Current Assets 657.5 503.1 472.4 452.9<br />
Creditors 280.7 250.2 287.4 347.2<br />
Provisions 4.3 14.4 14.9 16.2<br />
Total Current Liabilities 285.0 264.6 302.3 363.5<br />
Net Current Assets 372.5 238.5 170.1 89.4<br />
Other Non Current Assets 6.9 60.6 60.6 60.6<br />
Deffered tax assets 1.5 2.2 2.9 3.6<br />
Application of Funds 1,389.2 1,540.4 1,778.7 2,060.3<br />
Source: Company, ICICIdirect.<strong>com</strong> Research<br />
Key ratios<br />
(Year-end March) FY12 FY13 FY14E FY15E<br />
Per share data (|)<br />
EPS 16.1 16.8 16.6 21.3<br />
Cash EPS 16.8 17.5 17.6 22.7<br />
BV 90.9 107.3 122.4 142.0<br />
DPS 0.0 1.5 1.5 1.5<br />
Cash Per Share 32.7 18.8 12.7 6.1<br />
Operating Ratios (%)<br />
EBITDA Margin 22.5 21.2 21.2 22.3<br />
PBT / Total Operating in<strong>com</strong>e 22.5 20.3 20.1 21.0<br />
PAT Margin 15.7 14.5 12.5 13.2<br />
Inventory days 2.7 3.3 3.3 3.3<br />
Debtor days 94.7 73.5 70.0 65.0<br />
Creditor days 108.5 85.5 85.5 85.5<br />
Return Ratios (%)<br />
RoE 17.7 15.7 13.6 15.0<br />
RoCE 16.2 15.9 15.6 16.8<br />
RoIC 19.1 16.8 15.8 16.4<br />
Valuation Ratios (x)<br />
P/E 10.2 9.7 9.8 7.7<br />
EV / EBITDA 7.7 7.6 7.2 6.1<br />
EV / Net Sales 1.7 1.6 1.5 1.4<br />
Market Cap / Sales 1.6 1.4 1.2 1.0<br />
Price to Book Value 1.8 1.5 1.3 1.2<br />
Solvency Ratios<br />
Debt/EBITDA 2.1 1.7 1.9 1.8<br />
Debt / Equity 0.5 0.4 0.4 0.4<br />
Current Ratio 2.3 1.9 1.6 1.2<br />
Quick Ratio 2.3 1.9 1.5 1.2<br />
Source: Company, ICICIdirect.<strong>com</strong> Research<br />
ICICI Securities Ltd | Retail Equity Research Page 4