Solar controller XTDC - Sorel
Solar controller XTDC - Sorel
Solar controller XTDC - Sorel

You also want an ePaper? Increase the reach of your titles
YUMPU automatically turns print PDFs into web optimized ePapers that Google loves.
Measurement values<br />
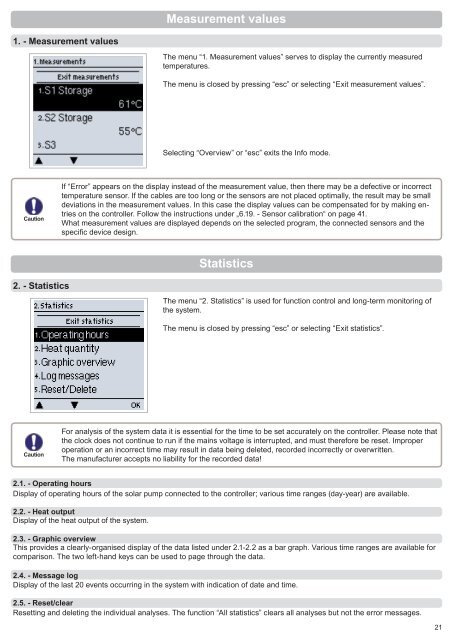
1. - Measurement values<br />
The menu “1. Measurement values” serves to display the currently measured<br />
temperatures.<br />
The menu is closed by pressing “esc” or selecting “Exit measurement values”.<br />
Selecting “Overview” or “esc” exits the Info mode.<br />
Caution<br />
If “Error” appears on the display instead of the measurement value, then there may be a defective or incorrect<br />
temperature sensor. If the cables are too long or the sensors are not placed optimally, the result may be small<br />
deviations in the measurement values. In this case the display values can be compensated for by making entries<br />
on the <strong>controller</strong>. Follow the instructions under „6.19. - Sensor calibration“ on page 41.<br />
What measurement values are displayed depends on the selected program, the connected sensors and the<br />
specifi c device design.<br />
Statistics<br />
2. - Statistics<br />
The menu “2. Statistics” is used for function control and long-term monitoring of<br />
the system.<br />
The menu is closed by pressing “esc” or selecting “Exit statistics”.<br />
Caution<br />
For analysis of the system data it is essential for the time to be set accurately on the <strong>controller</strong>. Please note that<br />
the clock does not continue to run if the mains voltage is interrupted, and must therefore be reset. Improper<br />
operation or an incorrect time may result in data being deleted, recorded incorrectly or overwritten.<br />
The manufacturer accepts no liability for the recorded data!<br />
2.1. - Operating hours<br />
Display of operating hours of the solar pump connected to the <strong>controller</strong>; various time ranges (day-year) are available.<br />
2.2. - Heat output<br />
Display of the heat output of the system.<br />
2.3. - Graphic overview<br />
This provides a clearly-organised display of the data listed under 2.1-2.2 as a bar graph. Various time ranges are available for<br />
comparison. The two left-hand keys can be used to page through the data.<br />
2.4. - Message log<br />
Display of the last 20 events occurring in the system with indication of date and time.<br />
2.5. - Reset/clear<br />
Resetting and deleting the individual analyses. The function “All statistics” clears all analyses but not the error messages.<br />
21