OneSight Administrator Guide
OneSight Administrator Guide
OneSight Administrator Guide

You also want an ePaper? Increase the reach of your titles
YUMPU automatically turns print PDFs into web optimized ePapers that Google loves.
<strong>Administrator</strong> <strong>Guide</strong><br />
Empirix <strong>OneSight</strong> Version 8.1
<strong>OneSight</strong> <strong>Administrator</strong> <strong>Guide</strong>, Version 8.1<br />
Empirix Inc.<br />
Copyright Notice<br />
Copyright © 1997-2012 Empirix Inc. All rights reserved. The<br />
contents of this document and the associated <strong>OneSight</strong> suite<br />
software are the property of Empirix Inc. and are copyrighted. No<br />
part of this document may be copied or distributed, transmitted,<br />
transcribed, stored in a retrieval system, or translated into any<br />
human or computer language, in any form, or by any means,<br />
electronic, mechanical, magnetic, manual, or otherwise, or disclosed<br />
to third parties without the express written permission of Empirix<br />
Inc.<br />
This Empirix software product also includes copyrighted third party<br />
software. See the <strong>OneSight</strong> online help for complete information<br />
about third party copyrights.<br />
Trademarks<br />
Empirix logos are either registered trademarks or trademarks of<br />
Empirix Inc. in the United States and/or other countries. All other<br />
names are used for identification purposes only and may be either<br />
registered trademarks or trademarks of their respective owners.<br />
Empirix Inc.<br />
20 Crosby Drive<br />
Bedford, MA 01730<br />
Ph: 781-266-3200<br />
Fax: 781-266-3201<br />
Web: http://www.empirix.com<br />
Email: onesight-sales@empirix.com<br />
USA, Japan, Singapore, UK/Europe<br />
To contact a local Empirix office, visit our Web site at<br />
www.empirix.com<br />
ii
Contents<br />
Contents<br />
Preface<br />
xvii<br />
About This <strong>Guide</strong> ............................................................................... xvii<br />
Related Documentation ..................................................................... xviii<br />
<strong>OneSight</strong> Manuals ....................................................................... xviii<br />
Conventions ..................................................................................... xviiii<br />
Using Help ....................................................................................... xviiii<br />
Obtaining Technical Support ................................................................ xx<br />
C h a p t e r 1<br />
Introduction 1<br />
Feature Highlights .................................................................................. 1<br />
What <strong>OneSight</strong> Monitors ........................................................................ 2<br />
Dedicated Monitors ................................................................... 2<br />
Applications .............................................................................. 3<br />
Network Devices ....................................................................... 4<br />
Network Performance ................................................................ 4<br />
System Requirements ............................................................................. 4<br />
<strong>OneSight</strong> Server and Data Collector Requirements ......................... 5<br />
Additional Requirements ........................................................... 6<br />
Database Requirements ............................................................. 7<br />
Client Web Browser Requirements .................................................. 7<br />
PC Clients .................................................................................. 7<br />
UNIX Clients ............................................................................. 7<br />
Notes About Web Browser Requirements................................. 7<br />
Contact Center Component Requirements ....................................... 8<br />
C h a p t e r 2<br />
Installing <strong>OneSight</strong> 11<br />
What <strong>OneSight</strong> Installs ......................................................................... 11<br />
Contents<br />
iii
Contents<br />
Third-Party Software ..................................................................... 11<br />
Services .......................................................................................... 12<br />
Installing <strong>OneSight</strong> ............................................................................... 12<br />
Configuring SQL 2005 and 2008 ................................................... 17<br />
Enabling Mixed Authentication Mode .................................... 17<br />
Turning on XP_CMDSHELL ................................................. 17<br />
Changing Session Timeout ................................................................... 18<br />
Changing the <strong>OneSight</strong> Server Default Port ........................................ 18<br />
Enabling SSL for the <strong>OneSight</strong> Server ................................................. 18<br />
Updating Profiles After Upgrading <strong>OneSight</strong> ...................................... 18<br />
Installing the <strong>OneSight</strong> Data Collector or Remote Agent .................... 19<br />
Data Collectors and Remote Agents .............................................. 20<br />
Should I Install the Data Collector or Remote Agent? .................. 22<br />
Remote Agent Installation Requirements ...................................... 23<br />
Installing the Remote Agent on Windows ..................................... 24<br />
Identifying the Remote Agent Machine to the <strong>OneSight</strong> Server<br />
................................................................................................. 26<br />
Using an Initialization File for Remote Agent Setup .............. 27<br />
Installing the UNIX Remote Agent ............................................... 27<br />
Installing the UNIX Remote Agent ......................................... 28<br />
Running the UNIX Remote Agent .......................................... 30<br />
Starting and Stopping the UNIX Remote Agent ..................... 31<br />
Data Collector Installation Requirements ...................................... 32<br />
Installing the Data Collector on a Windows Machine ................... 32<br />
Using the JMX Proxy ........................................................................... 35<br />
Installing JMX Proxy Automatically ............................................. 36<br />
Installing JMX Proxy Manually .................................................... 37<br />
Configuring the JMX Proxy .......................................................... 37<br />
Post Installation .................................................................................... 38<br />
<strong>OneSight</strong> Agent Proxy .......................................................................... 39<br />
Installing the Agent Proxy ............................................................. 40<br />
Data Collector or Remote Agent Configuration ...................... 42<br />
<strong>OneSight</strong> Server Configuration ............................................... 43<br />
Debugging the Agent Proxy .................................................... 43<br />
<strong>OneSight</strong> Default Ports ......................................................................... 46<br />
Configuring Contact Center Components ............................................ 47<br />
SNMP ............................................................................................. 49<br />
Using Perfmon ............................................................................... 50<br />
iv<br />
<strong>OneSight</strong> <strong>Administrator</strong> <strong>Guide</strong>
Contents<br />
To check for SQL objects in Perfmon ..................................... 50<br />
Using Diskperf ............................................................................... 51<br />
To execute the Diskperf command .......................................... 51<br />
To log in to <strong>OneSight</strong> ........................................................................... 52<br />
Using <strong>OneSight</strong> Log In .................................................................. 52<br />
Using Windows Log In .................................................................. 52<br />
Uninstalling <strong>OneSight</strong> .......................................................................... 53<br />
To Uninstall <strong>OneSight</strong> using Add/Remove Programs ............. 53<br />
To Uninstall the Data Collector ............................................... 54<br />
To Remove the Database ......................................................... 54<br />
To Remove the Empirix Folder ............................................... 55<br />
Removing the Data Collector from a Windows machine ..................... 55<br />
Removing the <strong>OneSight</strong> Remote Agent ............................................... 55<br />
Removing Remote Agent from a Windows Machine .................... 55<br />
Removing the UNIX Remote Agent .............................................. 56<br />
Uninstalling Agent Proxy ..................................................................... 57<br />
Starting the <strong>OneSight</strong> Service .............................................................. 57<br />
Stopping the <strong>OneSight</strong> Service ............................................................. 58<br />
Viewing Version and Database Information ........................................ 58<br />
How <strong>OneSight</strong> Determines the License Type ................................ 62<br />
Database Maintenance .......................................................................... 63<br />
Using a Remote Database .............................................................. 63<br />
Automatic Database Backup .......................................................... 65<br />
Manual Database Backup .............................................................. 66<br />
Transferring Configuration Data to Another Database .................. 66<br />
Updating Data Collectors and Remote Agents ..................................... 69<br />
Configuring the SNMP Agent .............................................................. 74<br />
C h a p t e r 3<br />
Getting Started 75<br />
Deciding Which Monitors to Use ......................................................... 77<br />
Tips On Using <strong>OneSight</strong> ...................................................................... 79<br />
Shutting Down and Restarting <strong>OneSight</strong> ....................................... 79<br />
Opening the <strong>OneSight</strong> Console From a Remote Machine ............. 79<br />
Modifying <strong>OneSight</strong> Profiles ......................................................... 80<br />
Finding System Information .......................................................... 80<br />
Interpreting Status and Report Information ................................... 80<br />
Database Backup ............................................................................ 81<br />
Contents<br />
v
Contents<br />
Tuning <strong>OneSight</strong> .................................................................................. 81<br />
Modifying a Profile ........................................................................ 82<br />
C h a p t e r 4<br />
Configuring Monitor Groups 85<br />
Adding a Monitor Group ...................................................................... 86<br />
Modifying a Monitor Group ................................................................. 90<br />
Specifying the Status Chart Data Source .............................................. 96<br />
Specifying Action Plans ....................................................................... 98<br />
Specifying Alert Dependencies ............................................................ 99<br />
Defining Action Plan Alerts ......................................................... 102<br />
Adding Dependency Nodes ......................................................... 103<br />
Adding a Smartlink to a Monitor Group ............................................ 104<br />
Applying Downtime to a Monitor Group ........................................... 106<br />
Enabling/Disabling a Monitor Group ................................................. 107<br />
Removing a Monitor Group ............................................................... 108<br />
Adding Monitors to a Monitor Group ................................................ 109<br />
C h a p t e r 5<br />
Configuring Monitors 113<br />
Authentication .................................................................................... 115<br />
Monitor Naming ................................................................................. 115<br />
Configuring the VQ Inspector Monitor for the Avaya Communication<br />
Manager .............................................................................................. 116<br />
Configuring the Avaya Communication Manager ....................... 116<br />
Configuring the Monitor in <strong>OneSight</strong> .......................................... 123<br />
Configuring the Cisco Call Manager Profile Monitor ........................ 129<br />
Configuring the OSDC.properties File ........................................ 129<br />
Configuring the Cisco Call Manager ........................................... 130<br />
Configuring FTP ................................................................... 130<br />
Configuring SNMP V1 or V2c .............................................. 133<br />
Configuring SNMP V3 .......................................................... 141<br />
Configuring the Monitor in <strong>OneSight</strong> .......................................... 147<br />
Configuring the IDMC Profile Monitor ............................................. 151<br />
Configuring <strong>OneSight</strong> Compound Metric Monitors .......................... 153<br />
<strong>OneSight</strong> Compound Metric Operators ....................................... 160<br />
<strong>OneSight</strong> Compound Metric Examples ....................................... 164<br />
vi<br />
<strong>OneSight</strong> <strong>Administrator</strong> <strong>Guide</strong>
Contents<br />
Configuring Database Monitors ......................................................... 167<br />
Database Monitor JDBC Driver Options ..................................... 168<br />
Creating a Database Monitor ....................................................... 169<br />
Setting Up Oracle ODBC for <strong>OneSight</strong> ....................................... 176<br />
Setting Up DataDirect JDBC Driver for <strong>OneSight</strong> ...................... 177<br />
SQL Server Configuration ..................................................... 177<br />
Data Collector Configuration ................................................ 178<br />
Monitoring Multiple Rows in a Database .................................... 179<br />
Configuring DNS Monitors ................................................................ 181<br />
Configuring Gomez GPN Monitors ................................................... 186<br />
To Specify Proxy Server Settings ................................................ 190<br />
Configuring Gomez GPN Profile Monitors ....................................... 191<br />
To Specify Proxy Server Settings ................................................ 195<br />
Configuring <strong>OneSight</strong> Call Statistics Profile Monitors ...................... 196<br />
Configuring <strong>OneSight</strong> Probe Monitors .............................................. 201<br />
Configuring <strong>OneSight</strong> Voice Transaction Profile Monitors ............... 205<br />
Configuring JMX Monitors ................................................................ 215<br />
Configuring Advanced Settings ................................................... 223<br />
Configuring <strong>OneSight</strong> Voice Watch Monitors ................................... 225<br />
Specifying Proxy Server Settings ................................................ 230<br />
Configuring <strong>OneSight</strong> Voice Watch Profile Monitors ....................... 231<br />
Specifying Proxy Server Settings ................................................ 237<br />
Configuring Event Log Monitors ....................................................... 238<br />
Configuring FTP Monitors ................................................................. 245<br />
Configuring Advanced Options ................................................... 251<br />
Configuring LDAP Monitors ............................................................. 252<br />
Configuring Log File, Directory Monitors ......................................... 256<br />
Configuring Mail Monitors ................................................................ 264<br />
Validating E-Mail Connections ................................................... 271<br />
Configuring Oracle OpenScript Profile Monitors .............................. 272<br />
Exporting Scripts ......................................................................... 279<br />
Setting Command Line Options ................................................... 280<br />
Specifying Proxy Settings ............................................................ 281<br />
Configuring Oracle Test for Web Applications Monitors .................. 282<br />
Exporting Scripts ......................................................................... 291<br />
Specifying Authentication Data ................................................... 292<br />
Configuring Perfmon Monitors .......................................................... 293<br />
Monitoring Multiple Processes With the Same Name ................. 293<br />
Contents<br />
vii
Contents<br />
Creating the Monitor .................................................................... 294<br />
Configuring Ping Monitors ................................................................ 302<br />
Configuring Port Monitors ................................................................. 306<br />
Setting Advanced Options ........................................................... 312<br />
Configuring Process Monitors ............................................................ 313<br />
Configuring Service Monitors ............................................................ 318<br />
Configuring SNMP Monitors ............................................................. 323<br />
Configuring SNMP Trap Monitors .................................................... 332<br />
Configuring TCP/IP Socket Monitors ................................................ 338<br />
Configuring URL Monitors ................................................................ 344<br />
Specifying Advanced Settings ..................................................... 352<br />
Specifying Proxy Settings ............................................................ 355<br />
Configuring <strong>OneSight</strong> Virtual Agent Monitors .................................. 356<br />
Configuring State Machines ........................................................ 365<br />
The State Machine ................................................................. 368<br />
XML Format .......................................................................... 369<br />
Example ................................................................................. 370<br />
Configuring <strong>OneSight</strong> Voice Quality - Basic Profile Monitors ......... 371<br />
Configuring <strong>OneSight</strong> Voice Quality - Advanced Profile Monitors .. 376<br />
Configuring WMI Monitors ............................................................... 387<br />
Sample Every Settings ........................................................................ 395<br />
Advanced Sample Frequency Settings ......................................... 397<br />
Exporting and Importing Monitors ..................................................... 398<br />
Exporting Monitors ...................................................................... 399<br />
Importing Monitors ...................................................................... 400<br />
Configuring a Profile Monitor ............................................................ 401<br />
What You Need to Know About Your System ............................ 402<br />
Applying a Profile to Multiple Systems ....................................... 413<br />
Using Regular Expressions for Pattern Matching .............................. 415<br />
Defining Expressions for Good Strings and Bad Strings ............. 416<br />
Defining Expressions for Metric Performance Data Using the Log<br />
File Monitor ................................................................................. 416<br />
Defining Expressions for Metric Performance Data using the<br />
<strong>OneSight</strong> Virtual Agent Monitor ................................................. 417<br />
Adding Alerts to a Monitor ................................................................ 419<br />
Configuring Monitors Alerts Tab ................................................ 419<br />
Setting Up an Alert to Trigger an Action Plan ................................... 422<br />
The Alert Editor ........................................................................... 425<br />
viii<br />
<strong>OneSight</strong> <strong>Administrator</strong> <strong>Guide</strong>
Contents<br />
General Tab Main Settings .................................................... 425<br />
Sample Failure and Crossed Threshold settings .................... 435<br />
Notes Tab Settings ................................................................. 439<br />
Alert Editor Log Profile Metrics .................................................. 439<br />
Logfile Settings ..................................................................... 439<br />
NT Event Log Settings .......................................................... 440<br />
SNMP Trap Settings .............................................................. 441<br />
Example SNMP Trap Message ............................................. 442<br />
Triggering an E-mail Action Plan ................................................ 443<br />
Creating a Threshold-based Alert ................................................ 444<br />
Editing a Response to an Alert – Dedicated Monitor ......................... 447<br />
Editing a Response to an Alert – Profile Metric ................................. 449<br />
Displaying the Windows Event Viewer ............................................. 451<br />
Configuring the Location From Which the Monitor Will Sample ..... 452<br />
Adding a SmartLink to a Monitor ...................................................... 453<br />
Configure Monitor Attributes Tab...................................................... 457<br />
Configure Monitor Groups Tab .......................................................... 461<br />
Access Control Tab ............................................................................ 462<br />
Applying Downtime to a Monitor ...................................................... 463<br />
Modifying Monitors ........................................................................... 464<br />
Dedicated Monitors ...................................................................... 464<br />
Profile Monitors ........................................................................... 464<br />
Managing Non-operational Profile Metrics ........................... 465<br />
Enabling/Disabling Monitoring of a System Component ..... 466<br />
Testing a Dedicated Monitor .............................................................. 467<br />
Enabling/Disabling a Monitor ............................................................ 471<br />
Removing a Monitor .......................................................................... 472<br />
Modifying Alerts for Multiple Monitors ............................................ 472<br />
Adding Alerts to Multiple Monitors ............................................ 472<br />
Changing Alert Thresholds for Multiple Alerts ........................... 475<br />
Deleting Alerts From Multiple Monitors ..................................... 479<br />
Modifying the Location of Multiple Monitors ................................... 481<br />
Adding Multiple Dedicated Monitors ................................................ 486<br />
Globally Changing Proxy Settings ..................................................... 487<br />
C h a p t e r 6<br />
Using Profiles 489<br />
The Profile Manager ........................................................................... 492<br />
Contents<br />
ix
Contents<br />
Adding, Cloning, and Modifying Profiles ................................... 493<br />
Entering a Profile’s Main Settings ........................................ 494<br />
Adding/Removing Metrics From a Profile ............................ 498<br />
Removing Profiles ....................................................................... 500<br />
Importing Profiles ........................................................................ 500<br />
Exporting Profiles ........................................................................ 504<br />
Global Metric Manager ...................................................................... 504<br />
Adding/Cloning/Modifying Metrics ............................................ 505<br />
General Tab Settings .................................................................... 511<br />
Data Sources Tab Settings ........................................................... 518<br />
Attributes Tab Settings ................................................................ 518<br />
Access Control Tab Settings ........................................................ 521<br />
Adding a Data Source .................................................................. 522<br />
JDBC Dialog Box .................................................................. 524<br />
JMX Dialog Box ................................................................... 526<br />
Log File, Directory Dialog Box ............................................ 527<br />
NT Event Log Dialog Box .................................................... 532<br />
Perfmon Dialog Box .............................................................. 535<br />
Ping Dialog Box .................................................................... 537<br />
Port Dialog Box ..................................................................... 538<br />
Process Dialog Box ............................................................... 539<br />
Service Dialog Box ............................................................... 540<br />
SNMP Dialog Box................................................................. 542<br />
SNMP Trap Dialog Box ........................................................ 546<br />
Socket Dialog Box................................................................. 548<br />
UNIX System Dialog Box ..................................................... 551<br />
URL Dialog Box ................................................................... 554<br />
Virtual Agent Dialog Box ..................................................... 557<br />
WMI System Dialog Box ...................................................... 561<br />
Setting a Metric’s Sampling Interval ........................................... 562<br />
Removing Metrics ........................................................................ 563<br />
Modifying a Metric’s Data Source ..................................................... 564<br />
C h a p t e r 7<br />
Configuring Systems 565<br />
Adding Systems .................................................................................. 565<br />
Adding Multiple Systems ................................................................... 571<br />
Adding a New Component Type ........................................................ 575<br />
x<br />
<strong>OneSight</strong> <strong>Administrator</strong> <strong>Guide</strong>
Contents<br />
Modifying System Definitions ........................................................... 577<br />
CPU System Information ............................................................. 577<br />
Database System Information ...................................................... 579<br />
Oracle Database System Information .................................... 579<br />
SQL Database System Information ....................................... 582<br />
Database Instance System Information ........................................ 586<br />
Database Log File System Information ....................................... 586<br />
Disk System Information ............................................................. 586<br />
File System Information .............................................................. 589<br />
Interface System Information....................................................... 590<br />
Load Balancer System Information ............................................. 592<br />
Service System Information ......................................................... 593<br />
System Properties Information .................................................... 594<br />
Port System Information .............................................................. 600<br />
Process System Information ........................................................ 601<br />
VM System Information .............................................................. 604<br />
VMProcess System Information .................................................. 605<br />
Web Server System Information .................................................. 606<br />
Adding System Components .............................................................. 608<br />
Adding Components Manually .................................................... 609<br />
Adding Components Automatically ............................................ 612<br />
Discovering Multiple Systems ..................................................... 623<br />
Modifying the Location of Multiple Systems .............................. 625<br />
Modifying System Components .................................................. 627<br />
Removing System Components ................................................... 627<br />
Changing Passwords ........................................................................... 628<br />
System Passwords ........................................................................ 628<br />
Visual Script Passwords ............................................................... 629<br />
URL Script Passwords ................................................................. 631<br />
Virtual Agent Passwords .............................................................. 631<br />
C h a p t e r 8<br />
Creating Action Plans 633<br />
Creating a New Action Plan ............................................................... 635<br />
Adding Actions to the Plan ................................................................ 638<br />
Configuring Global Action Options ................................................... 644<br />
Triggering An Email Action ........................................................ 645<br />
Replying to an E-mail Alert .................................................. 651<br />
Contents<br />
xi
Contents<br />
Validating Email Connections ............................................... 653<br />
Adding/Modifying Message Templates ....................................... 654<br />
Adding a New Alert Message Template ................................ 655<br />
Modifying an Alert Message Template ................................. 657<br />
Message Template Variables ................................................. 658<br />
Triggering a Scripting Action ...................................................... 663<br />
Triggering an SNMP Action ........................................................ 668<br />
Triggering an SNMP Set Action .................................................. 675<br />
Triggering a Delay Action ........................................................... 680<br />
Triggering a Monitor Action ........................................................ 683<br />
Triggering a Socket Connection Action ...................................... 686<br />
Triggering a HTTP Post/Get Action ............................................ 690<br />
Triggering a Syslog Action .......................................................... 694<br />
Configuring Global Action Options ................................................... 698<br />
Configuring Global Email Actions .............................................. 700<br />
Configuring the Mail Server ........................................................ 704<br />
Configuring Global Incoming E-Mail Options ............................ 705<br />
Configuring Global Scripting Options ......................................... 706<br />
Modifying An Action Plan ................................................................. 707<br />
Modifying an Email Action ......................................................... 708<br />
Modifying a Scripting Action ...................................................... 710<br />
Modifying an SNMP Action ........................................................ 711<br />
Modifying an SNMP Set Action .................................................. 713<br />
Modifying a Delay Action ........................................................... 714<br />
Modifying a Monitor Action ........................................................ 715<br />
Modifying a Socket Connection Action ...................................... 717<br />
Modifying an HTTP Post/Get Action .......................................... 718<br />
Modifying a Syslog Action .......................................................... 719<br />
Retiring an Action Plan ...................................................................... 720<br />
Action Plans Not Associated With an Alert ....................................... 720<br />
C h a p t e r 9<br />
Configuring Downtime 723<br />
Items Available for Downtime Scheduling ........................................ 723<br />
Scheduling Downtime by Monitor ............................................... 725<br />
Scheduling Downtime by System ................................................ 729<br />
Scheduling Downtime by Downtime ........................................... 730<br />
Putting a Monitor Immediately Into Downtime ................................. 733<br />
xii<br />
<strong>OneSight</strong> <strong>Administrator</strong> <strong>Guide</strong>
Contents<br />
C h a p t e r 1 0<br />
Configuring Attributes and Views 735<br />
Configuring Attributes ....................................................................... 735<br />
Adding Attributes Sets and Values .............................................. 735<br />
Removing Attributes Sets and Values ......................................... 740<br />
Assigning Attributes to Objects .......................................................... 741<br />
Configuring Saved Status Groupings ................................................. 742<br />
Adding a Saved Status Grouping ................................................. 742<br />
Modifying a Saved Status Grouping ............................................ 746<br />
Deleting a Saved Status Grouping ............................................... 746<br />
Configuring Attribute Matrix Views .................................................. 747<br />
Adding Attribute Matrix Views ................................................... 748<br />
Modifying Attribute Matrix Views .............................................. 751<br />
Deleting Attribute Matrix Views ................................................. 753<br />
Configuring Custom Status Views ..................................................... 753<br />
Adding a Custom Status View ..................................................... 754<br />
Creating Custom Status View Items ............................................ 758<br />
Creating a Report Item .......................................................... 758<br />
Creating a Monitor Group or Monitor Item .......................... 760<br />
Creating a Text Item .............................................................. 765<br />
Creating an Image Item ......................................................... 767<br />
Creating a Area Item ............................................................. 770<br />
Creating a Frame Item ........................................................... 772<br />
Modifying Items .................................................................... 774<br />
Deleting Items ....................................................................... 774<br />
Modifying a Custom Status View ................................................ 774<br />
Deleting a Custom Status View ................................................... 775<br />
Custom Status View Example ...................................................... 775<br />
C h a p t e r 1 1<br />
Configuring Database Storage and Locations 795<br />
Specifying When to Delete Database Records ................................... 795<br />
Configuring Locations ........................................................................ 798<br />
Modifying Locations .................................................................... 801<br />
Adding Location Groups ............................................................. 802<br />
Removing Location Groups .................................................. 803<br />
Contents<br />
xiii
Contents<br />
C h a p t e r 1 2<br />
Configuring Users 805<br />
xiv<br />
Configuring Roles .............................................................................. 805<br />
Configuration Rights Tab ............................................................ 808<br />
Alerts Rights ................................................................................ 810<br />
Reporting Rights .......................................................................... 811<br />
Status Rights ................................................................................ 812<br />
Access Control ............................................................................. 813<br />
Deleting Roles .............................................................................. 813<br />
Configuring User Groups ................................................................... 814<br />
Removing User Groups ................................................................ 818<br />
Adding New Users ............................................................................. 819<br />
Modifying User Settings .................................................................... 821<br />
Editing User Rights ...................................................................... 823<br />
Configuring Global Options ............................................................... 824<br />
C h a p t e r 1 3<br />
Configuring Service Level Agreements 827<br />
Creating SLAs .................................................................................... 829<br />
Creating SLOs .................................................................................... 833<br />
Updating SLAs ................................................................................... 840<br />
Deleting SLAs .............................................................................. 841<br />
Updating SLOs ................................................................................... 842<br />
Deleting SLOs .............................................................................. 844<br />
Configuring Date Intervals ................................................................. 844<br />
Adding Date Intervals .................................................................. 844<br />
Modifying Date Intervals ............................................................. 847<br />
Deleting Date Intervals ................................................................ 847<br />
C h a p t e r 1 4<br />
Configuring Custom Reports 849<br />
Creating Reports Using Report Templates ......................................... 849<br />
Running a Report Templates Report .................................................. 850<br />
<strong>OneSight</strong> Report Templates Example Report .............................. 851<br />
Report Templates Properties File ....................................................... 851<br />
Editing the Report Templates Properties File .............................. 852<br />
About Custom Report Data Sources ............................................ 852<br />
<strong>OneSight</strong> <strong>Administrator</strong> <strong>Guide</strong>
Contents<br />
Contents<br />
Passing Arguments to a SQL Query ............................................ 853<br />
Creating a Gauge Report .................................................................... 853<br />
Post-Processing of SQL results using Java ........................................ 854<br />
Implementation Notes/Caveats ........................................................... 856<br />
Report Templates Configuration File ................................................. 857<br />
C h a p t e r 1 5<br />
Configuring Time Intervals 863<br />
Creating New Time Intervals ............................................................. 863<br />
Changing Time Intervals .................................................................... 866<br />
Deleting Time Intervals ...................................................................... 867<br />
C h a p t e r 1 6<br />
Configuring VQ Probes 869<br />
VQ Probe Self Monitors .............................................................. 870<br />
Editing VQ Probes .............................................................................. 871<br />
Configuring a VQ Probe .............................................................. 871<br />
Configuring a VQ Probe on a G5 or FX/TDM System ............... 880<br />
Changing or Adding IP Addresses ............................................... 883<br />
Codec Comparison Chart ............................................................. 884<br />
Deleting VQ Probes ............................................................................ 884<br />
Editing Dial Numbers ......................................................................... 885<br />
C h a p t e r 1 7<br />
Configuring XMS Systems 887<br />
Adding XMS Systems ........................................................................ 887<br />
Modifying XMS Systems ................................................................... 891<br />
Deleting XMS Systems ...................................................................... 892<br />
Viewing Call Data Records ................................................................ 893<br />
C h a p t e r 1 8<br />
<strong>OneSight</strong> Utilities 895<br />
Trace Route ........................................................................................ 895<br />
Regular Expressions ........................................................................... 896<br />
MIB Browser ...................................................................................... 898<br />
Creating Metrics........................................................................... 901<br />
Support and Diagnostics ..................................................................... 903<br />
xv
Contents<br />
C h a p t e r 1 9<br />
Troubleshooting 905<br />
Viewing Administration Notifications ............................................... 905<br />
Troubleshooting Setup ....................................................................... 906<br />
Out of Disk Space ........................................................................ 906<br />
Moving the <strong>OneSight</strong> Database to a Remote SQL Server ........... 907<br />
Database Installation or Connection Errors ................................. 910<br />
Installing <strong>OneSight</strong> Using Windows Terminal Services ............. 910<br />
Oracle Test for Web Applications Error Messages ............................ 910<br />
Transaction Errors Detected or Generated by Oracle Test for Web<br />
Applications Visual Scripts .......................................................... 911<br />
Errors Detected While Running Oracle Test for Web Applications<br />
Transaction Monitor .................................................................... 913<br />
RSWISERV Error codes returned by the Thin agent .................. 916<br />
HTTP Status Codes and the Win32 Internet API Constants ........ 918<br />
Thick Client Problems Using an Oracle Test for Web Applications<br />
Transaction Monitor ........................................................................... 918<br />
Critical State Error Messages ............................................................. 919<br />
C h a p t e r 2 0<br />
Glossary 923<br />
Index 933<br />
xvi<br />
<strong>OneSight</strong> <strong>Administrator</strong> <strong>Guide</strong>
Preface<br />
Preface<br />
About This <strong>Guide</strong><br />
Welcome to the <strong>OneSight</strong> <strong>Administrator</strong> <strong>Guide</strong>. This guide explains<br />
how to use the <strong>OneSight</strong> to monitor and manage the health of your<br />
e-business.<br />
This guide contains the following chapters:<br />
Chapter 1 – Introduction: provides an overview of the major features<br />
of <strong>OneSight</strong>.<br />
Chapter 2 – Installing <strong>OneSight</strong>: explains how to install the <strong>OneSight</strong><br />
server, client web browsers, and web components.<br />
Chapter 3 – Getting Started: provides information that is useful to<br />
know before you begin using <strong>OneSight</strong>.<br />
Chapter 4 – Configuring Monitor Groups: provides instructions for<br />
configuring and maintaining monitor groups.<br />
Chapter 5 – Configuring Monitors: provides instructions for<br />
configuring and maintaining monitors.<br />
Chapter 6 – Using Profiles: provides instructions for using profiles<br />
and for adding metrics to profiles.<br />
Chapter 7 – Configuring Systems: provides instructions for adding<br />
systems and system components to <strong>OneSight</strong>.<br />
Chapter 8 – Creating Action Plans: provides instructions for creating<br />
and using action plans.<br />
xvi<br />
<strong>OneSight</strong> <strong>Administrator</strong> <strong>Guide</strong>
Chapter 9 – Configuring Downtime: provides instructions for<br />
configuring downtime.<br />
Chapter 10 – Configuring Attributes: provides instructions for<br />
configuring attributes.<br />
Chapter 11 – Configuring Database Storage and Locations: provides<br />
instructions for specifying when to delete database records, and how<br />
the Data Collector should behave.<br />
Chapter 12 – Configuring Users: provides instructions for adding and<br />
modifying user settings.<br />
Chapter 13 – Configuring Service Level Agreements: provides<br />
instructions on creating Service Level Agreements and Service<br />
Level Objectives.<br />
Chapter 14 – Configuring Custom Reports – provides instructions for<br />
creating custom <strong>OneSight</strong> reports.<br />
Chapter 15 – Configuring Time Intervals: provides instructions for<br />
creating time intervals for use with Service Level Objectives and<br />
action plans.<br />
Chapter 16 – Configuring VQ Probes: provides instructions on<br />
configuring Voice Quality (VQ )Probes.<br />
Chapter 17 – Configuring XMS Systems: provides instructions for<br />
adding and configuring XMS systems.<br />
Chapter 18 – <strong>OneSight</strong> Utilities: provides description for the trace<br />
route, regular expression, MIB browser, and support utilities.<br />
Chapter 19 – Troubleshooting: provides troubleshooting information.<br />
Chapter 20 – Glossary: provides definitions for terms used in<br />
<strong>OneSight</strong>.<br />
xvii
Preface<br />
Related Documentation<br />
<strong>OneSight</strong> Manuals<br />
<strong>OneSight</strong> includes a complete set of pdf manuals and online help.<br />
<strong>OneSight</strong> includes the following manuals:<br />
<strong>OneSight</strong> Operator <strong>Guide</strong> – explains how to use <strong>OneSight</strong> to<br />
monitor and manage the health of your e-business.<br />
<strong>OneSight</strong> <strong>Administrator</strong> <strong>Guide</strong> – explains how setup, configure, and<br />
use <strong>OneSight</strong> to monitor and manage the health of your e-business.<br />
These documents require the Adobe ® Acrobat ® Reader, version<br />
4.x (or higher), to open and view the files. You can download the<br />
free Acrobat Reader from the Adobe Web site:<br />
http://www.adobe.com/products/acrobat/readstep2.html.<br />
Additional documentation may be included with other Empirix Inc.<br />
or third party products used with <strong>OneSight</strong>.<br />
xviii<br />
<strong>OneSight</strong> <strong>Administrator</strong> <strong>Guide</strong>
Conventions<br />
This guide uses the following typographical conventions to identify<br />
specific items:<br />
Convention<br />
Bold Sans Serif<br />
Sans Serif<br />
Fixed-Pitch type<br />
Arrow between menu options.<br />
Description<br />
Menu options and dialog box<br />
selections.<br />
File names and Visual Script<br />
nodes.<br />
Program code.<br />
Select each option in sequence.<br />
Using Help<br />
The <strong>OneSight</strong> Web Help System provides setup and usage<br />
information for the Empirix <strong>OneSight</strong>. This Web Help System is<br />
provided to help you use the Empirix <strong>OneSight</strong> with greater<br />
efficiency. While this documentation includes information for<br />
installing, configuring, and using this product, additional<br />
information may be available in the Knowledgebase section on the<br />
Empirix.com <strong>OneSight</strong> Support web page.<br />
You can access the Web Help System by clicking the Help buttons<br />
located in the Empirix <strong>OneSight</strong> Console. Clicking Help opens an<br />
additional instance of your web browser, from which you view<br />
configuration and usage documentation.<br />
As you navigate through the Help system, the topics you see in the<br />
main portion of the window automatically synchronize with the<br />
Table of Contents. If the topic you are reading does not appear to<br />
synchronize correctly, use the scroll bar in the Table of Contents to<br />
display more of the contents list.<br />
xix
Preface<br />
The following features are available using this help system:<br />
Table of Contents - Use the Table of Contents to navigate to the<br />
topics you want to view. Click the topic indicator adjacent to any<br />
topic to view additional documents relating to that topic.<br />
Search - Use the Search link to access a full-context search engine<br />
for the <strong>OneSight</strong> Web Help System. To use the search engine, click<br />
Search at the top of any Help page. In the search engine, enter a<br />
keyword into the text box and click Search. A list of topics is<br />
displayed.<br />
To view a topic from this list, select it and click Go. The document<br />
you selected appears in the main Help window. Click Clear to<br />
empty the list and begin a new search.<br />
Glossary - To view definitions for words and terms used in Empirix<br />
<strong>OneSight</strong>, click Glossary at the top of any Help page.<br />
Obtaining Technical Support<br />
If you have questions about <strong>OneSight</strong>, first look in this guide, the<br />
online Help, and the release notes delivered with the software.<br />
Technical Support can be accessed in the following ways:<br />
Tel. (781) 266-3202<br />
Online.<br />
Email<br />
www.empirix.com<br />
onesight-support@empirix.com<br />
If you have questions about the <strong>OneSight</strong>, first look in the online<br />
Help and the release notes delivered with the software.<br />
You can also check our Web site for the latest information about<br />
upgrades and other issues at http://www.empirix.com.<br />
xx<br />
<strong>OneSight</strong> <strong>Administrator</strong> <strong>Guide</strong>
If you wish to contact Empirix Web Test & Monitoring Support,<br />
please use the following contact numbers and email addresses:<br />
Tel.<br />
North America: (781) 266-3202 (8 a.m. to 8 p.m. EST)<br />
Europe: +44 (0) 1344 668080 (8:30 - 18:00 GMT)<br />
Japan: 81-(3)-3791-2336<br />
Fax. North America: (781) 266-3202<br />
Email<br />
North America: support@empirix.com<br />
Europe: europeansupport@empirix.com<br />
Asia/Pacific: webtest_asiasupport@empirix.com<br />
Key Requests: To request a software license key, please call (781)<br />
266-3200 or send your request via email to key@empirix.com.<br />
xxi
C h a p t e r 1<br />
Introduction<br />
Feature Highlights<br />
Empirix <strong>OneSight</strong> monitors and manages the health of your<br />
business by providing you with a comprehensive and flexible view<br />
of your mission-critical components.<br />
<strong>OneSight</strong> offers the following advantages for ensuring optimal<br />
performance of your contact center applications and for delivering<br />
the best possible quality of experience to your end users:<br />
Holistic View of Your Infrastructure – <strong>OneSight</strong> tracks the<br />
performance of your applications, monitoring user transactions<br />
and the operation of components such as servers and specialized<br />
technology such as CTI, PBX and voice portals, network devices,<br />
detecting changes that could jeopardize application performance.<br />
<strong>OneSight</strong> provides real-time data that you can use to avoid<br />
performance problems and rapidly react to problems when they<br />
occur.<br />
Realistic User Transactions – <strong>OneSight</strong> initiates actual user<br />
transactions for both web and voice interactions from multiple<br />
points of view. By performing end-to-end tests, it exercises all<br />
levels of multi-tier applications, detecting bottlenecks that other<br />
monitoring tools might miss.<br />
Flexible Alerting and Reporting – When thresholds are crossed,<br />
<strong>OneSight</strong> sends intelligent alerts to the appropriate individuals.<br />
Action plans can be configured to send immediate alerts, phone,<br />
email, or SNMP traps. In addition, <strong>OneSight</strong> can take corrective<br />
1
What <strong>OneSight</strong> Monitors<br />
action through an automated response such as a server reboot or<br />
application restart. Extensive reports and charts identify system<br />
weaknesses and allow you to isolate a current problem, report on<br />
uptime, response time, or availability, and spot trends that could<br />
affect future performance.<br />
Centralized Configuration – <strong>OneSight</strong> profiles are pre-built<br />
collections of configuration information designed to gather the<br />
most important metrics for a given component, application, or<br />
system. You can create your own profiles or modify the pre-built<br />
profiles for your unique needs.<br />
Scalable and Flexible Architecture – <strong>OneSight</strong> can handle<br />
customer contact environments of any size or complexity,<br />
whether they are hosted on one server or distributed across<br />
multiple servers, networks, or continents.<br />
What <strong>OneSight</strong> Monitors<br />
<strong>OneSight</strong> can monitor many components such as Database, DNS,<br />
JMX, etc. and comes with many pre-built dedicated and profile<br />
monitors as listed below.<br />
Dedicated Monitors<br />
Database<br />
DNS<br />
Event Log<br />
FTP<br />
Gomez GPN<br />
JMX<br />
Linux<br />
LDAP<br />
<strong>OneSight</strong> Virtual Agent<br />
<strong>OneSight</strong> Voice Transaction<br />
<strong>OneSight</strong> Voice Watch<br />
Perfmon<br />
Ping<br />
Port<br />
Process<br />
Service<br />
2 <strong>OneSight</strong> <strong>Administrator</strong> <strong>Guide</strong>
What <strong>OneSight</strong> Monitors<br />
Log File, Directory<br />
Mail<br />
Applications<br />
<strong>OneSight</strong> Call Statistics<br />
<strong>OneSight</strong> Probe<br />
Oracle OpenScript<br />
Oracle Test for Web<br />
Applications<br />
AIX<br />
Apache for Solaris<br />
ATG Dynamo<br />
BEA WebLogic<br />
CheckPoint Firewall<br />
ColdFusion Server<br />
Compaq PC Server<br />
DB2<br />
DELL PC Server<br />
HP-UX<br />
iPlanet Web Server for<br />
Windows<br />
SNMP<br />
SNMP Trap<br />
TCP/IP Socket<br />
URL availability and<br />
response time<br />
Voice Quality<br />
WMI<br />
Linux<br />
Microsoft Exchange<br />
Microsoft IIS<br />
Microsoft SQL Server<br />
Microsoft Transaction<br />
Server<br />
Microsoft Windows<br />
Netscape Enterprise Server<br />
Oracle Database<br />
RealSystem Server<br />
(Windows)<br />
Solaris<br />
VMWare<br />
Chapter 1: Introduction 3
System Requirements<br />
Network Devices<br />
Cisco Catalyst 4000, 5000,<br />
6000 Switch<br />
Cobalt RAQ 4<br />
Network Performance<br />
IP throughput<br />
F5 Big-IP Load Balancer<br />
RFC1213 Network Devices<br />
HTTP errors encountered<br />
HTTP transactions<br />
throughput<br />
Any other system elements via supported data<br />
sources.<br />
System Requirements<br />
There are three areas to keep in mind when you install <strong>OneSight</strong>:<br />
<strong>OneSight</strong> Server and Data Collector – the machine on which the<br />
majority of <strong>OneSight</strong> (the Console, database, and web server)<br />
software will be installed.<br />
Client Web Browser – a client machine with a network connection<br />
to the <strong>OneSight</strong> Server (and a supported Web browser) that you<br />
can use to view the <strong>OneSight</strong> Console.<br />
Web Components – the parts of your contact center that you want<br />
<strong>OneSight</strong> to monitor.<br />
4 <strong>OneSight</strong> <strong>Administrator</strong> <strong>Guide</strong>
System Requirements<br />
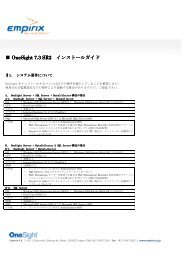
The following diagram shows these components.<br />
Client Web<br />
Browsers<br />
<strong>OneSight</strong><br />
Server<br />
Monitored<br />
Contact Center<br />
Components<br />
Web Server<br />
Client Web<br />
Browser<br />
Application Server<br />
Database Server<br />
There are two processes that collect data and send it to the<br />
<strong>OneSight</strong> server. They are the Data Collector and Remote Agent.<br />
By default, the Data Collector is installed on the <strong>OneSight</strong> Server,<br />
however, it is recommended that you install the Data Collector on<br />
another machine. Refer to “Installing the <strong>OneSight</strong> Data<br />
Collector/Remote Agent” later in this chapter.<br />
The system requirements for the <strong>OneSight</strong> Server, client Web<br />
browser, and Web components are listed in the sections below.<br />
<strong>OneSight</strong> Server and Data Collector Requirements<br />
<strong>OneSight</strong> should be installed on a separate machine from those you<br />
want to monitor. Ideally, the <strong>OneSight</strong> Server should be on the<br />
same side of the firewall as any monitored Web servers.<br />
The machine on which you install <strong>OneSight</strong> (the <strong>OneSight</strong> Server)<br />
should meet the following requirements:<br />
Dual 2 GHz processor (dual core)<br />
4 GB RAM or more recommended<br />
Chapter 1: Introduction 5
System Requirements<br />
Windows 2003/2008 Enterprise Server with Service Pack 2<br />
(recommended) or higher Server edition.<br />
Internet Explorer, version 7.0/8.0, or FireFox version 2.0/3.0<br />
2 x 100 GB with Raid 1 configuration available disk space,<br />
including 260 MB on the system drive<br />
The machine on which you install a Data Collector should meet the<br />
following requirements.<br />
Intel Xeon, Pentium 4 520 or Pentium M745 CPU<br />
2 GB RAM or more recommended<br />
Windows 2003/2008 Enterprise Server with Service Pack 2<br />
(recommended) or higher Server edition.<br />
60 GB for the Data Collectors<br />
Additional Requirements<br />
The <strong>OneSight</strong> server machine has the following additional<br />
requirements:<br />
Administrative rights on machines on which <strong>OneSight</strong> is installed<br />
Network connectivity between the <strong>OneSight</strong> Server, its client<br />
browsers, and the web site components it’s monitoring. Ideally, it<br />
should be on the same subnet (in other words, on the same side of<br />
the firewall) as any monitored web servers.<br />
<strong>OneSight</strong> should be on a separate machine from the monitored<br />
machines and systems.<br />
(Optional) Oracle OATS, version 9.1 if running Oracle Test for<br />
Web Application transactions. Contact Oracle for information on<br />
obtaining Oracle OATS.<br />
6 <strong>OneSight</strong> <strong>Administrator</strong> <strong>Guide</strong>
System Requirements<br />
Database Requirements<br />
The requirements for the database are the same as the <strong>OneSight</strong><br />
Server with the following exceptions:<br />
4 x 300 GB with Raid 1 Configuration minimum available disk<br />
space<br />
SQL Server 2005/2008 Standard and Enterprise editions<br />
including SQL Server named instances. (Express edition is not<br />
supported.)<br />
Client Web Browser Requirements<br />
PC Clients<br />
You can connect to the <strong>OneSight</strong> Server from a Windows PC or<br />
UNIX machine and view the <strong>OneSight</strong> Console using one of the<br />
following browsers:<br />
Recommended: Internet Explorer version 7.0<br />
Firefox, version 2.0 or version 3.0<br />
UNIX Clients<br />
Firefox, version 2.0 or version 3.0<br />
Notes About Web Browser Requirements<br />
Macromedia’s Flash Plug-in, version 5 or higher, must be<br />
installed on your machine to view report graphs. <strong>OneSight</strong><br />
reports use PopChart from CORDA Technologies with Flash to<br />
create the graphs.<br />
Javascript must be enabled in the browser for <strong>OneSight</strong> to<br />
operate.<br />
Popup blockers must be turned off for <strong>OneSight</strong> to operate.<br />
Following is a list of browsers and popup blockers with<br />
Chapter 1: Introduction 7
System Requirements<br />
instructions for turning them off or accessing their help for<br />
instructions.<br />
Firefox – Select Options from the Tools menu. Uncheck Block<br />
Popup Windows.<br />
Internet Explorer – Select Pop-up Blocker from the Tools menu. If<br />
the pop-up blocker is on, select Turn Off Pop-up Blocker.<br />
Google – Refer to http://toolbar.google.com/popup_help.html.<br />
Yahoo – Refer to http://help.yahoo.com/help/us/toolbar/pub/index.html.<br />
A client screen resolution of 1280x1024 or larger is<br />
recommended for optimal viewing.<br />
Contact Center Component Requirements<br />
Contact center components are the parts of your customer service<br />
environment that you want <strong>OneSight</strong> to monitor. <strong>OneSight</strong> can<br />
monitor many types of components, including CPUs, URLs,<br />
databases, and web servers, etc., from a large set of customer<br />
contact center specific equipment.<br />
Monitors for Web components are configured using the <strong>OneSight</strong><br />
interface to enter details such as URLs, user names, and passwords.<br />
Some web components, however, may require extra configuration<br />
outside of <strong>OneSight</strong>, because of either their location or the data<br />
sources <strong>OneSight</strong> relies on.<br />
In some situations, installing the <strong>OneSight</strong> Data Collector or<br />
Remote Agent may be the best way to receive information about a<br />
web component. The <strong>OneSight</strong> Data Collector or Remote Agent can<br />
collect information more efficiently than some data sources, plus<br />
they have the ability to run remote scripts to correct problems.<br />
Installing the Data Collector or Remote Agent is a separate process<br />
from <strong>OneSight</strong> Setup and is optional.<br />
8 <strong>OneSight</strong> <strong>Administrator</strong> <strong>Guide</strong>
System Requirements<br />
The evaluation procedures included in this document do not require<br />
additional component configuration, but if you wish to evaluate<br />
other components, refer to Configuring Web Components in<br />
Chapter 2. This section also lists web components that may require<br />
some extra configuration for <strong>OneSight</strong> to monitor them. For the full<br />
list of what <strong>OneSight</strong> supports, refer to What <strong>OneSight</strong> Monitors in<br />
this chapter.<br />
Note: If the monitored web component is on the other side of a<br />
firewall, non-transparent controller (such as F5’s BIG-IP), router, or<br />
switch, you may need to do some extra configuration (for example,<br />
enable a port on a firewall) to allow data to pass from the monitored<br />
web component to the <strong>OneSight</strong> server.<br />
Chapter 1: Introduction 9
System Requirements<br />
[This page intentionally left blank.]<br />
10 <strong>OneSight</strong> <strong>Administrator</strong> <strong>Guide</strong>
C h a p t e r 2<br />
Installing <strong>OneSight</strong><br />
This chapter explains how to install <strong>OneSight</strong>, start and stop the<br />
<strong>OneSight</strong> service, view version and database information, perform<br />
database maintenance, and remove <strong>OneSight</strong>.<br />
What <strong>OneSight</strong> Installs<br />
Third-Party Software<br />
<strong>OneSight</strong> installs onto the Windows machine that you designate as<br />
the <strong>OneSight</strong> Server. During installation, the following third-party<br />
software components are installed:<br />
Corda’s PopChart for reports<br />
i-net’s SPRINTA JDBC driver, version 2000<br />
In addition, we supply installation files for Macromedia’s Flash 8.0<br />
for reports. The installation files are located in the flash directory of<br />
the server installation directory. The file names are as follows:<br />
IE Browsers – install_flash_player_active_x.msi<br />
Macintosh Browsers – install_flash_player_osx.dmg<br />
Non-IE Plug-in based Browsers – install_flash_player_plugin.msi<br />
Windows uninstall for all versions – uninstall_flash_player.exe<br />
11
Installing <strong>OneSight</strong><br />
Services<br />
The following services should be up and running when the<br />
installation is complete:<br />
Empirix <strong>OneSight</strong> on the Server machine. The process is<br />
OSServer.exe.<br />
Empirix <strong>OneSight</strong> Data Collector for each Data Collector<br />
installed either on the Server or monitored machines. There are<br />
two processes: AHP.exe and OSDC.exe.<br />
Empirix <strong>OneSight</strong> NT Remote Agent on the monitored machine.<br />
The process is AHP.exe.<br />
Empirix <strong>OneSight</strong> PopChart on the Server machine. The process<br />
is OSChart.exe.<br />
Installing <strong>OneSight</strong><br />
Before you install Empirix <strong>OneSight</strong>, refer to the <strong>OneSight</strong> system<br />
requirements. If you are upgrading <strong>OneSight</strong>, close the <strong>OneSight</strong><br />
Console before you run <strong>OneSight</strong> Setup. The <strong>OneSight</strong> setup will<br />
uninstall the existing version, then stop. Rerun <strong>OneSight</strong> Setup to<br />
continue.<br />
Otherwise, the installation procedure is the same for both an initial<br />
install and an upgrade. Upgrading does not require that you remove<br />
the existing <strong>OneSight</strong> version first. The machine does not need to<br />
be rebooted when the install is finished.<br />
Note: If you are installing <strong>OneSight</strong> on a new server and you are<br />
using a restored/existing database, use the same settings as the<br />
previous installation. If you are not sure of the settings, consult with<br />
Empirix support or professional services.<br />
The <strong>OneSight</strong> server and reports can connect to the database server<br />
through NTLM authentication using the jTDS driver. <strong>OneSight</strong> must<br />
12 <strong>OneSight</strong> <strong>Administrator</strong> <strong>Guide</strong>
Installing <strong>OneSight</strong><br />
run under a domain account with privileges to access the SQL<br />
server. In addition the OSServer.properties file must be changes as<br />
follows to enable a trusted connection:<br />
# use trusted connection, value: true/false<br />
# when a trusted connection is used, UserName but<br />
the current Windows login account will be used to<br />
connect to database<br />
Database.TrustedConnection = true<br />
1. Log on, with administrative privileges, to the Windows<br />
machine on which you’ll install <strong>OneSight</strong>. This machine will<br />
become the <strong>OneSight</strong> Server.<br />
2. Open Windows Explorer to the Empirix CD-ROM or the<br />
directory where you downloaded the <strong>OneSight</strong> file and doubleclick<br />
the <strong>OneSight</strong> .exe file.<br />
3. Click Next when the Welcome to <strong>OneSight</strong> Setup dialog box<br />
appears.<br />
4. If you are using a database that has been configured with an<br />
instance name, you may get the following message:<br />
Setup has identified evidence of a Microsoft SQL Server install but was<br />
unable to locate expected registry keys. This may indicate that only the<br />
Client Tools have been installed.<br />
You will then be asked to provide a path to osql.exe.<br />
For SQL 2005 and 2008: Mapping a network drive will not<br />
work. You must install SQL 2005 client tools on the<br />
<strong>OneSight</strong> server. Client tools can be installed from the SQL<br />
2005 installation by selecting the option to install client tools<br />
only.<br />
Navigate to its location. For example, C:\Program<br />
Files\Microsoft SQL Server\80\Tools\Binn.<br />
Click OK.<br />
Chapter 2: Installing <strong>OneSight</strong> 13
Installing <strong>OneSight</strong><br />
Click Next.<br />
5. Empirix <strong>OneSight</strong> can use a standard version of Microsoft SQL<br />
Server 2005 or Microsoft SQL Server 2008 for use as the<br />
<strong>OneSight</strong> production database.<br />
Note: The default password is blank when installing <strong>OneSight</strong><br />
with an SQL database.<br />
If you have a previous version of Empirix <strong>OneSight</strong>, you’ll be<br />
notified of the impact of the database upgrade to your existing<br />
<strong>OneSight</strong> configuration.<br />
Setup allows you to specify the location of the remote SQL<br />
Server or the drive on which to create database files, and<br />
reminds you to create Remote Folders for <strong>OneSight</strong>.<br />
If SQL Server is already installed on the <strong>OneSight</strong> Server:<br />
<strong>OneSight</strong> Setup will inform you that <strong>OneSight</strong> will use that<br />
installation as its database application. Click Next.<br />
6. Select I accept the License Agreement in the License Agreement<br />
dialog box and click Next.<br />
7. Select <strong>OneSight</strong> Server from the list of features to install and<br />
click Next.<br />
8. The SSL Configuration dialog box is displayed. Select either<br />
HTTP on port or HTTPS on port. The default port numbers are<br />
displayed for a new installation. The currently configured ports<br />
are displayed for an upgrade. If you change the port, the current<br />
configuration is overwritten.<br />
If you are using HTTPS you can optionally enter SSL certificate<br />
information. The certificate is created regardless of whether<br />
data is entered. The server name must be the DNS resolvable<br />
14 <strong>OneSight</strong> <strong>Administrator</strong> <strong>Guide</strong>
Installing <strong>OneSight</strong><br />
name of the <strong>OneSight</strong> server, not ―localhost‖ or an IP address,<br />
and it must match the name in the OSServer.properties file.<br />
The SSL Certificate Information is saved to the<br />
InstallationOptions.properties file. If you reinstall <strong>OneSight</strong>, the<br />
dialog box is populated with the information saved in this file.<br />
Note: If you change the information in the<br />
InstallationOptions.properties file, the changes do not go into<br />
effect until you reinstall <strong>OneSight</strong>.<br />
Note: If you are upgrading from a version prior to <strong>OneSight</strong><br />
version 8.0 that had SSL certificate information configured for<br />
HTTPS, that information will not be displayed in this dialog<br />
because prior to version 8.0 SSL certificate information was<br />
stored in a different file.<br />
9. Specify the drive and directory where you want <strong>OneSight</strong><br />
installed in the Destination Folder dialog box. If you have<br />
limited space on your system drive (C:), you can install<br />
<strong>OneSight</strong> on another drive.<br />
10. Click Next in the Start Installation dialog box. A few minutes<br />
will pass while <strong>OneSight</strong> Setup installs <strong>OneSight</strong>.<br />
11. If you are using a database configured with an instance name<br />
you will need to specify the database name and the location of<br />
various files:<br />
Enter the database instance name and password, if there is<br />
one, and click Next.<br />
Specify the database files folder by navigating to C:\Program<br />
Files\Microsoft SQL Server\MSSQL&\data and click<br />
OK. If you are installing <strong>OneSight</strong> on a different server than<br />
the SQL server, specify the actual path to the database files<br />
that are local to the SQL server. For example, C:\Program<br />
Files\Microsoft SQL Server\Data\… Click Next.<br />
Chapter 2: Installing <strong>OneSight</strong> 15
Installing <strong>OneSight</strong><br />
Specify the log file folder by navigating to C:\Program<br />
Files\Microsoft SQL Server\MSSQL&\log and click OK.<br />
Click Next.<br />
Specify the database backup folder by navigating to<br />
C:\Program Files\Microsoft SQL Server\MSSQL&\backup<br />
and click OK. Click Next.<br />
Note: <strong>OneSight</strong> does not support a configuration where two<br />
<strong>OneSight</strong> installations point to the same database.<br />
12. The database installation status screen displays while the<br />
database is installed.<br />
13. Before you can begin collecting metrics, a Data Collector must<br />
be installed. <strong>OneSight</strong> will prompt you to install a Data<br />
Collector on the <strong>OneSight</strong> server. Click Yes.<br />
Note: If the machine name of the <strong>OneSight</strong> Server contains an<br />
underscore (―_‖), you must change the host name in the Web<br />
section of the OSServer.properties file located in the<br />
Empirix/<strong>OneSight</strong>/properties folder to reference the IP address<br />
instead of the machine’s host name. Because of the way Internet<br />
Explorer handles cookies when the machine name contains an<br />
underscore, you may not be able to log in if you do not make<br />
this change.<br />
14. Click Finish in the final Setup dialog box, then review the<br />
<strong>OneSight</strong> ReadMe file while Empirix <strong>OneSight</strong> prepares its<br />
database and web server connections.<br />
15. Start <strong>OneSight</strong> by clicking Start, pointing to Programs, then<br />
Empirix <strong>OneSight</strong>, then clicking <strong>OneSight</strong> Logon.<br />
Note: If you run INITDB after an installation failure, check the<br />
Create UserID check box so that the Empirix <strong>Administrator</strong> account<br />
is created successfully.<br />
16 <strong>OneSight</strong> <strong>Administrator</strong> <strong>Guide</strong>
Installing <strong>OneSight</strong><br />
Configuring SQL 2005 and 2008<br />
Enabling Mixed Authentication Mode<br />
During the SQL installation, select Mixed Mode in the<br />
Authentication Mode dialog box.<br />
Turning on XP_CMDSHELL<br />
For SQL 2005 and 2008, XP_CMDSHELL must be turned on. Run<br />
the following query:<br />
EXECUTE sp_configure 'show advanced options', 1<br />
RECONFIGURE WITH OVERRIDE<br />
EXECUTE sp_configure 'xp_cmdshell', '1'<br />
RECONFIGURE WITH OVERRIDE<br />
EXECUTE sp_configure 'show advanced options', 0<br />
RECONFIGURE WITH OVERRIDE<br />
Chapter 2: Installing <strong>OneSight</strong> 17
Changing Session Timeout<br />
Changing Session Timeout<br />
The <strong>OneSight</strong> Server default session timeout is two hours. If you do<br />
not do anything for two hours after you log in, the server terminates<br />
your session. You can change the default session timeout by editing<br />
the following line in the web.xml file in the conf directory.<br />
120<br />
Changing the <strong>OneSight</strong> Server Default Port<br />
If you need to change the <strong>OneSight</strong> server default port, change the<br />
following line in the OSServer.properties file on the <strong>OneSight</strong> Server.<br />
Web.<strong>OneSight</strong>Server.Port = 8080<br />
Enabling SSL for the <strong>OneSight</strong> Server<br />
When you enable SSL for the <strong>OneSight</strong> server the default way to<br />
access the server becomes https://. The process for<br />
enabling SSL is located in the \empirix\onesight\support\howtohttps.txt<br />
file on the <strong>OneSight</strong> server.<br />
Updating Profiles After Upgrading <strong>OneSight</strong><br />
When you upgrade to a new version of <strong>OneSight</strong>, newer versions of<br />
profiles may be installed. Use this procedure to upgrade to the new<br />
profiles. If you have customized a profile but have not changed the<br />
name, this procedure replaces the profile. Profiles with altered<br />
names are not affected by this procedure.<br />
To save profiles before upgrading, select the profile in the Profile<br />
Manager and click Clone. A copy of the profile appears in the list.<br />
Note: A copy of the profile is saved in the profiles list; however,<br />
only the original version remains as an applied profile. To apply the<br />
18 <strong>OneSight</strong> <strong>Administrator</strong> <strong>Guide</strong>
Installing the <strong>OneSight</strong> Data Collector or Remote Agent<br />
cloned profile to a system, you must modify existing monitors or<br />
create new monitors.<br />
To upgrade to the newer profiles:<br />
1. Click Import in the Profile Manager.<br />
2. Select a profile to upgrade and click Import.<br />
3. Click Yes to upgrade each metric used by your current profile.<br />
Note: You may be asked to confirm an overwrite of your<br />
profile. Click Yes to All to upgrade all of the metrics for the<br />
selected profile.<br />
Installing the <strong>OneSight</strong> Data Collector or Remote<br />
Agent<br />
The <strong>OneSight</strong> Data Collectors and Remote Agents respond to<br />
requests from the <strong>OneSight</strong> Server to run scripts or submit data<br />
concerning the machine the agent is installed on. Installing the<br />
<strong>OneSight</strong> Data Collector or Remote Agent is a separate process<br />
from <strong>OneSight</strong> Server Setup.<br />
The <strong>OneSight</strong> Remote Agent can be installed in the following<br />
environments:<br />
PCs running Windows 2003/2008 Enterprise Server with Service<br />
Pack 2 or higher with 20 MB available disk space.<br />
UNIX workstations running Solaris version 9 or 10, SPARC<br />
platform only, Linux version 9 or higher, RedHat Enterprise<br />
version 5 with 20 MB of available disk space (once installed, the<br />
Remote Agent only needs 6 MB of available disk space).<br />
The <strong>OneSight</strong> Data Collector can be installed in the following<br />
environment:<br />
Chapter 2: Installing <strong>OneSight</strong> 19
Installing the <strong>OneSight</strong> Data Collector or Remote Agent<br />
PCs running Windows 2003/2008 Enterprise Server with Service<br />
Pack 2 or higher with 60 GB available disk space.<br />
For instructions on updating <strong>OneSight</strong> Data Collectors or Remote<br />
Agents remotely, refer to ―Updating Data Collectors or Remote<br />
Agents‖ later in this chapter.<br />
Data Collectors and Remote Agents<br />
A Data Collector is installed on a machine and collects data from<br />
the local machine as well as other remote machines. The Remote<br />
Agent is installed on a single machine and collects data from that<br />
machine. Both send the data back to the <strong>OneSight</strong> server.<br />
20 <strong>OneSight</strong> <strong>Administrator</strong> <strong>Guide</strong>
Installing the <strong>OneSight</strong> Data Collector or Remote Agent<br />
The following diagram illustrates the difference between these two<br />
processes:<br />
Remote Agent<br />
Machine<br />
Windows<br />
Machines<br />
Monitored by the<br />
Remote Data<br />
Collector<br />
Windows<br />
<strong>OneSight</strong><br />
Server<br />
Windows<br />
UNIX Variant<br />
Remote Data<br />
Collector Machine<br />
UNIX Variant<br />
Windows<br />
If you only install a Remote Agent, you can only use the following<br />
mechanisms to monitor Windows :<br />
Logfile<br />
Process Monitor<br />
NTEventLog<br />
NTService<br />
Perfmon<br />
Script<br />
Chapter 2: Installing <strong>OneSight</strong> 21
Installing the <strong>OneSight</strong> Data Collector or Remote Agent<br />
The Java component of the Data Collector has the following<br />
additional mechanisms:<br />
Database<br />
DNS<br />
FTP<br />
Mail<br />
URL<br />
Ping<br />
Port<br />
SNMP<br />
SNMP Trap<br />
Oracle Test for Web<br />
Applications<br />
Empirix FarSight<br />
ComPlus<br />
Virtual Agent<br />
<strong>OneSight</strong> Voice Transaction<br />
Empirix Voice Watch<br />
Should I Install the Data Collector or Remote Agent?<br />
You should decide whether or not to install the Data Collector or<br />
Remote Agent based on the following:<br />
Discovering components without specifying authentication<br />
information: To discover components or services on a system, you<br />
must provide more detailed authentication information when no<br />
<strong>OneSight</strong> Data Collector or Remote Agent is present on the<br />
monitored systems.<br />
Security: Receiving data from machines outside your firewall can be<br />
tricky from a security viewpoint. For example, to receive Perfmon<br />
data through a firewall, you might need to enable the firewall’s<br />
DCOM port. While doing this may give you valuable performance<br />
information, it may also make your firewall more vulnerable to<br />
security attacks.<br />
Automation: With the <strong>OneSight</strong> Data Collector or Remote Agent,<br />
you can run scripts to automate tasks or take corrective action. For<br />
22 <strong>OneSight</strong> <strong>Administrator</strong> <strong>Guide</strong>
Installing the <strong>OneSight</strong> Data Collector or Remote Agent<br />
example, a <strong>OneSight</strong> Data Collector or Remote Agent on your web<br />
server could automatically run a script that would restart your web<br />
server if it were to shut down.<br />
Logging: If you want to look at logging information for an operating<br />
system or a web server, the Data Collector or Remote Agent is<br />
required. In addition, the profile associated with the Apache<br />
monitor requires the Remote Agent in order to use information from<br />
the Apache log file.<br />
Performance: While enabling some data sources, such as Perfmon,<br />
on the machines you’re monitoring can provide you with important<br />
data, it may also generate more network traffic than is necessary.<br />
The <strong>OneSight</strong> Data Collector or Remote Agent can collect the data<br />
you need while generating fewer network packets.<br />
Note: The Linux Remote Agent does not do discovery. Use the<br />
virtual agent to discover Linux objects. The Linux Remote Agents<br />
supports Process, and Log File monitors and can be used to run<br />
remote shell scripts.<br />
Remote Agent Installation Requirements<br />
You can install the <strong>OneSight</strong> Remote Agent in the following<br />
environments:<br />
PCs running Windows<br />
The machine must have at least 20 MB of available disk space.<br />
To install the <strong>OneSight</strong> Remote Agent, you must log on with<br />
administrative rights.<br />
UNIX, Linux, RedHat, or Solaris Workstations (SPARC platform<br />
only)<br />
The machine must have at least 20 MB of available disk space (once<br />
installed, the Remote Agent only needs 6 MB disk space).<br />
Chapter 2: Installing <strong>OneSight</strong> 23
Installing the <strong>OneSight</strong> Data Collector or Remote Agent<br />
To install the <strong>OneSight</strong> Remote Agent, you must log on with<br />
super-user rights (root access).<br />
Note: For Linux systems, GNU C++ Runtime Library 3.4<br />
(libstdc++-3.4) or later is required. You can check that by shell<br />
command rpm -qa | grep stdc++. If not installed, the message,<br />
―error while loading shared libraries: libstdc++.so.6,‖ may be<br />
encountered when starting the Agent. Contact your administrator to<br />
install or update.<br />
Installing the Remote Agent on Windows<br />
Before you install the <strong>OneSight</strong> Remote Agent, see the <strong>OneSight</strong><br />
Remote Agent requirements. To install the <strong>OneSight</strong> Remote Agent<br />
on a Windows machine, you will need to do two things:<br />
Install the Remote Agent<br />
Identify the Remote Agent machine to the <strong>OneSight</strong> Server<br />
You can use an initialization file (winnt_agent_setup.ini) as a shortcut<br />
for installing the Remote Agent on multiple machines.<br />
Note: If you are installing the Remote Agent to monitor disk<br />
performance on a Windows machine, Diskperf -yv must be<br />
enabled on that machine.<br />
To install the Remote Agent:<br />
1. Copy winnt_agent_setup.exe from the<br />
Empirix\<strong>OneSight</strong>\Setup\RemoteAgents folder on the <strong>OneSight</strong><br />
Server to the machine where you want to install the <strong>OneSight</strong><br />
Remote Agent. The Remote Agent cannot be installed on the<br />
<strong>OneSight</strong> Server. If the <strong>OneSight</strong> server software is detected,<br />
the setup program for the Remote Agent will not continue.<br />
2. Log on, with administrative privileges, to the Windows<br />
machine where you want to install the Remote Agent. If the<br />
24 <strong>OneSight</strong> <strong>Administrator</strong> <strong>Guide</strong>
Installing the <strong>OneSight</strong> Data Collector or Remote Agent<br />
currently logged-on user does not have appropriate privileges,<br />
you will see an error message.<br />
3. Using Windows Explorer, double-click winnt_agent_setup.exe.<br />
4. After a few moments, the Welcome to <strong>OneSight</strong> Remote Agent<br />
Setup dialog box appears. Click Next.<br />
5. Read the license agreement and click Accept.<br />
6. In the Destination Folder dialog box, select where the Remote<br />
Agent files should be installed. Click Next.<br />
7. It is recommended that you leave Enable Remote Update enabled<br />
and click Next.<br />
8. Click Next in the Start Installation dialog box. A few seconds<br />
pass while <strong>OneSight</strong> Remote Agent Setup copies files.<br />
9. After files have been copied, Setup requests the <strong>OneSight</strong><br />
server name.<br />
10. In the final Setup dialog box, click Finish. The Remote Agent is<br />
installed.<br />
To confirm this:<br />
Click Start, point to Settings, then click Control Panel.<br />
Double-click Services. The Services dialog box opens.<br />
In the Services list, the Empirix <strong>OneSight</strong> NT Remote Agent<br />
should be listed, with a Status of Started and a Startup value<br />
of Automatic.<br />
To close the Services dialog box, click Close.<br />
11. Identify the Remote Agent machine to the <strong>OneSight</strong> Server as<br />
described below.<br />
Chapter 2: Installing <strong>OneSight</strong> 25
Installing the <strong>OneSight</strong> Data Collector or Remote Agent<br />
Identifying the Remote Agent Machine to the <strong>OneSight</strong><br />
Server<br />
1. On the <strong>OneSight</strong> Server, log in to Empirix <strong>OneSight</strong> by clicking<br />
Start, pointing to Programs, then clicking <strong>OneSight</strong> Logon.<br />
2. Log in to Empirix <strong>OneSight</strong>.<br />
3. On the Configure tab, click Systems. The dialog box now<br />
shows a Systems list.<br />
4. If the machine where the Remote Agent is installed is:<br />
Not listed under Systems:<br />
Click Add.<br />
In the Add System dialog box, enter the machine’s name and<br />
click OK.<br />
Listed under Systems:<br />
Highlight the machine’s name in the Systems list and click<br />
Modify.<br />
5. In the System Editor, click the Discover Components button.<br />
6. Select the <strong>OneSight</strong> Remote Agent for Windows or Remote<br />
Perfmon check box in the Discover Components Configuration<br />
dialog box and click OK. You do not need to specify the<br />
Windows user name, domain, or password settings. Click OK.<br />
7. In the Discovery Status dialog box, after the Find Finished<br />
message appears, click Cancel.<br />
8. Click OK to close the System Editor.<br />
26 <strong>OneSight</strong> <strong>Administrator</strong> <strong>Guide</strong>
Installing the <strong>OneSight</strong> Data Collector or Remote Agent<br />
To create a monitor group based on or including the machine on<br />
which you installed the Remote Agent, see Configuring a Profile<br />
Monitor in Chapter 5.<br />
Using an Initialization File for Remote Agent Setup<br />
You can speed installation on multiple machines by using an<br />
initialization file, winnt_agent_setup.ini to specify the <strong>OneSight</strong><br />
Server name. A sample winnt_agent_setup.ini is located on the<br />
<strong>OneSight</strong> Server in the same folder as winnt_agent_setup.exe.<br />
1. Copy winnt_agent_setup.exe and winnt_agent_setup.ini from the<br />
<strong>OneSight</strong>Empirix\Setup\RemoteAgents folder on the <strong>OneSight</strong><br />
Server to a CD-ROM or to a network server.<br />
2. Edit the winnt_agent_setup.ini. In the Server= line in the [<strong>OneSight</strong>]<br />
section, specify the full address of your <strong>OneSight</strong> server. An IP<br />
address for the <strong>OneSight</strong> Server is recommended so that the<br />
Remote Agent can continue to function when DNS is not<br />
available.<br />
3. Run the setup program as described above for each machine<br />
that requires the <strong>OneSight</strong> Remote Agent. When you are<br />
prompted to specify the <strong>OneSight</strong> Server, the information in the<br />
.ini file setting is displayed by default.<br />
Installing the UNIX Remote Agent<br />
The UNIX Remote Agent gives Empirix <strong>OneSight</strong> access to UNIX<br />
system data. This Remote Agent gathers CPU, disk, and memory<br />
information from a UNIX server running the Solaris 5.8 or higher,<br />
SPARC platform only, or Linux 9 or higher operating system. It can<br />
also be used to monitor web server log files and run remote shell<br />
scripts.<br />
Chapter 2: Installing <strong>OneSight</strong> 27
Installing the <strong>OneSight</strong> Data Collector or Remote Agent<br />
The UNIX Remote Agent can be installed using a self-extracting<br />
shell program.<br />
The <strong>OneSight</strong>Solaris.tar and <strong>OneSight</strong>Linux.tar files can be downloaded<br />
from http://esupport.empirix.com/. You will need a user name and<br />
password to access the esupport site. Click Request an Account<br />
when the login page is displayed.<br />
Each .tar file contains _setup file for installing the UNIX Remote<br />
Agent. The _setup file is a standalone installation file that prompts<br />
you for the necessary information.<br />
The _setup files are:<br />
sunos_agent_setup – for Remote Agents (AHP/C ++ Agent types<br />
only)<br />
linux_agent_setup – for Remote Agents (AHP/C ++ Agent types<br />
only)<br />
Installing the UNIX Remote Agent<br />
The <strong>OneSight</strong>Solaris.tar and <strong>OneSight</strong>Linux.tar files can be downloaded<br />
from http://esupport.empirix.com/. You will need a user name and<br />
password to access the esupport site. Click Request an Account<br />
when the login page is displayed.<br />
Each .tar file contains _setup file for installing the UNIX Remote<br />
Agent. The _setup file is a standalone installation file that prompts<br />
you for the necessary information.<br />
To use the UNIX Remote Agent, run the installer. You can also<br />
configure the UNIX Remote Agent to start and stop with the UNIX<br />
server; however, this step is optional. Before you install a <strong>OneSight</strong><br />
Remote Agent, see the <strong>OneSight</strong> Remote Agent Requirements.<br />
28 <strong>OneSight</strong> <strong>Administrator</strong> <strong>Guide</strong>
Installing the <strong>OneSight</strong> Data Collector or Remote Agent<br />
To install the UNIX Remote Agent on a UNIX server:<br />
1. Navigate to the Empirix\<strong>OneSight</strong>\setup\RemoteAgents\Solaris<br />
folder on the <strong>OneSight</strong> CD.<br />
2. Extract the sunos_agent_setup or linux_agent_setup installer file<br />
using the following commands.<br />
Solaris:<br />
Linux:<br />
tar -xvf <strong>OneSight</strong>Solaris.tar<br />
tar –xvf <strong>OneSight</strong>Linux.tar<br />
tar –xvf <strong>OneSight</strong>LinuxAgent.tar<br />
3. Copy the sunos_agent_setup or linux_agent_setup installer to the<br />
UNIX machine using FTP or via a network drive.<br />
4. On the UNIX machine, run the installer.<br />
Solaris: sh sunos_agent_setup<br />
Linux: sh linux_agent_setup<br />
Note: You may need to change the permissions of the installer<br />
file before it can be executed. For example:<br />
Solaris: chmod 777 sunos_agent_setup<br />
Linux: chmod 777 linux_agent_setup<br />
5. When prompted, enter an installation path for the Remote<br />
Agent. For example:<br />
//<strong>OneSight</strong><br />
The installation path must be an absolute path.<br />
Note: An installation subdirectory is created using the path you<br />
specify. All files for the Remote Agent are installed to this<br />
installation subdirectory. For example, //<strong>OneSight</strong><br />
Chapter 2: Installing <strong>OneSight</strong> 29
Installing the <strong>OneSight</strong> Data Collector or Remote Agent<br />
6. When prompted, enter the IP address of the <strong>OneSight</strong> Server to<br />
which the Remote Agent will connect. If you are running the<br />
installer as root, you will be prompted for the name of the<br />
owner and group for the installed files. For example:<br />
root<br />
sys<br />
The owner will also be the user that the UNIX Remote Agent<br />
process will run as when it is started via the <strong>OneSight</strong>Agent<br />
script.<br />
Once this information is complete, the installation begins:<br />
Extracting files from installer . . .<br />
Uncompressing files . . .<br />
Installing files into [install-dir] . . .<br />
(You will see the files being extracted and installed during this period.)<br />
Writing configuration file . . .<br />
Writing sample Startup/Shutdown script . . .<br />
Cleaning up temporary files . . .<br />
The <strong>OneSight</strong> Remote Agent was successfully installed in<br />
//<strong>OneSight</strong><br />
Running the UNIX Remote Agent<br />
To run the Remote Agent, use one of the following commands:<br />
<strong>OneSight</strong>Agent start – This command runs the <strong>OneSight</strong>Agent<br />
script supplied by the <strong>OneSight</strong> Remote Agent package. The<br />
script, followed by the start command, initializes the UNIX<br />
Remote Agent (ahp). This script must be run as root.<br />
<strong>OneSight</strong>Agent stop – This command stops the UNIX Remote<br />
Agent (ahp).<br />
30 <strong>OneSight</strong> <strong>Administrator</strong> <strong>Guide</strong>
Installing the <strong>OneSight</strong> Data Collector or Remote Agent<br />
bin/ahp& – This command starts the UNIX Remote Agent<br />
directly. The ampersand (&) following a command tells the UNIX<br />
shell to run that program in the background. This is not<br />
recommended although the Remote Agent will not be restarted<br />
automatically if it is stopped for some reason such as being reset<br />
by the <strong>OneSight</strong> Server.<br />
Note: Do not run multiple instances of the UNIX Remote Agent<br />
(ahp) simultaneously. More than one instance of ahp will result in<br />
loss of data due to competing connections between the <strong>OneSight</strong><br />
Server and the host machine.<br />
Starting and Stopping the UNIX Remote Agent<br />
To configure the UNIX Remote Agent to start and stop with the<br />
server, complete the following steps.<br />
A note about the initialization and termination process: On the UNIX<br />
operating system, scripts intended to be used for initialization and<br />
termination are located in the /etc/init.d directory and linked to files<br />
in the appropriate rc?.d directories, depending on which priority<br />
level is intended. To configure the UNIX Remote Agent to start and<br />
stop with the UNIX server machine, this process must be completed.<br />
For additional information, refer to the /etc/init.d/README file.<br />
1. On the UNIX server, navigate to the installation subdirectory<br />
(for example, [install_dir]/<strong>OneSight</strong>). This directory was added<br />
during the sunos_agent_setup or linux_agent_setup installation.<br />
2. Copy the <strong>OneSight</strong>Agent file to the /etc/init.d directory.<br />
3. Using the /etc/init.d/README file as a guide, create a link to the<br />
<strong>OneSight</strong>Agent file in the appropriate rc?.d directories. These<br />
linked files enable the initialization and termination of the<br />
Remote Agent scripts when the UNIX server is started or<br />
stopped. For example,<br />
# ln –s /etc/init.d/<strong>OneSight</strong>Agent /etc/rc2.d/s99<strong>OneSight</strong>Agent<br />
# ln –s /etc/init.d/<strong>OneSight</strong>Agent /etc/rc1.d/k70<strong>OneSight</strong>Agent<br />
Chapter 2: Installing <strong>OneSight</strong> 31
Installing the <strong>OneSight</strong> Data Collector or Remote Agent<br />
4. Start the agent manually or reboot the server to start the Remote<br />
Agent.<br />
With the UNIX Remote Agent installed and running, the Empirix<br />
<strong>OneSight</strong> Server is able to collect data from this machine. For more<br />
information regarding the configuration of a UNIX machine, see<br />
Adding Systems in Chapter 7.<br />
Data Collector Installation Requirements<br />
You can install the <strong>OneSight</strong> Data Collector in the following<br />
environment:<br />
PCs running Windows 2003 Server or higher server version<br />
The machine must have at least 70 MB of available disk space<br />
and 2 GB of RAM.<br />
To install the <strong>OneSight</strong> Data Collector, you must log on with<br />
administrative rights.<br />
Installing the Data Collector on a Windows Machine<br />
To install the <strong>OneSight</strong> Data Collector on a Windows machine:<br />
1. Copy collector_setup.exe from the<br />
Empirix\<strong>OneSight</strong>\Setup\RemoteAgents folder on the <strong>OneSight</strong><br />
Server to the machine where you want to install the <strong>OneSight</strong><br />
Data Collector.<br />
2. Log on, with administrative privileges, to the machine where<br />
you want to install the Data Collector. If the currently loggedon<br />
user does not have appropriate privileges, you will see an<br />
error message.<br />
3. Using Windows Explorer, double-click collector_setup.exe.<br />
32 <strong>OneSight</strong> <strong>Administrator</strong> <strong>Guide</strong>
Installing the <strong>OneSight</strong> Data Collector or Remote Agent<br />
4. After a few moments, the Welcome to <strong>OneSight</strong> Data Collector<br />
Setup dialog box appears. Click Next.<br />
5. Read the license agreement and click Accept.<br />
6. In the Destination Folder dialog box, select where the Data<br />
Collector files should be installed. Click Next.<br />
7. Enter the host name or IP address of the <strong>OneSight</strong> server and<br />
click Next.<br />
8. Leave the default location name for this Data Collector, or<br />
optionally enter your own unique name. Click Next.<br />
9. The JMX Proxy dialog box is displayed. Select the application<br />
server(s) that you are using. If you are not using a JMX monitor<br />
and do not select anything you will be asked to confirm.<br />
One proxy can monitor all application servers or the same type<br />
with the following exceptions:<br />
WebLogic 9 and WebLogic 10 cannot be monitored by the<br />
same proxy. You must install two proxies, one for each, if<br />
you are monitoring both of these application servers.<br />
WebSphere 6.0 requires the proxy to be configured only for<br />
it.<br />
WebLogic 8.1 is monitored by the proxy on JRE1.4. All<br />
other applications servers are monitored by JRE 1.5. If you<br />
are monitoring other versions of WebLogic 8.1 you must<br />
install a Data Collector and proxy for each.<br />
Refer to, “Using the JMX Proxy,” below for more information.<br />
Note: You still need to copy the appropriate jar files to the<br />
appropriate locations as described in “Configuring JMX<br />
Monitors” in Chapter 5.<br />
Chapter 2: Installing <strong>OneSight</strong> 33
Installing the <strong>OneSight</strong> Data Collector or Remote Agent<br />
10. It is recommended that you leave Enable Remote Update<br />
selected.<br />
11. Click Next in the Start Installation dialog box. A few seconds<br />
pass while <strong>OneSight</strong> Data Collector Setup copies files.<br />
Note: If you are installing the Data Collector to monitor disk<br />
performance on a Windows machine, Diskperf -yv must be<br />
enabled on that machine.<br />
12. In the final Setup dialog box, click Finish. The Data Collector is<br />
installed.<br />
To confirm this:<br />
Click Start, point to Settings, then click Control Panel.<br />
Double-click Services. The Services dialog box opens.<br />
In the Services list, Empirix <strong>OneSight</strong> Data Collector <br />
should be listed, with a Status of Started and a Startup value<br />
of Automatic. is the instance number for this Data<br />
Collector starting with one and incrementing one for every<br />
Data Collector instance you install.<br />
To close the Services dialog box, click Close.<br />
34 <strong>OneSight</strong> <strong>Administrator</strong> <strong>Guide</strong>
Using the JMX Proxy<br />
Using the JMX Proxy<br />
The following diagram shows the relationship between the JMX<br />
Proxies and the Data Collector.<br />
Each JMX Proxy runs as a Service. There are three proxies in the<br />
above diagram, so there would be three services.<br />
Each JMX Proxy must know which Data Collector it connects to.<br />
This is done by configuring the Data Collector host and port during<br />
the JMX Proxy installation.<br />
Each JMX Proxy is in charge of performing JMX operations to the<br />
application servers. The Data Collector dispatches the JMX requests<br />
to a certain proxy. After the proxy gets the data, it sends it back data<br />
to the Data Collector.<br />
Each JMX Proxy can get data from one type of application server<br />
only and only one proxy should run with each type of application<br />
server. For example, JMX Proxy 1 can get data from JBoss 3, JBoss<br />
4 and JBoss 5, JMX Proxy 2 can get data from Weblogic 9; and JMX<br />
Proxy 3 can get data from Weblogic 10. In addition, some<br />
application servers cannot be monitored by one proxy for all<br />
versions as described below. In these cases you must install a proxy<br />
for each version. Since the Data Collector installer only installs one<br />
JMX Proxy, you must manually install additional proxies.<br />
Chapter 2: Installing <strong>OneSight</strong> 35
Using the JMX Proxy<br />
WebLogic 9 and WebLogic 10 cannot be monitored by the same<br />
proxy. You must install two proxies, one for each, if you are<br />
monitoring both of these application servers.<br />
WebSphere 6.0 requires the proxy to be configured only for it.<br />
WebLogic 8.1 is monitored by the proxy on JRE1.4. All other<br />
application servers are monitored by JRE 1.5. If you are<br />
monitoring other versions of WebLogic 8.1 you must install a<br />
Data Collector and proxy for each.<br />
When installing the Data Collector, you can install JMX Proxy for<br />
JRE 1.4 or JRE 5.0. JMX Proxy for JRE 1.4 is only for very old<br />
Application Servers that cannot be monitored by a proxy that runs<br />
on JRE 5.0, such as Weblogic 8.1.<br />
Installing JMX Proxy Automatically<br />
To install the JMX Proxy automatically:<br />
1. Start the JMX Proxy installer.<br />
2. Click I Agree to accept the license agreement.<br />
3. Enter the data collector host and port numbers.<br />
4. Select which application server the proxy is to monitor and<br />
click Next.<br />
5. Select the folder that you want to install the proxy in and click<br />
Install.<br />
6. When the installation is finished, the message, ―Empirix<br />
<strong>OneSight</strong> JMX proxy for JRE 5.0 is installed. Please start it<br />
from Service Management Console,‖ is displayed. Click OK.<br />
36 <strong>OneSight</strong> <strong>Administrator</strong> <strong>Guide</strong>
Using the JMX Proxy<br />
To uninstall the JMX Proxy automatically:<br />
1. Start the JMX Proxy uninstaller.<br />
2. Click I Agree to accept the license agreement.<br />
3. Enter the data collector host and port numbers.<br />
4. Double-click uninstall.exe and follow the wizard to uninstall.<br />
Installing JMX Proxy Manually<br />
To install the JMX Proxy manually:<br />
1. Copy either the Proxy15 or Proxy14 folder located in the<br />
\JMXProxy folder and rename it to a<br />
meaningful name. Note that the folder name cannot contain<br />
spaces.<br />
2. Edit the service name and description located in the<br />
\properties\proxy_win_service.properties file in the newly created<br />
folder. The service.name is the name for the new JMX Proxy<br />
service and must be unique. The service.description is the<br />
name that will be displayed in the Services console.<br />
3. Double click the installService.bat file located in the \bin folder<br />
in the new proxy folder. This command registers the service<br />
into Windows.<br />
4. Open the Services console by clicking Start, Settings, Control<br />
Panel, Administrative Tools, Services.<br />
5. Select the new JMX Proxy service and click Start.<br />
Configuring the JMX Proxy<br />
The JMX Proxy configuration file is<br />
\properties\service.properties. It contains the following<br />
Chapter 2: Installing <strong>OneSight</strong> 37
Post Installation<br />
properties for configuring which data collector this proxy is talking<br />
to:<br />
DC.SERVER = 127.0.0.1<br />
DC.JMXMONITORPORT = 5100<br />
The following property indicates the application server that this<br />
proxy will get data from. It contains comma-separated application<br />
server names.<br />
PROXY.SupportedJMXServers = weblogic100;jboss50;jboss32<br />
In the above example, the JMX Proxy will tell the Data Collector<br />
that it can handle JMX requests to Weblogic 10, JBoss 50 and JBoss<br />
3.<br />
The following property is for configuring which network interface<br />
to use if your server has more than one network adapter. By default,<br />
it is commented out since the JVM usually selects the correct<br />
address.<br />
# PROXY.IP = 127.0.0.1<br />
The following properties are for configuring the jar library for each<br />
application server and do not usually need to be changed.<br />
Agents.JMX.Server.weblogic61.ClassPath =<br />
classes/weblogic6.1/weblogic.jar<br />
Agents.JMX.Server.weblogic70.ClassPath =<br />
classes/weblogic7.0/weblogic.jar<br />
……<br />
Post Installation<br />
Once <strong>OneSight</strong> is installed you can verify that the server is<br />
responding by going to http://:8080 and log in to<br />
<strong>OneSight</strong>. You can also verify that the server is running and Data<br />
Collectors are connected using the support page or Location dialog<br />
38 <strong>OneSight</strong> <strong>Administrator</strong> <strong>Guide</strong>
<strong>OneSight</strong> Agent Proxy<br />
box on the <strong>OneSight</strong> Configure tab. Select Support from the Main<br />
Menu, then select <strong>OneSight</strong> Server Connections from the Agent<br />
Diagnostic Support menu.<br />
If the <strong>OneSight</strong> Server is not responding, check the <strong>OneSight</strong> log<br />
located in the C:\Empirix\<strong>OneSight</strong>\logs directory.<br />
For information about the database, check the InstallDatabase.log file<br />
located in the C:\Empirix\<strong>OneSight</strong>\logs directory.<br />
<strong>OneSight</strong> Agent Proxy<br />
In the default <strong>OneSight</strong> setup, all Data Collectors and Remote<br />
Agents make the initial connection back to the <strong>OneSight</strong> server as<br />
shown in the following diagram.<br />
<strong>OneSight</strong><br />
DC1<br />
Firewall<br />
Agent1<br />
Agent2<br />
DC2<br />
However, there are situations when this is not desirable, particularly<br />
when you are trying to monitor behind a firewall or DMZ, or when<br />
you only want one connection back to the <strong>OneSight</strong> server.<br />
Chapter 2: Installing <strong>OneSight</strong> 39
<strong>OneSight</strong> Agent Proxy<br />
The Agent Proxy allows connections to be made from Data<br />
Collectors and Remote Agents to the <strong>OneSight</strong> server through a<br />
single connection from the Agent Proxy to the <strong>OneSight</strong> Server as<br />
shown in the following diagram.<br />
Agent Proxy<br />
DC1<br />
Firewall<br />
<strong>OneSight</strong><br />
Agent1<br />
Agent2<br />
DC2<br />
Note: The Agent Proxy only works with the STD protocol that<br />
<strong>OneSight</strong> uses to communicate with the Data Collectors and<br />
Remote Agents. It will not pass HTTP traffic.<br />
To install the Agent Proxy you must complete the following steps:<br />
Install the Agent Proxy<br />
Configure Data Collectors and Remote Agents<br />
Configure <strong>OneSight</strong><br />
Debug<br />
Installing the Agent Proxy<br />
1. On the proxy machine, create the following directory:<br />
\Empirix\<strong>OneSight</strong>\Proxy.<br />
40 <strong>OneSight</strong> <strong>Administrator</strong> <strong>Guide</strong>
<strong>OneSight</strong> Agent Proxy<br />
2. From the <strong>OneSight</strong> Server, copy the service.exe, proxy.exe and<br />
proxy.properties files from the \Empirix\<strong>OneSight</strong>\bin<br />
directory to the \Empirix\<strong>OneSight</strong>\Proxy directory on<br />
the proxy machine.<br />
3. On the proxy machine, open the proxy.properties file and make<br />
the following changes:<br />
Proxy.imagepath = \..\bin\Proxy.exe<br />
Proxy.startupdir = \..\bin<br />
To:<br />
Proxy.imagepath = \..\Proxy\Proxy.exe<br />
Proxy.startupdir = \..\Proxy<br />
Note: The directory change must match the directory where the<br />
proxy.exe file exists, as recommendation above. If you use a<br />
different directory, make the appropriate changes.<br />
4. Make any other necessary modifications. For example, you may<br />
need to change the default proxy listening port or specify a<br />
password for accessing the proxy. The defaults are port 5007<br />
and a blank password.<br />
5. Save the file.<br />
6. You can now install the proxy as a service. From a command<br />
window, type the following:<br />
C:\Empirix\<strong>OneSight</strong>\Properties>C:\Empirix\<strong>OneSight</strong>\B<br />
in> service -install -param proxy.properties<br />
Note: If there are errors, see the debugging section later in this<br />
chapter.<br />
7. Start the proxy service from the services window. The Service<br />
is listed as Empirix <strong>OneSight</strong> Agent Proxy. Or you can start the<br />
service from the command window by typing the following:<br />
Chapter 2: Installing <strong>OneSight</strong> 41
<strong>OneSight</strong> Agent Proxy<br />
C:\Empirix\<strong>OneSight</strong>\Properties> net start<br />
EmpirixAgentProxy<br />
To stop the service from the command window type the<br />
following:<br />
C:\Empirix\<strong>OneSight</strong>\Properties> net stop<br />
EmpirixAgentProxy<br />
8. The <strong>OneSight</strong> Agent Proxy should now be up and running. It<br />
will create log files with the naming convention<br />
Proxy_console.txt.X where X will denote a number. The most<br />
recent or active log file is always the file without a number.<br />
Data Collector or Remote Agent Configuration<br />
1. Open the OSDC.Properties file from the<br />
\Empirix\DataCollector\Properties directory or<br />
\Program Files\Empirix\<strong>OneSight</strong>\Properties and locate the<br />
COMM section. The default looks like this:<br />
Comm.ServerName = localhost<br />
#Comm.ServerPort = 5007<br />
#Comm.ConnectFrom = 192.168.0.102<br />
Comm.ServerName is the name of the <strong>OneSight</strong> Server.<br />
Comm.ServerPort is the port on which the <strong>OneSight</strong> Server will<br />
listen for the DataCollector or Remote Agent.<br />
Comm.ConnectFrom is the external IP address of the <strong>OneSight</strong><br />
Server if it is within a DMZ or is subject to NAT.<br />
To enable this so the DataCollector uses port 5777 to<br />
communicate to the <strong>OneSight</strong> server you would uncomment the<br />
Comm.ServerPort line so the section looks like this:<br />
Comm.ServerName = localhost<br />
Comm.ServerPort = 5777<br />
#Comm.connectFrom = 192.168.0.102<br />
2. Save the file and restart the Data Collector.<br />
42 <strong>OneSight</strong> <strong>Administrator</strong> <strong>Guide</strong>
<strong>OneSight</strong> Agent Proxy<br />
3. Repeat for all other Data Collectors that must use the Agent<br />
Proxy to communicate with the <strong>OneSight</strong> Server.<br />
<strong>OneSight</strong> Server Configuration<br />
1. Open the OSServer.properties file from the<br />
[Installdir]\Empirix\<strong>OneSight</strong>\Properties directory and locate this<br />
section:<br />
# --------------<br />
# Comm.Proxy..Address<br />
# Comm.Proxy..Port<br />
# Comm.Proxy..Password<br />
# --------------<br />
# Specifies a proxy to use for framework<br />
connections,<br />
# the port to connect to, and the (optional)<br />
password.<br />
#<br />
#Comm.Proxy.Proxy1.Address = DMZ1<br />
#Comm.Proxy.Proxy1.Port = 5555<br />
#Comm.Proxy.Proxy1.Password = sesame<br />
To enable this so the <strong>OneSight</strong> server uses port 5777 to<br />
communicates with the DataCollector you would uncomment<br />
the Comm.Proxy.Proxy1.Port line so the section looks like<br />
this.<br />
#Comm.Proxy.Proxy1.Address = DMZ1<br />
Comm.Proxy.Proxy1.Port = 5777<br />
#Comm.Proxy.Proxy1.Password = sesame<br />
2. Save the file and restart the <strong>OneSight</strong> Server.<br />
Debugging the Agent Proxy<br />
If you encounter errors or need to verify that the Agent Proxy is<br />
working correctly, you may start the service in debug mode.<br />
Chapter 2: Installing <strong>OneSight</strong> 43
<strong>OneSight</strong> Agent Proxy<br />
1. If the Agent Proxy service is running, stop the service from the<br />
command window by typing the following:<br />
C:\Empirix\<strong>OneSight</strong>\Proxy> net stop<br />
EmpirixAgentProxy<br />
2. From a command window, type the following:<br />
C:\Empirix\<strong>OneSight</strong>\Proxy> service -debug -param<br />
proxy.properties<br />
3. The Agent Proxy will reply with something similar to the<br />
following:<br />
Debugging Empirix <strong>OneSight</strong> Agent Proxy.<br />
Empirix Service Manager (INFO): started.<br />
Empirix Service Manager (INFO): The process 'Proxy'<br />
was started.<br />
Empirix Service Manager (INFO): All processes have<br />
been started.<br />
4. If there are any problems or error messages, they are displayed<br />
in the command window. The following are typical error<br />
messages when the Agent Proxy cannot listen on the port<br />
specified in the proxy.properties file.<br />
Empirix Service Manager (ERROR): The process 'Proxy'<br />
unexpectedly quit. (Last error reported by system:<br />
Cannot create a file when that file already exists.<br />
(0xb7))<br />
Empirix Service Manager (INFO): The process 'Proxy'<br />
was restarted.<br />
Empirix Service Manager (ERROR): The process 'Proxy'<br />
unexpectedly quit. (Last error reported by system:<br />
Cannot create a file when that file already exists.<br />
(0xb7))<br />
Empirix Service Manager (ERROR): The process 'Proxy'<br />
will not run. This service will now stop. (Last<br />
error reported by system: Cannot create a file when<br />
that file already exists. (0xb7))<br />
44 <strong>OneSight</strong> <strong>Administrator</strong> <strong>Guide</strong>
<strong>OneSight</strong> Agent Proxy<br />
5. To stop the debugging, press CTRL-C in the command window<br />
where the Agent Proxy was started. Messages similar to the<br />
following messages are displayed:<br />
Stopping Empirix <strong>OneSight</strong> Agent Proxy.<br />
Empirix Service Manager (INFO): The process 'Proxy'<br />
was stopped.<br />
Empirix Service Manager (INFO): stopped.<br />
6. When the <strong>OneSight</strong> server cannot connect to the Agent Proxy,<br />
there will be information in the <strong>OneSight</strong> Server log similar to<br />
the following:<br />
[Wed Jan 22 18:47:56 EST 2003] 455 Framework<br />
Critical Error: com.wrq.wam.fw.comm.FwCommException:<br />
54 172.16.3.32<br />
at<br />
com.wrq.wam.fw.comm.RemoteFramework.StartReturnData(<br />
Native Method)<br />
at<br />
com.wrq.wam.fw.ipc.Dispatcher.sendRequest(Dispatcher<br />
.java:195)<br />
at<br />
com.wrq.wam.fw.ipc.RemoteAgentFramework.sendRequest(<br />
RemoteAgentFramework.java:838)<br />
at<br />
com.wrq.wam.fw.ipc.RemoteAgentFramework.sendAggMsg(R<br />
emoteAgentFramework.java:932)<br />
at<br />
com.wrq.wam.fw.agentfw.AgentFramework.checkbacklog(A<br />
gentFramework.java:687)<br />
at<br />
com.wrq.wam.fw.agentfw.AgentFramework$QueueWatcher.r<br />
un(AgentFramework.java:449)<br />
at java.lang.Thread.run(Thread.java:536)<br />
Chapter 2: Installing <strong>OneSight</strong> 45
<strong>OneSight</strong> Default Ports<br />
<strong>OneSight</strong> Default Ports<br />
<strong>OneSight</strong> uses the following default ports for the <strong>OneSight</strong> Server,<br />
Data Collector and Proxy Server. These defaults can be changed by<br />
editing the OSDC.properties file.<br />
<strong>OneSight</strong> Server Ports<br />
5007 – The port used to listen on from a comm. channel.<br />
5008 – The JMS Server port.<br />
7001 – The SNMP agent port.<br />
8080 – The <strong>OneSight</strong> Sever with an HTTP connection.<br />
8443 – The <strong>OneSight</strong> Server with and HTTPS connection.<br />
Data Collector Ports<br />
5006 – The standard port for the Probe agent.<br />
5100 – The standard port for the JMX Proxy*<br />
5198 – The standard port for the Oracle Test for Web Applications<br />
agent debug information in the Oracle Test for Web Applications<br />
Transaction. The AHP listen port, the port on the Data Collector<br />
used by the <strong>OneSight</strong> Server to send inbound messages.<br />
8080 – The port used when communicating with the agent separated<br />
by a firewall. The JHP listen port, the port on the Data Collector<br />
used by the <strong>OneSight</strong> Server to send inbound messages.<br />
8081 – The port used when communicating with the agent separated<br />
by a firewall.<br />
445, 135, and 139 – The TCP ports that must be open from the Data<br />
Collector to the system under test to collect Perfmon metrics.<br />
46 <strong>OneSight</strong> <strong>Administrator</strong> <strong>Guide</strong>
Configuring Contact Center Components<br />
135, 445, and any dynamically assigned TCP ports above 1024 –<br />
The ports that WMI uses to gather statistics.<br />
Proxy Server Ports<br />
5007 – The port on which to listen for agents and for servers if no<br />
server port is separately specified.<br />
7778 – The port on which to listen for server connections and<br />
defaults to the agent port.<br />
*Port 5100 is a listening port that accepts both local host traffic and<br />
connections from other machines. Therefore it is possible to install<br />
a JMX Proxy on a different machine with a data collector. The port<br />
number is also based on the 5100 plus the data collector instance<br />
number. For example, if multiple data collectors are installed on the<br />
same machine, data collector 1 may listen on port 5100 and data<br />
collector 2 may listen on port 5101, etc.<br />
Configuring Contact Center Components<br />
Contact Center components are configured using the <strong>OneSight</strong><br />
interface to enter details such as URLs, user names, and passwords.<br />
Some web components, however, may require extra configuration<br />
outside of <strong>OneSight</strong>, because of either their location or the data<br />
sources <strong>OneSight</strong> relies on.<br />
In some situations, installing the <strong>OneSight</strong> Data Collector or<br />
Remote Agent may be the best way to receive information about a<br />
web component. The <strong>OneSight</strong> Data Collector or Remote Agent can<br />
collect information more efficiently than some data sources, plus it<br />
has the ability to run remote scripts to correct problems. Installing<br />
the Data Collector or Remote Agent is a separate process from<br />
<strong>OneSight</strong> Setup and is entirely optional.<br />
The table below lists web components that may require some extra<br />
configuration for <strong>OneSight</strong> to monitor them. For the full list of what<br />
<strong>OneSight</strong> supports, refer to What <strong>OneSight</strong> Monitors in Chapter 1.<br />
Chapter 2: Installing <strong>OneSight</strong> 47
Configuring Contact Center Components<br />
Note: If the monitored web component is on the other side of a<br />
firewall, non-transparent controller (such as F5’s BIG-IP), router, or<br />
switch, you may need to do some extra configuration (for example,<br />
enable a port on a firewall) to allow data to pass from the monitored<br />
web component to the <strong>OneSight</strong> Server.<br />
Web Component<br />
PCs or servers running<br />
Windows 2003 with<br />
Service Pack 1 or<br />
higher, and Windows<br />
2000<br />
UNIX workstations<br />
Web servers running<br />
Apache version 1.3x<br />
Web servers running<br />
Microsoft IIS version<br />
4.0 or 5.0<br />
Web servers running<br />
Netscape Enterprise<br />
Server version 3.6, or<br />
iPlanet 4.0 on UNIX<br />
Configuration Suggestions<br />
Either ensure that the <strong>OneSight</strong> Server<br />
can access the monitored machine’s<br />
Perfmon data or install the <strong>OneSight</strong> Data<br />
Collector or Remote Agent (for Windows<br />
2003 or Windows 2000). To receive disk<br />
performance information, execute the<br />
Diskperf –y command.<br />
Install the <strong>OneSight</strong> Remote Agent.<br />
Install the <strong>OneSight</strong> Data Collector or<br />
Remote Agent (for UNIX) and confirm<br />
that the <strong>OneSight</strong> Server or Data<br />
Collector is on the same subnet as the<br />
monitored web server.<br />
Either ensure that the <strong>OneSight</strong> Server<br />
can access the monitored machine’s<br />
Perfmon data or install the <strong>OneSight</strong> Data<br />
Collector or Remote Agent (for<br />
Windows). Also, confirm that the<br />
<strong>OneSight</strong> Server is on the same subnet as<br />
the monitored web server or Data<br />
Collector.<br />
Enable SNMP and confirm that the<br />
<strong>OneSight</strong> Server is on the same subnet as<br />
the monitored web server or Data<br />
Collector. To monitor an iPlanet web<br />
server, use the Netscape Enterprise Server<br />
48 <strong>OneSight</strong> <strong>Administrator</strong> <strong>Guide</strong>
Configuring Contact Center Components<br />
Web Component<br />
machines<br />
Database servers<br />
running Oracle<br />
versions 8.0 or 8i<br />
Database servers<br />
running Microsoft<br />
SQL Server, versions<br />
2000 or 2003<br />
Switches - Cisco<br />
Catalyst<br />
Controllers - F5’s<br />
BIG-IP<br />
Configuration Suggestions<br />
profile.<br />
See Setting Up Oracle ODBC for<br />
<strong>OneSight</strong>.<br />
Either ensure that the <strong>OneSight</strong> Server<br />
can access the monitored machine’s<br />
Perfmon data or install the <strong>OneSight</strong> Data<br />
Collector or Remote Agent (for<br />
Windows). Also make sure that the<br />
database server’s Perfmon installation has<br />
SQL objects.<br />
Enable SNMP.<br />
Enable SNMP as described in the BIG-IP<br />
<strong>Administrator</strong>s <strong>Guide</strong>. Configure BIG-IP<br />
to accept SNMP requests from the IP<br />
address of the <strong>OneSight</strong> server.<br />
SNMP<br />
SNMP (Simple Network Management Protocol) is a basic<br />
query/response protocol that has become widely used on TCP/IP<br />
networks. SNMP provides specific performance and configuration<br />
information SNMP network devices, such as routers, or on hosts,<br />
such as workstations or mainframes.<br />
If you want <strong>OneSight</strong> to monitor SNMP information from any hosts<br />
or devices, SNMP must be enabled on those machines. Because the<br />
implementations of SNMP are so varied, SNMP installation<br />
instructions are not provided here. See the documentation provided<br />
with your SNMP software for more information.<br />
Chapter 2: Installing <strong>OneSight</strong> 49
Configuring Contact Center Components<br />
Using Perfmon<br />
Perfmon, or Performance Monitor, is a Microsoft computer<br />
performance tool that runs on Windows platforms. <strong>OneSight</strong> can<br />
use a monitored Windows machine’s Perfmon to gather data about<br />
that machine—either by using the <strong>OneSight</strong> Data Collector or<br />
Remote Agent (installed on the monitored machine) or by giving<br />
the <strong>OneSight</strong> Server access to that machine’s Perfmon data, which<br />
you can do by giving the <strong>OneSight</strong> Server an account with<br />
administrative privileges on the monitored machine.<br />
To check for SQL objects in Perfmon<br />
<strong>OneSight</strong> can also use a machine’s Perfmon SQL objects to gather<br />
data about a Microsoft SQL Server installation (version 2000 or<br />
2005) on that machine.<br />
If you use the profiles for Microsoft SQL Server, version 2000 or<br />
2005 to monitor a database server running either of those database<br />
applications, the <strong>OneSight</strong> Server must be able to access the<br />
server’s Perfmon, and the monitored database server’s Perfmon<br />
must have SQL objects. To check for SQL objects in Perfmon:<br />
1. On the <strong>OneSight</strong> Server, open the Windows Performance<br />
Monitor.<br />
2. On the Performance Monitor’s Edit menu, click Add to Chart.<br />
The Add to Chart dialog box appears.<br />
3. In the computer box, type two backslashes followed by the<br />
name of the monitored database server (for example, \\Stella).<br />
4. In the Object list, search for SQL objects, such as SQL.<br />
5. If you find SQL objects, <strong>OneSight</strong> will be able to collect the<br />
necessary SQL Server information from the machine, click Done<br />
to close the Add to Chart dialog box.<br />
50 <strong>OneSight</strong> <strong>Administrator</strong> <strong>Guide</strong>
Configuring Contact Center Components<br />
Using Diskperf<br />
If you don’t find SQL objects, <strong>OneSight</strong> won’t be able to collect the<br />
necessary SQL Server information from the machine unless you<br />
reinstall Microsoft SQL Server version 2000 or 2005. If you accept<br />
the default options during SQL Server Setup, you should get the<br />
necessary SQL objects installed.<br />
Diskperf is a command that enables the Windows Perfmon counter<br />
that measures computer disk performance.<br />
You will probably have to enable Diskperf on the Windows 2000,<br />
2003 machines that you intend to monitor. <strong>OneSight</strong> profiles for<br />
Windows 2003 and Windows 2000 systems use the Perfmon<br />
Logical Disk counters. These counters are typically disabled by<br />
default on Windows 2000 and 2003 machines.<br />
To execute the Diskperf command<br />
1. Log on with administrative rights to Windows machine whose<br />
disk performance you want <strong>OneSight</strong> to monitor.<br />
2. At the command line, type one of the following:<br />
Non-RAID or hardware RAID PCs: diskperf –y<br />
Software RAID PCs: diskperf –y e<br />
Windows 2000 and 2003 PCs: diskperf –yv<br />
Note: the complete list of options for either system can be found<br />
by running diskperf -?<br />
3. Press Enter.<br />
4. Restart the computer.<br />
Chapter 2: Installing <strong>OneSight</strong> 51
To log in to <strong>OneSight</strong><br />
To log in to <strong>OneSight</strong><br />
Using <strong>OneSight</strong> Log In<br />
Use the login dialog box to login to the <strong>OneSight</strong> console.<br />
1. In the User Name box, type your assigned user name. This entry<br />
is not case sensitive<br />
2. In the Password box, type your assigned password. This entry is<br />
case sensitive.<br />
3. Click Log In.<br />
Note: <strong>OneSight</strong> will log you out automatically after two hours of<br />
inactivity. You must log back in to <strong>OneSight</strong> to regain access to all<br />
<strong>OneSight</strong> Console pages.<br />
Using Windows Log In<br />
Windows Log In lets you use your Windows ID and Windows<br />
password for authentication. You must be configured as a <strong>OneSight</strong><br />
user and the Allow Windows Login option must be checked for your<br />
account on the Rights tab of the User Editor.<br />
If you are logging in to the same physical machine as the <strong>OneSight</strong><br />
server, authentication may fail and you will be asked to enter your<br />
user name and password as described in the following procedure:<br />
1. Enter your user name. The user name must be a valid user on<br />
the domain that the <strong>OneSight</strong> server is running on. In addition,<br />
the <strong>OneSight</strong> server must be part of the same domain as the<br />
user.<br />
2. Click Log In.<br />
52 <strong>OneSight</strong> <strong>Administrator</strong> <strong>Guide</strong>
Uninstalling <strong>OneSight</strong><br />
Note: If you are using a Firefox browser and you make a mistake<br />
entering your user name or password causing the log in to fail,<br />
restart the browser before trying again.<br />
Uninstalling <strong>OneSight</strong><br />
To remove Empirix <strong>OneSight</strong> from a Windows server, you need to<br />
do the following:<br />
Uninstall <strong>OneSight</strong> using Add/Remove Programs<br />
Uninstall the Data Collector<br />
Remove the database<br />
Delete the Empirix folder<br />
To Uninstall <strong>OneSight</strong> using Add/Remove Programs<br />
1. On the server where Empirix <strong>OneSight</strong> is installed, click Start,<br />
point to Settings, then click Control Panel.<br />
2. In the Control Panel, double-click Add/Remove Programs.<br />
3. On the Install/Uninstall tab, highlight Empirix <strong>OneSight</strong> and<br />
click Add/Remove.<br />
4. Click Yes to confirm and follow the uninstall procedure.<br />
If the Add/Remove Monitor Group dialog box is displayed,<br />
click Remove All, then, in the confirmation dialog box that<br />
follows, click Next.<br />
5. Click Finish in the final dialog box.<br />
6. Click Close to close the Add/Remove Programs dialog box.<br />
Chapter 2: Installing <strong>OneSight</strong> 53
Uninstalling <strong>OneSight</strong><br />
To Uninstall the Data Collector<br />
1. On the server where Empirix <strong>OneSight</strong> is installed, click Start,<br />
point to Settings, then click Control Panel.<br />
2. In the Control Panel, double-click Add/Remove Programs.<br />
3. On the Install/Uninstall tab, highlight Empirix <strong>OneSight</strong> Data<br />
Collector and click Add/Remove.<br />
4. Click Yes to confirm and follow the uninstall procedure.<br />
5. Click Close to close the Add/Remove Programs dialog box.<br />
To Remove the Database<br />
1. Stop the <strong>OneSight</strong> Service.<br />
2. Run the following program:<br />
\Setup\InitDB.exe<br />
3. At the confirmation dialog box, click Continue.<br />
4. Enter the database administrator username and password, then<br />
select the Delete Database check box. When asked to confirm,<br />
click OK.<br />
5. After the database is deleted, click OK to exit InitDB.<br />
6. Remove the backup device file (for example,<br />
<strong>OneSight</strong>_backup.bak). If you are using a remote SQL server, the<br />
file is located on the SQL server machine (not the <strong>OneSight</strong><br />
server).<br />
54 <strong>OneSight</strong> <strong>Administrator</strong> <strong>Guide</strong>
Removing the Data Collector from a Windows machine<br />
To Remove the Empirix Folder<br />
After uninstalling the <strong>OneSight</strong> Server, delete the <strong>OneSight</strong><br />
folder.<br />
After uninstalling the Data Collector, delete the data collector<br />
folder.<br />
Removing the Data Collector from a Windows<br />
machine<br />
1. On the Windows 2003 machine where the Data Collector is<br />
installed, click Start, point to Settings, then click Control Panel.<br />
2. In the Control Panel, double-click Add/Remove Programs.<br />
3. On the Install/Uninstall tab, highlight Empirix <strong>OneSight</strong> Data<br />
Collector(1) and click Add/Remove.<br />
4. In the Add/Remove Monitor Group dialog box, click Remove<br />
All, then, in the confirmation dialog box that follows, click Next.<br />
5. Click Finish in the final dialog box.<br />
6. Click OK to close the Add/Remove Programs dialog box.<br />
Removing the <strong>OneSight</strong> Remote Agent<br />
Removing Remote Agent from a Windows Machine<br />
1. On the Windows machine where the Remote Agent is installed,<br />
click Start, point to Settings, then click Control Panel.<br />
2. In the Control Panel, double-click Add/Remove Programs.<br />
3. On the Install/Uninstall tab, highlight Empirix <strong>OneSight</strong> NT<br />
Remote Agent and click Add/Remove.<br />
Chapter 2: Installing <strong>OneSight</strong> 55
Removing the <strong>OneSight</strong> Remote Agent<br />
4. In the Add/Remove Monitor Group dialog box, click Remove<br />
All, then, in the confirmation dialog box that follows, click Next.<br />
5. Click Finish in the final dialog box.<br />
6. Click OK to close the Add/Remove Programs dialog box.<br />
Removing the UNIX Remote Agent<br />
When the <strong>OneSight</strong> UNIX Remote Agent needs to be reinstalled or<br />
upgraded to the current version, it is recommended that you remove<br />
the existing agent files from your installation directory.<br />
The <strong>OneSight</strong> Remote Agent self-extracting installer only copies<br />
data into the specified destination directory. If you copy or link to<br />
script files using directories other than the installation directory (for<br />
example, the init.d directories), make sure these files are removed as<br />
well.<br />
1. On the machine where the UNIX Remote Agent is installed,<br />
navigate to the <strong>OneSight</strong> installation directory.<br />
2. Verify that the <strong>OneSight</strong> installation directory contains the data<br />
that you intend to remove.<br />
3. Ensure that the Remote Agent is no longer running by issuing<br />
the following command:<br />
./<strong>OneSight</strong>Agent stop<br />
4. Remove the <strong>OneSight</strong> and support directories, as well as the<br />
files they contain. For example, running rm -r ../<strong>OneSight</strong> in<br />
the destination directory removes the necessary directories and<br />
files.<br />
5. Remove any files copied or linked to in directories other than<br />
the specified <strong>OneSight</strong> installation directory.<br />
56 <strong>OneSight</strong> <strong>Administrator</strong> <strong>Guide</strong>
Uninstalling Agent Proxy<br />
Note: This step is important if you have configured the UNIX<br />
Remote Agent to initialize and terminate with the server (for<br />
example, using the /etc/init.d and /etc/rc* directories).<br />
6. Reinstall the UNIX Remote Agent, if appropriate.<br />
Uninstalling Agent Proxy<br />
1. From a command window, type the following:<br />
C:\Empirix\<strong>OneSight</strong>\Proxy> service -remove -param<br />
proxy.properties<br />
2. Delete the service.exe, proxy.exe and proxy.properties files from<br />
the C:\Empirix\<strong>OneSight</strong>\bin directory.<br />
Starting the <strong>OneSight</strong> Service<br />
To start the <strong>OneSight</strong> Service:<br />
1. On the <strong>OneSight</strong> Server, click Start, then Settings, then click<br />
Control Panel.<br />
2. In the Control Panel, double-click Services. (In Windows 2000,<br />
you must first double-click Administrative Tools and then<br />
double-click Services.)<br />
3. In the Services dialog box, highlight Empirix <strong>OneSight</strong> and<br />
click Start.<br />
4. If the Startup value is not ―Automatic,‖ click Startup and select<br />
Automatic.<br />
5. Click Close to close the Services dialog box.<br />
If you are restarting Empirix <strong>OneSight</strong>, the monitors on the<br />
<strong>OneSight</strong> Console’s Status page may be gray until a successful<br />
sample has occurred.<br />
Chapter 2: Installing <strong>OneSight</strong> 57
Stopping the <strong>OneSight</strong> Service<br />
Stopping the <strong>OneSight</strong> Service<br />
To stop the <strong>OneSight</strong> Service:<br />
1. If you are logged in to the <strong>OneSight</strong> Console, log out.<br />
2. On the <strong>OneSight</strong> Server, click Start, Settings, then Control<br />
Panel.<br />
3. In the Control Panel, double-click Services. (In Windows 2000,<br />
you must first double-click Administrative Tools and then<br />
double-click Services.)<br />
4. In the Services dialog box, highlight Empirix <strong>OneSight</strong> and<br />
click Close.<br />
5. Click Close to close the Services dialog box.<br />
Viewing Version and Database Information<br />
To view information about your version of Empirix <strong>OneSight</strong> and<br />
the <strong>OneSight</strong> database:<br />
1. Click the Configure tab.<br />
58 <strong>OneSight</strong> <strong>Administrator</strong> <strong>Guide</strong>
Viewing Version and Database Information<br />
2. Select Version & Licensing.<br />
This dialog box has the following options:<br />
Product Version – Displays the version of Empirix <strong>OneSight</strong><br />
that you are using.<br />
Build Number – Displays the build number for the version of<br />
Empirix <strong>OneSight</strong> that you are using.<br />
Database Name – Displays the name of the <strong>OneSight</strong> database<br />
that you are using.<br />
Database Version – Displays the version number of <strong>OneSight</strong><br />
database that you are using.<br />
Maintenance Expires – Displays the expiration date of the<br />
installed license.<br />
Update License – Opens a dialog box for entering a<br />
new/updated <strong>OneSight</strong> license.<br />
Chapter 2: Installing <strong>OneSight</strong> 59
Viewing Version and Database Information<br />
Console – Displays the type of Console license that determines<br />
the <strong>OneSight</strong> features that are available.<br />
Basic – Includes all <strong>OneSight</strong> features except the following:<br />
Custom Status Views, Attribute Matrix Views, banner menu<br />
inclusion of these features, and configuration of these<br />
features.<br />
Premium – Includes all <strong>OneSight</strong> features.<br />
User Seats – Displays the number of user seats available for the<br />
Console license.<br />
Licenses for User Group –Shows the number of licenses<br />
available and in use by the displayed user group. User Group<br />
licenses can be allocated to specific User Groups using the<br />
options on the Licenses tab under Configure User Groups.<br />
Basic Server Licenses – Displays the number of server licenses<br />
and the number of licenses currently in use.<br />
Advanced Server Licenses – Displays the number of advanced<br />
server licenses and the number of licenses currently in use.<br />
Premium Profile Licenses – Displays the number of premium<br />
profile licenses and the number of licenses currently in use.<br />
Monitor Licenses – Displays the number of monitor licenses and<br />
the number of licenses currently in use.<br />
Network Device Licenses – Displays the number of Network<br />
device licenses and the number of licenses currently in use.<br />
eTEST Visual Script Licenses – Displays the number of e-TEST<br />
Visual Script licenses and the number of licenses currently in<br />
use.<br />
URL Monitor Licenses – Displays the number of URL monitor<br />
licenses and the number of licenses currently in use.<br />
60 <strong>OneSight</strong> <strong>Administrator</strong> <strong>Guide</strong>
Viewing Version and Database Information<br />
<strong>OneSight</strong> Voice Engine Transaction Licenses – Displays the<br />
number of <strong>OneSight</strong> Voice Engine transaction licenses and the<br />
number of licenses currently in use.<br />
<strong>OneSight</strong> Voice Quality Monitor Licenses – Displays the number<br />
of <strong>OneSight</strong> Voice Quality Monitor licenses and the number of<br />
licenses currently in use.<br />
<strong>OneSight</strong> Voice Quality Protocol Licenses – Displays the<br />
protocols that are licensed. For example, ―sip, skinny,‖ etc.<br />
<strong>OneSight</strong> Voice Quality Probe Licenses – Displays the number of<br />
<strong>OneSight</strong> Voice Quality Probe licenses and the number of<br />
licenses currently in use.<br />
Voice Watch Transaction Licenses – Displays the number of<br />
Empirix Voice Watch transaction licenses and the number of<br />
licenses currently in use.<br />
<strong>OneSight</strong> Compound Monitor Licenses – Displays the number of<br />
<strong>OneSight</strong> Compound Monitor licenses and the number of<br />
licenses currently in use.<br />
<strong>OneSight</strong> Call Statistics Licenses – Displays the number of<br />
<strong>OneSight</strong> Call Statistics licenses and the number of licenses<br />
currently in use.<br />
Service Level Module Licenses – Displays the number of Service<br />
Level Module licenses and the number of licenses currently in<br />
use.<br />
Location Licenses – Displays the number of locations that<br />
<strong>OneSight</strong> is configured for and the number of licenses currently<br />
in use.<br />
Chapter 2: Installing <strong>OneSight</strong> 61
Viewing Version and Database Information<br />
How <strong>OneSight</strong> Determines the License Type<br />
Metrics are categorized into the following three types.<br />
Basic – basic metrics measure basic operating system<br />
performance such as CPU, Disk, etc. and cannot be modified.<br />
Premium – premium metrics are metrics defined by the contact<br />
center and cannot be modified.<br />
Advanced – All metrics that are not basic or premium. These<br />
metrics can be modified.<br />
<strong>OneSight</strong> determines the license type for a profile applied to a<br />
system based on the system’s device type:<br />
Advanced Server – All profiles can be applied to this system. If you<br />
are using premium metrics, you must define the system as an<br />
advanced server. Each profile applied to this system consumes one<br />
advanced server license. In addition, each premium profile applied<br />
to this system consumes both an advanced server license and a<br />
premium profile license.<br />
Basic Server – Only basic profiles such as Windows, Linux, Solaris,<br />
UNIX, etc., can be applied to this system. The license consumed is<br />
per system, not per profile.<br />
Network Device – Only profiles with Ping or SNMP metrics can be<br />
applied to this system, otherwise a licensing error will occur. The<br />
license consumed is per system regardless of the number of profiles<br />
applied.<br />
62 <strong>OneSight</strong> <strong>Administrator</strong> <strong>Guide</strong>
Database Maintenance<br />
Database Maintenance<br />
This section explains how to move the <strong>OneSight</strong> database to a<br />
remote SQL server after setup, how <strong>OneSight</strong> backs up the database,<br />
and how to transfer <strong>OneSight</strong> configuration data to another<br />
database.<br />
Using a Remote Database<br />
When you first run Setup, you can choose to use a remote SQL<br />
server. However, if you installed Microsoft SQL Server on the<br />
<strong>OneSight</strong> Server and then decide to move the <strong>OneSight</strong> database to<br />
a remote SQL server, use the steps below.<br />
To move the database, you will be using Enterprise Manager and<br />
Query Analyzer, which are Microsoft SQL Server Client Utilities.<br />
Note: This procedure assumes that the name of the <strong>OneSight</strong><br />
administrative user is ―<strong>OneSight</strong>Admin‖ in the database section of<br />
the OSServer.properties file. The Onesight administrator’s name is<br />
identified with the property Database.UserName in the<br />
OSServer.properties file. If you changed this name, you must edit the<br />
script file <strong>OneSight</strong>Empirix\db\sp_CreateUsers.sql and replace all<br />
occurrences of <strong>OneSight</strong>Admin with the name of the <strong>OneSight</strong><br />
administrative user as it appears in the OSServer.properties file. You<br />
must then execute this script file in a Query Analyzer window to<br />
modify the stored procedure before executing the procedure in step<br />
5 below.<br />
1. Confirm that the remote SQL Server database you intend to use<br />
has the same character set and sort order. The <strong>OneSight</strong><br />
database is configured as US English, dictionary sort-order,<br />
case-insensitive.<br />
2. Stop the Onesight service.<br />
Chapter 2: Installing <strong>OneSight</strong> 63
Database Maintenance<br />
3. Use Enterprise Manager to back up the <strong>OneSight</strong> database (by<br />
default, named <strong>OneSight</strong>). Move the database backup device<br />
file, (<strong>OneSight</strong>_backup.bak, typically located in the mssql7\backup<br />
folder) to the remote SQL server. If you do not see a backup file<br />
with this name, use Enterprise Manager to check the path for<br />
the <strong>OneSight</strong>_backup device.<br />
4. Restore the database on the new server from the backup file.<br />
Note: Make sure you restore the same version of backup that<br />
you created on the other server. SQL Server supports multiple<br />
backups in the same device file.<br />
5. Use Query Analyzer to execute the stored procedure that<br />
creates the users and logins for the remote SQL server.<br />
Assuming the default name of <strong>OneSight</strong>, select the <strong>OneSight</strong><br />
database and execute the following command:<br />
exec SP_createusers '<strong>OneSight</strong>'<br />
6. Use Enterprise Manager to change the password of the<br />
<strong>OneSight</strong>Admin login on the remote SQL server to agree with<br />
the password in the database section of the OSServer.properties<br />
file on the <strong>OneSight</strong> server. (This is necessary only if you have<br />
changed the <strong>OneSight</strong> default password, null, to something<br />
else.)<br />
7. Change the SQL Alias machine specification. Open Enterprise<br />
Manager, then run the Client Network Utility.<br />
Version 2.0<br />
The Server alias is the machine name, and the same machine<br />
name is also specified in the Connection Parameters column.<br />
Change both of these machine name designations to the<br />
machine name of the new HWM database machine and edit the<br />
TCP port number if applicable.<br />
Version 2.1 and above<br />
The Server alias named HWMDatabase has the machine name in<br />
64 <strong>OneSight</strong> <strong>Administrator</strong> <strong>Guide</strong>
Database Maintenance<br />
the Connection Parameters column. Change this machine name<br />
to the machine name for the new HWM database machine and<br />
edit the TCP port number if applicable.<br />
Note: By default, the server alias name is HWMDatabase. The<br />
alias name is based on the specification in the<br />
Database.ServerAlias value in the database section of the<br />
\properties\OSServer.properties file for SQL. The Server alias<br />
string does not need to be changed when moving the database.<br />
8. Use Query Analyzer to confirm that you can connect to the<br />
<strong>OneSight</strong> database on the new server using the <strong>OneSight</strong><br />
administrative user and password as specified in the<br />
OSServer.properties file on the <strong>OneSight</strong> Server.<br />
9. Using Notepad, edit the OSServer.properties file on the <strong>OneSight</strong><br />
Server. Change the ServerName, ServerPort, Detail.DataDirectory,<br />
and Detail.BackupDirectory properties to reflect the location of the<br />
remote SQL server.<br />
10. Restart the <strong>OneSight</strong> service.<br />
Automatic Database Backup<br />
<strong>OneSight</strong> automatically backs up the entire database file every<br />
Saturday at 10:41 pm. The location of the backup file and the name<br />
of the database is defined in the<br />
/empirix/onesight/properties/OSServer.properties file. <strong>OneSight</strong> creates a<br />
*.bak file in the backup directory. You may want to integrate regular<br />
backups of the <strong>OneSight</strong> database backup into your company’s<br />
current data backup routine or procedures.<br />
Some notable entries in this file include:<br />
Database.Detail.DatabaseName=hwm001<br />
Database.Detail.DataDirectory=C:\\Program<br />
Files\\Microsoft SQL Server\\MSSQL\\Data\\<br />
Chapter 2: Installing <strong>OneSight</strong> 65
Database Maintenance<br />
Database.Detail.LogDirectory=C:\\Program<br />
Files\\Mircrosoft SQL Server\\MSSQL\\Data\\<br />
Database.Detail.BackupDirectory=C:\\Program<br />
Files\\Microsoft SQL Server\\MSSQL\\Backup\\<br />
Database.Detail.BackupDeviceName=hwm001_backup<br />
Select Database from the Configuration tab to access the userdefinable<br />
parameters for data retention.<br />
Manual Database Backup<br />
If you are backing up the <strong>OneSight</strong> database manually (using the<br />
SQL Enterprise Manager, for example), stop the <strong>OneSight</strong> service<br />
during backup.<br />
Transferring Configuration Data to Another Database<br />
This section explains how to transfer <strong>OneSight</strong> configuration data<br />
from one database to another. It assumes that you are running SQL<br />
Server 7 or SQL Server 2000 and that the Data Transformation<br />
Service (DTS) is available.<br />
The transfer can be done on a live database if you are not making<br />
configuration changes during this process. This process should NOT<br />
be done on a new database on the same machine on which <strong>OneSight</strong><br />
is running because it may adversely affect <strong>OneSight</strong> performance<br />
and the data transformation process.<br />
Caution: This process is valid only for <strong>OneSight</strong> version 5.1 and<br />
newer. It assumes that a target database ALREADY exits and that<br />
the database contains all of the necessary <strong>OneSight</strong> tables. The<br />
easiest way to do this is to create a new clean and empty database<br />
using the initdb.exe utility found in the \Empirix\<strong>OneSight</strong>\setup<br />
directory.<br />
The data transfer outlined here is used to COPY the configuration<br />
specific tables from the source database and OVERWRITE the tables<br />
66 <strong>OneSight</strong> <strong>Administrator</strong> <strong>Guide</strong>
Database Maintenance<br />
in the newly created target database, while preserving all other<br />
tables needed for operating <strong>OneSight</strong>.<br />
The overall process for copying configuration data requires the<br />
following two steps:<br />
1. Create a new/clean database on the target machine using<br />
initdb.exe.<br />
2. Copy the configuration files as described below.<br />
The configuration data will be transferred using the DTS wizard.<br />
1. Start the DTS wizard by right-clicking on the source database<br />
(the current <strong>OneSight</strong> database) and choosing All Tasks <br />
Export Data.<br />
2. Select the data source, server name, authentication and database<br />
name and click Next.<br />
3. Select the target destination data source, server name,<br />
authentication and database name for the target <strong>OneSight</strong><br />
database (the database that will be updated with the new<br />
configuration). Click Next.<br />
4. Select Copy objects and data between SQL Server databases or<br />
Transfer objects and data between SQL Server databases. Click<br />
Next.<br />
5. Uncheck Copy All Objects and keep the rest of the default<br />
settings.<br />
6. Click Select Objects.<br />
7. Deselect all check boxes except Show All Tables.<br />
8. Select the following tables only. Selecting other tables will<br />
transfer data other than configuration information.<br />
Chapter 2: Installing <strong>OneSight</strong> 67
Database Maintenance<br />
68 <strong>OneSight</strong> <strong>Administrator</strong> <strong>Guide</strong><br />
Tbl_AgentDef<br />
Tbl_AgentFile<br />
Tbl_AgentProperty<br />
Tbl_AgentPropertyList<br />
Tbl_AgentSuptFile<br />
Tbl_AlertDependencyMonitor<br />
Tbl_AlertDependencyMonitorList<br />
Tbl_AlertDependencyNode<br />
Tbl_AlertRespPlanMap<br />
Tbl_AppliedMonitor<br />
Tbl_Atom<br />
Tbl_AttributeSets<br />
Tbl_AttributeValues<br />
Tbl_ChainStep<br />
Tbl_DBUser<br />
Tbl_EntityAgent<br />
Tbl_EntityAttributes<br />
Tbl_EntityType<br />
Tbl_EscalationChain<br />
Tbl_ETestScripts<br />
Tbl_GlobalSetting<br />
Tbl_ID<br />
Tbl_MetricAlertInstanceList<br />
Tbl_MetricAlertList<br />
Tbl_MetricAlertType<br />
Tbl_MetricConfig<br />
Tbl_MetricConfigInstance<br />
Tbl_MetricItem<br />
Tbl_MonitorAttributes<br />
Tbl_MonitoredEntity<br />
Tbl_PlanChain<br />
Tbl_PlanSchedule<br />
Tbl_Profile<br />
Tbl_ProfileAttributes<br />
Tbl_ResponseAction<br />
Tbl_ResponsePlan<br />
Tbl_ResponsePlanTemplate<br />
Tbl_ResponseProperty<br />
Tbl_SavedReport<br />
Tbl_ServiceLevelObjective<br />
Tbl_SLA<br />
Tbl_TimeInterval<br />
Tbl_TimeIntervalPeriod<br />
Tbl_UserExcAttributes
Updating Data Collectors and Remote Agents<br />
Tbl_ItemAgent<br />
Tbl_ItemInstCookie<br />
Tbl_Location<br />
Tbl_LocationDef<br />
Tbl_LocationList<br />
Tbl_MetricAlert<br />
Tbl_MetricAlertInstance<br />
Tbl_UserGroup<br />
Tbl_UserIncAttributes<br />
Tbl_UserViewAttributeSets<br />
Tbl_WebApp<br />
Tbl_WebAppAttributes<br />
Tbl_WebMonitorMap<br />
Tbl_WebUserMap<br />
9. Click OK.<br />
10. Click Append Data.<br />
11. Deselect Use default options and click the Options button.<br />
12. Deselect Copy database users and database roles and click OK.<br />
13. Click Next.<br />
14. Select Run immediately and click Next.<br />
15. Click Finish. The selected tables will be transferred from one<br />
database to the other.<br />
16. It is recommended that you make a full database backup of the<br />
secondary machine.<br />
Updating Data Collectors and Remote Agents<br />
You can update Data Collectors and Remote Agents on remote<br />
machines from the server machine. When you choose to update an<br />
agent, the new files are downloaded to the remote machine along<br />
with a script that does the actual update.<br />
Chapter 2: Installing <strong>OneSight</strong> 69
Updating Data Collectors and Remote Agents<br />
The agent does not need to be removed prior to upgrading nor does<br />
the machine need to be rebooted after upgrading. The agent is<br />
stopped, its status is off-line, the update script updates the agent<br />
with the new files, then restarts the agent.<br />
Note: The update process may take several minutes. During the time<br />
that the agent is stopped, no sampling occurs.<br />
Agents must be running for the remote update to work. The<br />
following agent types can be updated remotely:<br />
Remote Agents – Agent Host Processes (AHP) only, and native<br />
C/C++ agents.<br />
Data Collectors – AHP and Java Host Process (JHP) together.<br />
Remote agent update is not supported for agents with a version<br />
prior to 4.7.465. The <strong>OneSight</strong> server version is displayed above the<br />
table on the Agent Update screen. In addition, the Data Collector or<br />
Remote Agent must have been installed with the auto-update option<br />
turned on.<br />
For UNIX, a signed gzipped tar file is sent from the server to the<br />
agent:<br />
Solaris - sunos_agent_update.tar.gz.sgn<br />
Linux - linux_agent_update.tar.gz.sgn<br />
If these files are not in the correct directory, the server may show<br />
that it cannot update the Remote Agent.<br />
If you are updating a VQ Probe, and the status on the Agent Update<br />
page is, ― No update package available for this version of VQ<br />
Probe,‖ you will need to run the<br />
<strong>OneSight</strong>VQProbePackagesUpdater.exe file on the system where the<br />
VQ Probe is installed. This file can be downloaded from eSupport.<br />
Note that this program restarts the Hammer services.<br />
70 <strong>OneSight</strong> <strong>Administrator</strong> <strong>Guide</strong>
Updating Data Collectors and Remote Agents<br />
To update Data Collectors or Remote Agents:<br />
1. Log in as the <strong>OneSight</strong> administrator.<br />
2. Select Agent Update from the Support menu or go to<br />
agent_update.jsp from the browser window.<br />
This page has the following options:<br />
Select – If an agent is not up to date with the <strong>OneSight</strong> Server<br />
version a check box is displayed for selecting the agent.<br />
IP Address – The IP Address of the remote machine.<br />
Hostname – The host name of the remote machine.<br />
Operating System – The operating system of the remote<br />
machine.<br />
Agent Type – The type of agent, Data Collector or Remote<br />
Agent collector.<br />
Instance – The instance number of the agent on the remote<br />
machine.<br />
Location – The location name of the Data Collector.<br />
Agent Version – The version of the agent. Up to date agents are<br />
displayed in green. Out of date agents are displayed in red.<br />
Chapter 2: Installing <strong>OneSight</strong> 71
Updating Data Collectors and Remote Agents<br />
Package – Displays ―VQ‖ when the agent is a Voice Quality<br />
(VQ) Probe.<br />
Package Version – Displays the VQ Probe version.<br />
Status – Indicates the status of the agent and of the update<br />
process.<br />
Update Available – The agent can be updated and is available.<br />
Not able to update – The agent can not be updated remotely.<br />
Physically update the agent using the installation program.<br />
Up-to-date – The agent is running the same version as the<br />
Server.<br />
Not up-to-date – The agent is running a version that is older<br />
than the <strong>OneSight</strong> Server.<br />
No update package available for this version of VQ Probe –<br />
The data collector is up-to-date and the current version of the<br />
VQ Probe is too old. Download and run the<br />
<strong>OneSight</strong>VQProbePackagesUpdater.exe file from eSupport to<br />
update the VQ Probe. Note that this program restarts the<br />
Hammer services.<br />
Not supported – Remote update is not supported for this older<br />
versions of agents prior to 4.7.465.<br />
Downloading – Updated files are being downloaded to the<br />
remote machine.<br />
Off-line and/or Installing – The remote agent is not running, or<br />
the update files are being installed on the remote machine<br />
and will connect when the installation is complete. The agent<br />
must initially be running to be updated.<br />
Update failed – The update failed. Contact Empirix or<br />
physically update the machine.<br />
72 <strong>OneSight</strong> <strong>Administrator</strong> <strong>Guide</strong>
Updating Data Collectors and Remote Agents<br />
No update package found on server – The update files were<br />
not found in the agent_update directory on the <strong>OneSight</strong><br />
server.<br />
Unknown – There is a problem identifying Remote Agents.<br />
Contact Empirix support for help.<br />
Update disabled at Agent – Occurs if you uncheck the box for<br />
enabling agent update during the original installation.<br />
Internal error 1:AFW is null – There is a problem identifying<br />
Remote Agents. Contact Empirix support for help.<br />
AHP is Off-line – The JHP side of the collector is running, but<br />
the AHP side is not. AHP must be running for the update to<br />
work.<br />
3. Select the agents that you want to update.<br />
4. Click Update. A confirmation page is displayed.<br />
5. Click Update to continue. You can view the status of the update<br />
process in the Status field of the Agent Update screen.<br />
You can review the log file from the update script in the Data<br />
Collector’s or Remote Agent’s bin directory named<br />
do_update.bat_console.txt on Windows or ahp_console.txt on<br />
UNIX.<br />
Chapter 2: Installing <strong>OneSight</strong> 73
Configuring the SNMP Agent<br />
Configuring the SNMP Agent<br />
<strong>OneSight</strong> can publish Monitor, Alert, and internal performance data<br />
via an SNMP Agent. Select SNMP Agent from the Configure menu.<br />
Use this dialog to enable and configure the SNMP Agent.<br />
Enable SNMP Agent – The check box controls whether to enable the<br />
SNMP Agent.<br />
Enable Monitor Data – The checkbox can be used to specifically<br />
enable SNMP access to <strong>OneSight</strong> Monitor performance data.<br />
Enable Alert Data – The checkbox can be used to specifically enable<br />
SNMP access to <strong>OneSight</strong> Alert data.<br />
Enable <strong>OneSight</strong> Internal Data – The checkbox can be used to<br />
specifically enable SNMP access to <strong>OneSight</strong>’s internal<br />
performance data.<br />
Port – Specifies the port number used on this system by the SNMP<br />
agent. Typically, this is port 161.<br />
Community – Specifies the SNMP password of the system.<br />
74 <strong>OneSight</strong> <strong>Administrator</strong> <strong>Guide</strong>
C h a p t e r 3<br />
Getting Started<br />
To use <strong>OneSight</strong>, you must configure at least one monitor group<br />
and supply information about the web components you want to<br />
monitor and the action plans you want to use to correct problems<br />
that are discovered. This chapter provides procedures for creating<br />
the monitor groups, monitors, and alerts you need to get started with<br />
<strong>OneSight</strong>.<br />
Note: If you are not logged on as an administrator, you cannot<br />
perform these operations.<br />
Empirix <strong>OneSight</strong> has these basic elements:<br />
<strong>OneSight</strong> Server – This dedicated Windows server is where the<br />
majority of <strong>OneSight</strong> software, the <strong>OneSight</strong> Console, database,<br />
and web server software, is installed. The Console is browserbased<br />
and can be accessed either from the <strong>OneSight</strong> Server or<br />
from a client machine.<br />
Contact Channel Components – These are the machines, systems,<br />
devices, or other parts of your customer service site that you want<br />
Empirix <strong>OneSight</strong> to monitor. Empirix <strong>OneSight</strong> can discover<br />
these components through an automatic process or you can<br />
specify these components yourself.<br />
<strong>OneSight</strong> needs information about the web components that you<br />
want to monitor and the action plans that you want to use to correct<br />
problems that are discovered. To start using <strong>OneSight</strong>, you must<br />
add at least one monitor group, supplying information needed to<br />
monitor and manage that monitor group.<br />
75
Deciding Which Monitors to Use<br />
The following picture introduces the fundamental components of a<br />
<strong>OneSight</strong> monitor group and shows how they relate to one another.<br />
When you configure <strong>OneSight</strong> to monitor your web site, you will<br />
add these kinds of <strong>OneSight</strong> components:<br />
The purpose and relationship of <strong>OneSight</strong> components is described<br />
below:<br />
Monitor Group – A collection of monitors used to measure and<br />
manage the availability and performance of your web site. Use<br />
monitor groups to group together monitors in any way that is logical<br />
to you.<br />
Monitor – Monitors are added to monitor groups. A monitor checks<br />
the behavior of a specific web component using a defined set of<br />
performance standards. <strong>OneSight</strong> includes monitors for components<br />
76 <strong>OneSight</strong> <strong>Administrator</strong> <strong>Guide</strong>
Deciding Which Monitors to Use<br />
such as URLs that are critical to the web site, monitors for Internet<br />
servers such as FTP, DNS, or Mail, and monitors for databases, web<br />
servers and operating systems.<br />
Alert – One or more alerts are configured for each monitor. An alert<br />
does three things:<br />
Defines a problem condition, such as an exceeded threshold or a<br />
sample failure, that the monitor should detect.<br />
Specifies what <strong>OneSight</strong> should do if the problem occurs. When<br />
the monitor detects this problem condition, the alert can either<br />
trigger an action plan, change a monitor’s health status, or do<br />
both.<br />
Ranks the seriousness of the problem as Critical, Warning, or<br />
Informational.<br />
Action Plan – Specifies a sequence of actions that you want<br />
<strong>OneSight</strong> to perform if a monitor detects a problem. An action plan<br />
is invoked by an alert. The alert triggers the action plan to respond<br />
to problem conditions. Once an action plan is defined, it can be<br />
assigned to many alerts.<br />
Action – A specific response that you want <strong>OneSight</strong> to make. For<br />
example, sending an e-mail or a SNMP trap notification are possible<br />
actions. Actions are added to action plans. When an alert triggers an<br />
action plan, the actions in the plan are performed sequentially. Once<br />
an action is defined, it can be added to many action plans.<br />
Deciding Which Monitors to Use<br />
To monitor the status of servers, URLs, and URL transactions<br />
associated with your web site, use the monitors listed below.<br />
Chapter 3: Getting Started 77
Deciding Which Monitors to Use<br />
If you want to know…<br />
Is my web site’s URL functioning?<br />
Is the sequence of URL used in a<br />
customer transaction working smoothly?<br />
Is my DNS server resolving domain<br />
names?<br />
Is my FTP server transferring requested<br />
files?<br />
Is my Mail server up and functioning<br />
properly?<br />
Is a machine associated with my web site<br />
up and running?<br />
Is the application running on a specific<br />
port available?<br />
Are the services on my Windows server<br />
available?<br />
I usually check one Perfmon metric to<br />
figure out what’s going on with a<br />
particular Windows machine. Can I<br />
monitor that metric with <strong>OneSight</strong>?<br />
Can I check on the results of a query I<br />
usually run to check on my database?<br />
Can I check on a specific SNMP metric<br />
on a single machine?<br />
Do this...<br />
Create a URL monitor.<br />
Create an Oracle Test<br />
for Web Applications<br />
Transaction monitor.<br />
Create a DNS monitor.<br />
Create an FTP monitor.<br />
Create a Mail monitor.<br />
Create a Ping monitor.<br />
Create a Port monitor.<br />
Create a Service<br />
monitor.<br />
Create a Perfmon<br />
monitor.<br />
Create a Database<br />
monitor.<br />
Create an SNMP<br />
monitor.<br />
78 <strong>OneSight</strong> <strong>Administrator</strong> <strong>Guide</strong>
Tips On Using <strong>OneSight</strong><br />
Can I check for specific SNMP Trap<br />
messages?<br />
How can I monitor multiple system<br />
components such as operating systems,<br />
databases, and web servers?<br />
Create an SNMP Trap<br />
monitor.<br />
Create a profile<br />
monitor.<br />
Tips On Using <strong>OneSight</strong><br />
Use the guidelines below to implement your monitor groups and use<br />
<strong>OneSight</strong> to monitor them:<br />
Shutting Down and Restarting <strong>OneSight</strong><br />
You can open the <strong>OneSight</strong> Console and close it at any time, and<br />
you can log in from remote machines. This does not affect the<br />
<strong>OneSight</strong> service that is running continuously. You can start and<br />
stop <strong>OneSight</strong> from the Services dialog box in the Windows<br />
Control Panel. In most cases, this is not necessary. Remember that<br />
<strong>OneSight</strong> is gathering time-based data on your monitor group’s<br />
machines; therefore, stopping <strong>OneSight</strong> affects that data.<br />
Opening the <strong>OneSight</strong> Console From a Remote Machine<br />
To connect to <strong>OneSight</strong> from a remote machine, use the following<br />
URL in your browser:<br />
http://:8080<br />
Chapter 3: Getting Started 79
Tips On Using <strong>OneSight</strong><br />
Modifying <strong>OneSight</strong> Profiles<br />
If you have already applied a system profile to multiple machines,<br />
modifying that profile changes the monitoring criteria for all<br />
machines associated with that profile. At the beginning, it is better<br />
to apply a profile to a small set of machines and make sure it is<br />
reflecting status appropriately. After making any necessary<br />
modifications, you can then apply the updated profile to additional<br />
machines.<br />
<strong>OneSight</strong> profiles for closely related machines share metrics. For<br />
example, modifying the metric for an NT profile also modifies that<br />
metric if it is included in the Windows 2000 profile.<br />
Finding System Information<br />
You can have <strong>OneSight</strong> find the data sources and web components<br />
on the systems in your monitor group, or you can add the<br />
information yourself. Are you already well informed about the<br />
makeup of your web site? If so, you can quickly add system<br />
information yourself.<br />
Empirix <strong>OneSight</strong> includes Data Collectors and Remote Agents for<br />
Windows 2000/2003 and Remote Agents for UNIX (Solaris). A<br />
profile monitor for a UNIX operating system or an Apache Web<br />
Server on Solaris requires a UNIX Remote Agent. In addition to<br />
providing configuration information, be sure to install the UNIX<br />
Remote Agent in these cases. Data Collectors and Remote Agents<br />
can also be used to discover system information without providing<br />
detailed authentication information.<br />
Interpreting Status and Report Information<br />
The time of day information in all Empirix <strong>OneSight</strong> status pages,<br />
alerts, action plans, and reports are based on the time zone of the<br />
Empirix <strong>OneSight</strong> server. If you are connecting to the server from a<br />
80 <strong>OneSight</strong> <strong>Administrator</strong> <strong>Guide</strong>
Tuning <strong>OneSight</strong><br />
Database Backup<br />
Tuning <strong>OneSight</strong><br />
browser in a different time zone, no adjustment is made for the<br />
local time zone.<br />
The <strong>OneSight</strong> database stores all user configuration and historical<br />
sample measurement data. <strong>OneSight</strong> automatically backs up the<br />
entire database file every Saturday at 10:41 pm. See Database<br />
Maintenance in Chapter 2 for more information.<br />
After you have created a monitor group and set up a few monitors,<br />
look at the status information displayed on the <strong>OneSight</strong> Console.<br />
If you see Warning or Critical, consider which of the following may<br />
be true:<br />
There is a problem with the machine you are monitoring. That<br />
means <strong>OneSight</strong> is doing exactly what you want it to do.<br />
There is a problem with the default definition of how this<br />
monitor should operate. For example, the default definition of a<br />
problem with a full disk may be set too high for the typical<br />
amount of disk space you have on these machines. In this case,<br />
you need to tune <strong>OneSight</strong>.<br />
The way you perform this tuning depends on the kind of monitor<br />
involved:<br />
Chapter 3: Getting Started 81
Tuning <strong>OneSight</strong><br />
Modifying a Profile<br />
For a dedicated monitor (for example, a Ping monitor), you can<br />
change the setting for the monitor. Select the monitor in the<br />
Monitor Group Editor and click Modify. Click the Alerts tab and<br />
change the settings for the particular alert that is not being<br />
reported as you wish. Dedicated monitors include a default<br />
sample failure alert. In most dedicated monitors, you can add<br />
additional alerts.<br />
If you are setting up a dedicated monitor, you can use the Test<br />
button to confirm that your settings will locate and perform the<br />
initial operation for that monitor. Always use the Test button if<br />
you are not seeing the results you expect after you add or<br />
reconfigure a monitor.<br />
For a profile monitor (for example, a Windows operating system<br />
monitor), you can specify whether a profile metric should<br />
monitor a particular system component in the Monitor Editor.<br />
This is probably the quickest way to address the change for a<br />
single monitor. However, if you want to make the change for<br />
multiple machines, use the procedure below.<br />
Profiles include a default set of metrics for commonly monitored<br />
monitor groups. <strong>OneSight</strong> includes a series of default profiles, but<br />
you can also modify a profile yourself.<br />
For example, if you want to change the warning about full disk<br />
space, you can:<br />
Change the threshold (for example, from 70 percent to 90<br />
percent)<br />
Change the kind of notification associated with the threshold<br />
(warn once, then change back to Good)<br />
Remember that if you have already applied a system profile to<br />
multiple machines, modifying that profile changes the monitoring<br />
82 <strong>OneSight</strong> <strong>Administrator</strong> <strong>Guide</strong>
Tuning <strong>OneSight</strong><br />
criteria for all machines associated with that profile. At the<br />
beginning, it is better to apply a profile to a small set of machines<br />
and make sure it is reflecting status appropriately. After making any<br />
necessary modifications, you can then apply the updated profile to<br />
additional machines.<br />
<strong>OneSight</strong> profiles for closely related machines share metrics.<br />
Modifying the metric for an NT profile, for example, also modifies<br />
that metric if it is included in the Windows 2000 profile. Refer to<br />
Chapter 6 for more information.<br />
Chapter 3: Getting Started 83
Tuning <strong>OneSight</strong><br />
[This page intentionally left blank.]<br />
84 <strong>OneSight</strong> <strong>Administrator</strong> <strong>Guide</strong>
C h a p t e r 4<br />
Configuring Monitor Groups<br />
An Empirix monitor group groups together the various components<br />
of your web site, such as machines, databases, and web processes,<br />
and monitors them as an integrated whole.<br />
The <strong>OneSight</strong> Console shows the status of your monitor groups. To<br />
configure a monitor group, you will set up a series of monitors,<br />
some of which you create by matching a profile (included with<br />
<strong>OneSight</strong>) to the web component you want to monitor. For<br />
<strong>OneSight</strong>, a web component may be an application (such as Oracle),<br />
a URL or series of URLs that are critical to your web site, an<br />
Internet server (such as FTP, DNS, or Mail), or the operating<br />
systems of the machines that service your web site.<br />
Part of setting up profile monitors is identifying which machines<br />
and system components <strong>OneSight</strong> can monitor. Systems, and<br />
information about the components on each system, must be<br />
identified so that <strong>OneSight</strong> profiles can be used to create monitors<br />
for the web components running on those machines. <strong>OneSight</strong> can<br />
find the systems and system components for you or you can<br />
manually add information about the systems and system<br />
components that you want <strong>OneSight</strong> to monitor.<br />
The Add Monitor dialog box is where you apply dedicated monitors<br />
and profiles to web components to create monitors. The Profile<br />
Manager is where you control which profiles are available to be<br />
applied.<br />
Monitor group monitors generate alerts based on events. An event is<br />
web component performance, such as an exceeded threshold or a<br />
sample failure, that you want to know about. All monitors generate<br />
85
Adding a Monitor Group<br />
at least one type of alert. For many monitors, you can add more<br />
performance criteria that generate additional kinds of alerts.<br />
In response to an alert, <strong>OneSight</strong> can trigger an action plan; change<br />
a monitor’s health; do both, in some cases; or do nothing. The Alert<br />
Editor is where you define an alert for a monitor and define the<br />
response for an alert. The Configure Action Plans page is where<br />
you manage the action plans used by applied monitors.<br />
Adding a Monitor Group<br />
In Empirix <strong>OneSight</strong>, monitors are always used as part of a monitor<br />
group. So to use <strong>OneSight</strong>, you must begin by creating at least one<br />
monitor group. You can then create monitors either from within a<br />
monitor group or in the <strong>OneSight</strong> Monitors configuration. You use<br />
monitor groups to group together monitors in any way that seems<br />
logical to you.<br />
Monitors you create from within a monitor group are automatically<br />
part of that monitor group and can be added to any other monitor<br />
group using the Monitors configuration. Monitors you create from<br />
the Monitors configuration can be added to any existing monitor<br />
group(s). Refer to Chapter 5 for information on adding monitors.<br />
Following are the broad steps for adding a monitor group and<br />
monitors:<br />
1. Enter the name and a description of the monitor group as<br />
described below.<br />
2. Add monitors as described below and in Chapter 5.<br />
3. Verify that the monitors are performing as expected as<br />
described in Chapter 5.<br />
4. For each monitor, specify responses for alerts (optional) as<br />
described later in this chapter.<br />
86 <strong>OneSight</strong> <strong>Administrator</strong> <strong>Guide</strong>
Adding a Monitor Group<br />
5. Define action plans that are used to respond to alerts (optional)<br />
as described later in this chapter.<br />
To create a new monitor group:<br />
1. Click the Configure menu.<br />
2. Click Monitor Groups to open the Configure Monitor Groups<br />
page.<br />
The Configure Monitor Groups page lists the monitor groups<br />
that <strong>OneSight</strong> is currently set up to monitor. You can add,<br />
modify, enable, disable, or remove monitor groups to configure<br />
how <strong>OneSight</strong> will monitor the applications.<br />
Use these options to identify and manage <strong>OneSight</strong> monitor<br />
groups. The Monitor Group list includes all monitor groups that<br />
are configured for Empirix <strong>OneSight</strong>.<br />
Enable – The check box adjacent to each monitor group<br />
controls whether or not the monitor group is currently in effect.<br />
When selected, the monitor group is enabled. When cleared, the<br />
monitor group is disabled. Disabled monitor groups will not<br />
Chapter 4: Configuring Monitor Groups 87
Adding a Monitor Group<br />
participate in health monitoring, alerts, or execution of action<br />
plans.<br />
Name – The Name column identifies the monitor group. This<br />
name will appear in all <strong>OneSight</strong> reports and display pages that<br />
show the status of this monitor group.<br />
User Group – Displays the user group to which this monitor<br />
group belongs.<br />
Description – Provides information to help you differentiate this<br />
monitor group from the others that you are monitoring.<br />
3. Click Add. The Monitor Group Editor opens.<br />
Use these options to identify the monitor group:<br />
Name – Type the name you want to use to identify this monitor<br />
group. This name will appear in all <strong>OneSight</strong> reports and<br />
display pages that show the status of this monitor group.<br />
88 <strong>OneSight</strong> <strong>Administrator</strong> <strong>Guide</strong>
Adding a Monitor Group<br />
Description – Type in information that allows you to<br />
differentiate this monitor group from all other monitor groups<br />
that you are monitoring with <strong>OneSight</strong>.<br />
The Monitor Group Editor has the following tabs for<br />
configuring the monitor group:<br />
Monitors – Shows all of the monitors that are in effect for the<br />
current monitor group. Use options on the Monitors tab to add,<br />
modify, or remove monitors for your monitor group. You can<br />
also enable or disable individual monitors.<br />
Status Chart – Use options on this tab to specify which monitor<br />
should display on the <strong>OneSight</strong> Status page as charted data for<br />
this monitor group.<br />
Health – Use options on this tab to set up an action plan that is<br />
triggered when the monitor group goes into a Warning state, an<br />
action plan that is triggered when the monitor group goes into a<br />
Critical state, and an action plan that is triggered when the<br />
monitor group returns to a Good state.<br />
For web farm management, settings are available that allow you<br />
to group a single profile monitor type and specify how many<br />
monitors of this type contribute to the health state of the<br />
monitor group.<br />
Alert Dependencies – Use options on this tab to specify which<br />
other monitor(s) this monitor depends upon for alerts for this<br />
monitor group. Dependent monitors still display alerts within<br />
<strong>OneSight</strong>. However, action plans for dependent monitors are<br />
suppressed.<br />
Attributes – Contains the options for specifying which attributes<br />
are applied to this monitor group for Status page sorting.<br />
Smartlink – Contains the options for specifying a link to<br />
associate with the monitor group.<br />
Chapter 4: Configuring Monitor Groups 89
Modifying a Monitor Group<br />
Down Time – Contains the options for applying downtime<br />
schedules to this monitor group.<br />
4. Type the monitor group’s Name and Description.<br />
This information appears in the Name and Description columns<br />
on the Configure Monitor Groups page. This name and<br />
description are also used throughout <strong>OneSight</strong> to identify the<br />
monitor group.<br />
5. Add one or more monitors to the monitor group. Refer to<br />
Chapter 5.<br />
6. Click OK.<br />
Modifying a Monitor Group<br />
If you know which monitor group you want to configure, click<br />
Modify on the right side of the monitor group name on the <strong>OneSight</strong><br />
Status page.<br />
To select a monitor group from a list:<br />
1. Click the Configure menu.<br />
90 <strong>OneSight</strong> <strong>Administrator</strong> <strong>Guide</strong>
Modifying a Monitor Group<br />
2. Click Monitor Groups to open the Monitor Groups page.<br />
The Configure Monitor Groups page lists the monitor groups<br />
that <strong>OneSight</strong> is currently set up to monitor. You can add,<br />
modify, enable, disable, or remove monitor groups to configure<br />
how <strong>OneSight</strong> will monitor the applications.<br />
Use these options to identify and manage <strong>OneSight</strong> monitor<br />
groups. The Monitor Group list includes all monitor groups that<br />
are configured for Empirix <strong>OneSight</strong>.<br />
Check Box – The check box adjacent to each monitor group<br />
controls whether or not the monitor group is currently in effect.<br />
When selected, the monitor group is enabled. When cleared, the<br />
monitor group is disabled. Disabled monitor groups will not<br />
participate in health monitoring, alerts, or execution of action<br />
plans.<br />
Name – The Name column identifies the monitor group. This<br />
name will appear in all <strong>OneSight</strong> reports and display pages that<br />
show the status of this monitor group.<br />
Description – Provides information to help you differentiate this<br />
monitor group from the others that you are monitoring.<br />
Chapter 4: Configuring Monitor Groups 91
Modifying a Monitor Group<br />
3. Click the monitor group you want to work with, then click<br />
Modify to open the Monitor Group Editor.<br />
The Monitors tab lists all of the monitors that are in effect for<br />
the current monitor group and has the following options to<br />
identify and manage the monitors that are configured for the<br />
current monitor group:<br />
Add New – Displays the Add Monitor dialog box for adding a<br />
new monitor.<br />
Add Existing – Displays the Select Existing Monitor dialog box<br />
for adding an already created monitor to the monitor group.<br />
Clone – Creates a copy of the selected monitor that can then be<br />
modified.<br />
Modify – Displays the configuration dialog box for the selected<br />
monitor.<br />
Remove – Removes the selected monitor from the monitor<br />
group.<br />
92 <strong>OneSight</strong> <strong>Administrator</strong> <strong>Guide</strong>
Modifying a Monitor Group<br />
Check All – Selects all monitors.<br />
Uncheck All – Deselects all monitors.<br />
Check Box – The check box adjacent to each monitor controls<br />
whether or not the monitor is currently in effect. When selected,<br />
the monitor is enabled. When cleared, the monitor is disabled.<br />
Disabled monitors will not contribute to the measurement of the<br />
monitor group’s health.<br />
Monitors Settings – Lists by name the types of monitors that are<br />
configured for the current monitor group.<br />
Name – The Name column usually identifies the monitor type<br />
and the machine, server, or host that is being monitored. You<br />
can specify a name when you add the monitor to the monitor<br />
group.<br />
The Monitor Group Editor has the following tabs for<br />
configuring the monitor group:<br />
Monitors – Shows all of the monitors that are in effect for the<br />
current monitor group. Use options on the Monitors tab to<br />
add, modify, or remove monitors for your monitor group.<br />
You can also enable or disable individual monitors.<br />
Status Chart – Use options on this tab to specify which<br />
monitor should display on the <strong>OneSight</strong> Status page as<br />
charted data for this monitor group.<br />
Health – Use options on this tab to set up an action plan that<br />
is triggered when the monitor group goes into a Warning<br />
state, an action plan that is triggered when the monitor group<br />
goes into a Critical state, and an action plan that is triggered<br />
when the monitor group returns to a Good state.<br />
For web farm management, settings are available that allow<br />
you to group a single profile monitor type and specify how<br />
Chapter 4: Configuring Monitor Groups 93
Modifying a Monitor Group<br />
many monitors of this type contribute to the health state of<br />
the monitor group.<br />
Alert Dependencies – Use options on this tab to specify which<br />
other monitor(s) this monitor depends upon for alerts for this<br />
monitor group. Dependent monitors still display alerts within<br />
<strong>OneSight</strong>. However, action plans for dependent monitors are<br />
suppressed.<br />
Attributes – Contains the options for specifying which<br />
attributes are applied to this monitor group for Status page<br />
sorting.<br />
Smartlink – Contains the options for specifying a link to<br />
associate with the monitor group.<br />
Down Time – Contains the options for applying downtime<br />
schedules to this monitor group.<br />
94 <strong>OneSight</strong> <strong>Administrator</strong> <strong>Guide</strong>
Modifying a Monitor Group<br />
4. Monitors configured as part of another monitor group or using<br />
the Monitors configuration can be added to any other monitor<br />
group. To add an existing monitor to the monitor group, click<br />
Add Existing. Refer to Chapter 5 for instruction on creating a<br />
new monitor.<br />
This dialog box has the following options:<br />
Name – The Name column identifies the monitor. This name<br />
will appear in all <strong>OneSight</strong> reports and display pages that show<br />
the status of this monitor.<br />
Chapter 4: Configuring Monitor Groups 95
Specifying the Status Chart Data Source<br />
Specifying the Status Chart Data Source<br />
The <strong>OneSight</strong> Status page shows the current health of each monitor<br />
group. Included in the display for each monitor group is a status<br />
chart. Use options on the Status Chart tab to configure which<br />
applied monitor supplies data for the chart display on the <strong>OneSight</strong><br />
Status page.<br />
To specify the Status Chart data source:<br />
1. Open the Status Chart tab in the Monitor Group Editor using<br />
one of the following methods:<br />
On the Status page, click the monitor group to see status<br />
details. Click the report frame with the text Click to Configure<br />
Status Chart<br />
Click the Modify button associated with the monitor group,<br />
and then click the Status Chart tab.<br />
This dialog box has the following options:<br />
Derive Status Chart Data From Monitor – Select any monitor on<br />
the list to specify that it should supply data for the monitor<br />
group status chart.<br />
96 <strong>OneSight</strong> <strong>Administrator</strong> <strong>Guide</strong>
Specifying the Status Chart Data Source<br />
If you select a profile monitor, you can specify which metric<br />
within that profile should be used to supply data for the monitor<br />
group status chart.<br />
Note: If the monitor name contains the following special<br />
characters, they will not be displayed in the name in the drop<br />
down list: “”, and “&”.<br />
Derive Status Chart Data From Metric – The list shows all of the<br />
metrics available for the selected monitor. Select the metric you<br />
want to use for the status chart.<br />
If you selected a dedicated monitor in the Derive Status Chart<br />
Data From Monitor list, the Derive Status Chart Data From Metric<br />
setting is unavailable. For dedicated monitors, only a single<br />
metric source is available to supply data for the status chart.<br />
2. Select a monitor in the Derive Status Chart Data From Monitor<br />
list.<br />
The Monitors list shows all of the monitors that are currently<br />
set up for this monitor group. Information collected by the<br />
monitor that is selected will be displayed on the <strong>OneSight</strong><br />
Status page as charted data.<br />
If you select a profile monitor, use the Derive Status Chart Data<br />
From Metric setting to specify which metric within that system<br />
monitor profile should be used to supply data for the monitor<br />
group status chart.<br />
If you select a dedicated monitor, the Derive Status Chart Data<br />
From Metric setting is unavailable. For dedicated monitors, only<br />
a single metric source is available to supply data for the status<br />
chart.<br />
3. If you chose to derive data from a profile monitor, select one of<br />
the profile’s metrics in the Derive Status Chart Data From<br />
Metric list.<br />
Chapter 4: Configuring Monitor Groups 97
Specifying Action Plans<br />
The list shows all of the metrics available for the selected<br />
monitor. Select the metric you want to use for the status chart.<br />
Information collected by the metric that is selected is displayed<br />
on the <strong>OneSight</strong> Status page and the <strong>OneSight</strong> Status Details<br />
page as charted data.<br />
Specifying Action Plans<br />
The Health Tab of the Monitor Group Editor is where you specify<br />
the action plan that is triggered when the monitor group goes into a<br />
Warning state, Critical state, or returns to a Good state. Additional<br />
settings are provided to assist with web farm management. Refer to<br />
Chapter 8 for instructions on creating action plans.<br />
Use these options to mange monitor group health:<br />
When the Monitor Group Is in Warning State Respond by – Specify<br />
how you want to respond when the monitor group enters a Warning<br />
state by selecting an action plan from the list. Options displayed in<br />
this list represent previously configured plans. To create a new plan<br />
for this condition, select from the list.<br />
When the Monitor Group Is in Critical State Respond by – Specify<br />
how you want to respond when the monitor group enters a Critical<br />
state by selecting an action plan from the list. Options displayed in<br />
this list represent previously configured plans. To create a new plan<br />
for this condition, select from the list.<br />
When the Monitor Group Returns to Good State Respond by –<br />
Specify how you want to respond when the monitor group returns to<br />
a Good state by selecting an action plan from the list. Options<br />
displayed in this list represent previously configured plans. To<br />
create a new plan for this condition, select from<br />
the list.<br />
98 <strong>OneSight</strong> <strong>Administrator</strong> <strong>Guide</strong>
Specifying Alert Dependencies<br />
Specifying Alert Dependencies<br />
The <strong>OneSight</strong> Alert Dependencies page shows associations between<br />
systems and devices being monitored in the monitor group. Use the<br />
options on the Alert Dependencies tab to configure which monitors<br />
are dependent upon other monitors for action plan alerting<br />
purposes.<br />
To open the Alert Dependencies tab in the Monitor Group Editor:<br />
1. Click the Modify button associated with the monitor group on<br />
the Status Page.<br />
2. Click the Alert Dependencies tab.<br />
The Alert dependencies tree automatically lists all monitors and<br />
profiles configured for the monitor group in the Monitors page.<br />
This tab is used to specify which other monitor(s) this monitor<br />
depends upon for alerts for this monitor group. The Alert<br />
Chapter 4: Configuring Monitor Groups 99
Specifying Alert Dependencies<br />
Dependencies tree provides for the following alerting<br />
contingencies:<br />
Allow a single monitor to belong to multiple monitor groups.<br />
Allow a monitor to be dependent on another.<br />
Restrict the action plans of dependent monitors based on the<br />
health of the parent.<br />
Allow restriction of action plans based on the number of<br />
monitors with health problems.<br />
The <strong>OneSight</strong> Alert Dependencies page lets you configure the<br />
associations between systems and devices being monitored in<br />
the monitor group. Use the options on the Alert Dependencies<br />
tab to configure which monitors are dependent upon other<br />
monitors for action plan alerting purposes.<br />
An alert dependency relationship determines which monitor<br />
Action Plan is triggered for Warning or Critical state alert<br />
notifications. The Alert Dependency tree can include nested<br />
monitors. The following list describes parent and dependent<br />
monitor action plan priority:<br />
Alerts in reports are not affected.<br />
Action plans for a monitor or Alert Dependency node are<br />
prevented from being published if a parent has worse health.<br />
A Warning action plan would not be triggered if a parent<br />
node has a Warning or Critical alert.<br />
A Critical action plan will be triggered if a parent node has a<br />
Warning alert.<br />
Dependent monitors still display alerts within the <strong>OneSight</strong><br />
status. The following list describes how the health state color is<br />
determined for monitors and Alert Dependency nodes:<br />
100 <strong>OneSight</strong> <strong>Administrator</strong> <strong>Guide</strong>
Specifying Alert Dependencies<br />
Monitor’s color is always the health of the individual<br />
monitor.<br />
Color reflects the worst color of dependents and internal<br />
monitors.<br />
Dependents health in turn is determined by the health of it’s<br />
dependent nodes and internal monitors.<br />
You add nodes and arrange the associations between existing<br />
monitors and profiles using the arrow buttons on the Alert<br />
Dependencies page. Select a dependency tree node or monitor<br />
and then use the arrow buttons to move the node or monitor in<br />
the tree hierarchy.<br />
When you add a node to the Alert Dependency tree, you specify<br />
a name and the number of monitors that must be in a Warning<br />
or Critical state before that node is in an alert state. The<br />
following conditions apply to Alert Dependency nodes:<br />
Number in Warning or Critical state refers ONLY to<br />
monitors.<br />
Alert Dependency node holds state for monitors under node.<br />
Dependency is between nodes.<br />
The Alert dependency tree has the following icons:<br />
Closed node – Click the icon or double-click the name to<br />
expand the node and view child nodes and monitors.<br />
Open node – Click the icon or double-click the name to collapse<br />
the node and hide child nodes and monitors.<br />
Dependency tree node – Use Add Node, Modify, and Remove to<br />
define nodes and the dependency node responses for the<br />
monitors below the node. Use the arrow buttons to move<br />
dependency nodes within the tree hierarchy.<br />
Chapter 4: Configuring Monitor Groups 101
Specifying Alert Dependencies<br />
Monitor node – The Alert dependencies tree automatically lists<br />
all monitors and profiles configured for the monitor group in<br />
the Monitors page. Use the arrow buttons to move monitors<br />
within the tree hierarchy.<br />
4. Follow the procedures below.<br />
Defining Action Plan Alerts<br />
To define action plan alerts for the top level dependency node:<br />
1. On the Alert Dependencies tab, select the top level monitor<br />
group name and click Modify. The Dependency Node Editor<br />
opens.<br />
The Dependency Node Editor lets you specify the action plan to<br />
use if the specified number of monitors below the dependency<br />
tree node go into an alert state. It has the following options:<br />
Name - Defines a name for the dependency node.<br />
This dependency node is in good state unless [ # ] monitors are in<br />
a Critical or Warning state – Specify the number of monitors<br />
below the dependency node that must be in Warning or Critical<br />
State before the dependency node triggers the specified action<br />
plan alert(s).<br />
2. Specify the Warning State, Critical State, and returning to Good<br />
State action plan options for the top level node of the<br />
dependency tree.<br />
102 <strong>OneSight</strong> <strong>Administrator</strong> <strong>Guide</strong>
Specifying Alert Dependencies<br />
3. Specify the number of monitors below the dependency node<br />
that must be in Warning or Critical State before the dependency<br />
node triggers the specified action plan alert(s).<br />
4. Click OK to close the Dependency Node Editor.<br />
Adding Dependency Nodes<br />
To add dependency nodes:<br />
1. On the Alert Dependencies tab, select the level where you want<br />
to add the node and click Add Node. The Dependency Node<br />
Editor opens.<br />
The Dependency Node Editor lets you specify the action plan to<br />
use if the specified number of monitors below the dependency<br />
tree node go into an alert state. It has the following options:<br />
Name - Defines a name for the dependency node.<br />
This dependency node is in good state unless [ # ] monitors are in<br />
a Critical or Warning state – Specify the number of monitors<br />
below the dependency node that must be in Warning or Critical<br />
State before the dependency node triggers the specified action<br />
plan alert(s).<br />
2. Enter a name for the dependency node.<br />
Chapter 4: Configuring Monitor Groups 103
Adding a Smartlink to a Monitor Group<br />
3. Specify the number of monitors below the dependency node<br />
that must be in Warning or Critical State before the dependency<br />
node triggers the specified action plan alert(s).<br />
4. Click OK to close the Dependency Node Editor.<br />
5. The new dependency node is added at the same level selected in<br />
step one.<br />
6. Use the arrow buttons to move dependency nodes and monitors<br />
to create the tree hierarchy.<br />
Adding a Smartlink to a Monitor Group<br />
The SmartLink tab lets you specify a URL to associate with the<br />
monitor group. The URL is available on the Status Details Page.<br />
URL – Enter the URL that you want to associate with this monitor or<br />
metric. The URL can include specific substitution variables.<br />
Rollover Text – Enter the text that you want to display when the<br />
mouse is rolled over the link on the Status Details page.<br />
Open in New Browser Window – Select this option to open a new<br />
browser window when the link is clicked in the Status Details page.<br />
104 <strong>OneSight</strong> <strong>Administrator</strong> <strong>Guide</strong>
Adding a Smartlink to a Monitor Group<br />
Substitution Variables – The following substitution variables are<br />
supported:<br />
%DateShort% – The locale-specific date that the metric was last<br />
measured in the format mm/dd/yy. For example, 4/4/01.<br />
%DateLong% – The locale-specific date that the metric was last<br />
measured, in long format. For example, Wednesday, April 4,<br />
2001.<br />
%TimeShort% – The locale-specific time that the metric was last<br />
measured, in short format. For example, 1:52 PM.<br />
%TimeLong% – The locale-specific time that the metric was last<br />
measured, in long format including the time zone. For example,<br />
1:52:16 PM PDT.<br />
%Value% – the numeric value of the metric. For example, 11.701<br />
seconds.<br />
%MonitorGroup% – The name of the Monitor Group that contains<br />
the metric. For example, Business Partner Extranet. If multiple<br />
Monitor Groups use this metric, the result is a comma delimited<br />
list.<br />
%SystemName% – The name of the system that the metric is<br />
applied against. For example, JBK_P3. For URL monitors, the<br />
system name is the URL that you are monitoring. For example,<br />
http://www.empirix.com. This lets you use %SystemName% as<br />
your SmartLink for a URL monitor.<br />
%Monitor% – The name of the monitor that the metric is within.<br />
For example, URL (http://www.empirix.com).<br />
%Component% – The name of the component that the metric is<br />
applied against. For example, Disk C:.<br />
Chapter 4: Configuring Monitor Groups 105
Applying Downtime to a Monitor Group<br />
%Metric% – The name of the metric. For example, Disk: % Space<br />
Available.<br />
%Entity% – The monitored entity ID.<br />
%Item% – The metric item ID.<br />
%Location% – The location of the Data Collector that sends out<br />
the alerts.<br />
Applying Downtime to a Monitor Group<br />
The Down Time tab lets you apply downtime to a monitor group.<br />
Available Downtimes – Lists the downtimes that are available and<br />
that have not been applied to this monitor group.<br />
Selected Downtimes – Lists the downtimes that have been applied to<br />
this monitor group.<br />
–Moves the selected downtime into the Selected<br />
Downtimes list.<br />
106 <strong>OneSight</strong> <strong>Administrator</strong> <strong>Guide</strong>
Enabling/Disabling a Monitor Group<br />
– Moves the selected downtime into the Available<br />
Downtimes list.<br />
Downtime Editor – Displays the Downtime Editor for creating and<br />
applying downtimes. Refer to “Chapter 9” for more information on<br />
the Downtime Editor.<br />
Enabling/Disabling a Monitor Group<br />
To enable or disable a monitor group:<br />
1. Click the Configure menu.<br />
2. Select Monitor Groups to open the Configure Monitor Groups<br />
page.<br />
3. In the Monitor Groups list, the check box that appears next to<br />
each monitor group’s name determines whether or not that<br />
monitor group is enabled.<br />
To disable a monitor group, clear the check box adjacent to<br />
that monitor group’s name.<br />
Chapter 4: Configuring Monitor Groups 107
Removing a Monitor Group<br />
To re-enable a monitor group, select the check box adjacent<br />
to that monitor group’s name.<br />
Removing a Monitor Group<br />
To remove a monitor group:<br />
1. Click the Configure menu.<br />
2. Click Monitor Groups to open the Configure Monitor Groups<br />
page.<br />
3. In the Monitor Groups list, click the name of the monitor group<br />
you want to remove.<br />
4. Click Remove.<br />
5. A warning dialog box appears, confirming that you want to<br />
remove the monitor group. Click Yes.<br />
108 <strong>OneSight</strong> <strong>Administrator</strong> <strong>Guide</strong>
Adding Monitors to a Monitor Group<br />
Adding Monitors to a Monitor Group<br />
To open the Add Monitor dialog box:<br />
1. Click the Configure menu.<br />
2. Click Monitor Groups to open the Configure Monitor Groups<br />
page.<br />
3. In the Monitor Groups list, click the name of the monitor group<br />
you want to work with and click Modify. Or, to create a new<br />
monitor group, click Add. The Monitor Group Editor opens.<br />
4. On the Monitors tab, click Add New to open the Add New<br />
Monitor dialog box or click Add Existing to open the Select<br />
Existing Monitor dialog box.<br />
Chapter 4: Configuring Monitor Groups 109
Adding Monitors to a Monitor Group<br />
The Add Monitor dialog box lists all the available types of<br />
dedicated monitors that you can apply to monitor the individual<br />
metrics or systems for your monitor group. There are also<br />
profile monitor options. Profile monitors allow you to track and<br />
manage performance of the back-end systems used for your<br />
monitor group. When you click a monitor in the Monitor Types<br />
box, the dialog box displays the options you must use to apply<br />
that monitor to your monitor group. Refer to Chapter 5 for<br />
dialog box descriptions.<br />
Use settings in this dialog box to apply monitors to your<br />
monitor group. To add a monitor, select the monitor type you<br />
want to apply and then use the options in the Add Monitor<br />
dialog box to configure the monitor.<br />
Monitor Types – The Monitor Types tree lists all of the kinds of<br />
monitors that can be used for your monitor group. To add a<br />
monitor to your monitor group, click the monitor type name that<br />
identifies the kind of process, system component, or activity<br />
that you want to monitor.<br />
When you select a dedicated monitor type, the Add Monitor<br />
dialog box displays the options you must use to apply that<br />
monitor to your monitor group. When you select a profile<br />
monitor, the right side of the Add Monitor dialog box lists the<br />
names of systems that you can use to create a profile monitor.<br />
Monitor Name – Each monitor that you create must have a<br />
unique name. In the Monitor Name box, <strong>OneSight</strong> creates a<br />
unique name for the current monitor by combining the name of<br />
the monitor type with the name of the host or system to which<br />
the monitor applies. To change the default assigned name, type<br />
a unique monitor name that helps you to identify what this<br />
monitor does.<br />
Group Profiles By – Lets you group the available profiles in the<br />
Monitor Types tree. Use the Profile Manager button or the<br />
110 <strong>OneSight</strong> <strong>Administrator</strong> <strong>Guide</strong>
Adding Monitors to a Monitor Group<br />
Configure Profiles page to create or modify individual profile<br />
attributes using the Attributes tab in the Profile Editor.<br />
The options in the Add Monitor dialog box change<br />
dynamically, depending on the type of monitor you choose to<br />
add. For help with the settings for a specific type of monitor,<br />
select the monitor type you want to apply to your monitor group<br />
and then click Help in the Add Monitor dialog box.<br />
To add a dedicated monitor to a monitor group:<br />
In Empirix <strong>OneSight</strong>, monitors are always created as part of a<br />
monitor group. If you have not already created a monitor group,<br />
create one now.<br />
Use this procedure to add a dedicated monitor to a monitor group. If<br />
you want to add a profile monitor, see Configuring a Profile<br />
Monitor.<br />
1. In the Monitor Group Editor, on the Monitors tab, click Add to<br />
open the Add Monitor dialog box.<br />
2. The Monitor Types box lists all of the types of monitors that<br />
can be applied to your monitor group. Click the dedicated<br />
monitor type that identifies the kind of process, system<br />
component, or activity that you want to monitor.<br />
This icon identifies the available types of dedicated monitors.<br />
3. When you select a dedicated monitor type, the Add Monitor<br />
dialog box displays the options you must use to apply that<br />
monitor to your monitor group. Use settings on the General tab<br />
to configure the monitor.<br />
For example, if you want to monitor whether a host used by<br />
your monitor group is reachable, select Ping in the Monitor<br />
Types box and use settings on the General tab to configure a<br />
Ping monitor for that host.<br />
Chapter 4: Configuring Monitor Groups 111
Adding Monitors to a Monitor Group<br />
4. Each monitor that you add must have a unique name. In the<br />
Monitor Name box, <strong>OneSight</strong> creates a unique name for the<br />
current monitor by combining the name of the monitor type<br />
with the name of the host or system to which the monitor<br />
applies. To change the default assigned name, type a unique<br />
monitor name that helps you to identify what this monitor does.<br />
5. To verify that the monitor will work as configured, click the<br />
Test button. The Monitor Test window provides information<br />
about the success or failure of the test and indicates what may<br />
be causing any problem.<br />
6. If the test succeeds, click OK in the Add Monitor dialog box to<br />
save these basic monitor settings. Then, click OK in the Monitor<br />
Group Editor to add the monitor to your monitor group.<br />
Now you are ready to verify that the monitor is performing as<br />
expected. Refer to the <strong>OneSight</strong> Operator <strong>Guide</strong>.<br />
After you have determined that the monitor performs correctly, you<br />
can configure additional features:<br />
Set up an Alert to detect when performance crosses a threshold.<br />
Set up an Action Plan to notify you if the monitor detects an<br />
error.<br />
112 <strong>OneSight</strong> <strong>Administrator</strong> <strong>Guide</strong>
C h a p t e r 5<br />
Configuring Monitors<br />
The Configure Monitors page lists the monitors that are currently<br />
configured in <strong>OneSight</strong>. You can add, modify, enable, disable, or<br />
remove monitors and configure monitors that you can add to<br />
monitor groups. Using the Monitors configuration, you can add or<br />
modify monitors individually without having to know which<br />
monitor group(s) contain the monitor.<br />
To open the Configure Monitors page:<br />
1. Click the Configure menu.<br />
2. Click Monitors to open the Configure Monitors page.<br />
113
Authentication<br />
Use these options to identify and manage <strong>OneSight</strong> monitors.<br />
The Monitor list can list all monitors that are configured in<br />
Empirix <strong>OneSight</strong> or it can be filtered to display only those<br />
monitors that you are interested in. In addition, the list can be<br />
sorted by clicking on a column heading. An arrow is displayed<br />
in the column heading indicating which column is being used to<br />
sort and the direction of the sort, ascending or descending.<br />
Show monitors where contains – Select the<br />
type of filter and enter any specific text, if necessary. For<br />
example, you can search for all monitors with e-TEST in the<br />
name. In addition to plain text, you can enter a PERL expression<br />
in the contains field.<br />
Show – Filters the monitors and redisplays the list.<br />
Add – Displays the Add Monitor dialog box for adding a new<br />
monitor.<br />
Clone – Creates a copy of the selected monitor that can then be<br />
modified.<br />
Modify – Displays the Edit Monitor dialog box for modifying<br />
the selected monitor.<br />
Remove – Deletes the selected monitor.<br />
Check All – Selects all monitors.<br />
Uncheck All – Deselects all monitors.<br />
Bulk Modification – Displays the Bulk Modification dialog box<br />
for adding, changing, and deleting alerts and locations for<br />
multiple monitors.<br />
Enable – The check box adjacent to each monitor group<br />
controls whether or not the monitor group is currently in effect.<br />
When selected, the monitor group is enabled. When cleared, the<br />
114 <strong>OneSight</strong> <strong>Administrator</strong> <strong>Guide</strong>
Authentication<br />
Authentication<br />
Monitor Naming<br />
monitor group is disabled. Disabled monitor groups will not<br />
participate in health monitoring, alerts, or execution of action<br />
plans.<br />
Monitor Symbols<br />
Monitor is configured but not in use by a monitor group.<br />
Monitor is in use by one or more monitor groups.<br />
Name – The Name column identifies the monitor. This name<br />
will appear in all <strong>OneSight</strong> reports and display pages that show<br />
the status of this monitor.<br />
User Group – Displays the user group to which this monitor<br />
belongs.<br />
Type – Shows the type of monitor.<br />
When you create a monitor, such as Perfmon, and do not leave the<br />
authentication fields blank, an Authproc folder will be created under<br />
the Empirix folder. It will contain the OSauth.exe file and the<br />
OSauth.exe process will be listed in the Task Manager. This file<br />
provides one central process for authentication.<br />
Each monitor that you create must have a unique name. In the<br />
Monitor Name box, <strong>OneSight</strong> creates a unique name for the current<br />
monitor by combining the name of the monitor type with the name<br />
of the host to which the monitor applies. <strong>OneSight</strong> continues to<br />
automatically update the monitor name if you change the host<br />
unless you have changed the default assigned name. Once you have<br />
changed the default name, <strong>OneSight</strong> no longer automatically<br />
updated the name.<br />
Chapter 5: Configuring Monitors 115
Configuring the VQ Inspector Monitor for the Avaya Communication Manager<br />
Configuring the VQ Inspector Monitor for the<br />
Avaya Communication Manager<br />
The Avaya Communication Manager Profile monitor passively<br />
monitors call activity on specified extensions to create a metric data<br />
set for each completed call handled by the Avaya Communication<br />
Manager.<br />
For the monitor to work, the Avaya Communication Manager must<br />
be configured to send RTCP packets and Call Detail Records to the<br />
<strong>OneSight</strong> Data Collector. In addition, the extensions to monitor<br />
must be configured in the Avaya Communication Manager. This<br />
process is described below.<br />
Configuring the Avaya Communication Manager<br />
To configure the Avaya Communication Manager:<br />
1. Log in to the machine on which your Avaya Communication<br />
Manager resides by entering https\\ and<br />
entering your user name and password.<br />
2. Launch the Native Configuration Manager and log in.<br />
3. To enable RTCP packet forwarding, enter the command change<br />
ip-network-region 1 in the Command field.<br />
116 <strong>OneSight</strong> <strong>Administrator</strong> <strong>Guide</strong>
Configuring the VQ Inspector Monitor for the Avaya Communication Manager<br />
4. Set the RTCP Reporting Enabled and Use Default Server<br />
Parameters fields to Y.<br />
5. Click ENTER to save your changes.<br />
Chapter 5: Configuring Monitors 117
Configuring the VQ Inspector Monitor for the Avaya Communication Manager<br />
6. To configure RTCP options, enter the command change<br />
system-parameter ip-options.<br />
7. Enter the IP address of the <strong>OneSight</strong> Data Collector in the<br />
Default Server IP Address field and click ENTER.<br />
118 <strong>OneSight</strong> <strong>Administrator</strong> <strong>Guide</strong>
Configuring the VQ Inspector Monitor for the Avaya Communication Manager<br />
8. To enable Call Detail Record observation, enter the change<br />
node-name-ip command.<br />
9. Create a new node Name/ IP Address mapping called empirix.<br />
Enter the IP address of the <strong>OneSight</strong> Data Collector machine<br />
and click ENTER.<br />
Chapter 5: Configuring Monitors 119
Configuring the VQ Inspector Monitor for the Avaya Communication Manager<br />
10. To create an IP service for call detail recording, enter the<br />
change ip-service command.<br />
11. Enter CDR1 in the Service Type field.<br />
12. Select the previously created empirix in the Remote Node field<br />
and click ENTER.<br />
120 <strong>OneSight</strong> <strong>Administrator</strong> <strong>Guide</strong>
Configuring the VQ Inspector Monitor for the Avaya Communication Manager<br />
13. To configure Call Detail Record forwarding, enter the change<br />
system-parameters cdr command.<br />
14. Set the following fields:<br />
Primary Output Format – customized<br />
Primary Output Endpoint – CDR1. This should match the<br />
previously entered IP service.<br />
Secondary Output Format – customized<br />
Secondary Output Endpoint – CDR2. This should match the<br />
previously entered IP service.<br />
Intra-switch CDR – y<br />
Record Outgoing Calls Only - n<br />
Chapter 5: Configuring Monitors 121
Configuring the VQ Inspector Monitor for the Avaya Communication Manager<br />
15. Click NEXT PA.<br />
16. Enter the following data items and their length for customized<br />
output:<br />
date – 6<br />
time – 4<br />
space – 1<br />
sec-dur – 5<br />
space – 1<br />
dialed-num – 23<br />
space – 1<br />
calling-num – 15<br />
return – 1<br />
line-feed – 1<br />
17. Click ENTER.<br />
122 <strong>OneSight</strong> <strong>Administrator</strong> <strong>Guide</strong>
Configuring the VQ Inspector Monitor for the Avaya Communication Manager<br />
18. To specify the extensions to monitor, enter the change intraswitch<br />
cdr command.<br />
19. Enter the extensions to monitor and click ENTER.<br />
20. To check the status of the call detail record link, enter the<br />
command status cdr.<br />
Configuring the Monitor in <strong>OneSight</strong><br />
Once the Avaya Communication Manager is configured, you can<br />
create the monitor in <strong>OneSight</strong>.<br />
Note: Because the Data Collector must listen on specific ports for<br />
incoming RTCP and Call Detail Records, the Avaya Communication<br />
Manager monitor must use one specific, named location for data<br />
collection. The location should not be used.<br />
Chapter 5: Configuring Monitors 123
Configuring the VQ Inspector Monitor for the Avaya Communication Manager<br />
In addition, only one data collector should be installed on the data<br />
collector machine.<br />
In the Add Monitor dialog box, when you click Avaya<br />
Communication Manager in the Monitor Types box, settings to<br />
configure a Avaya Communication Manager monitor appear on<br />
these dialog box tabs:<br />
General Tab – Contains the options that you can use to create a<br />
Avaya Communication Manager monitor for your monitor group.<br />
Locations Tab – Specifies the Data Collector Location from which<br />
the monitor checks performance.<br />
SmartLinks Tab – Contains the options for specifying a link to<br />
associate with a particular monitor or metric.<br />
Attributes Tab – Contains the options for specifying which attributes<br />
are applied to this monitor for Status page sorting.<br />
Monitor Groups Tab – Contains the options that you can use to<br />
specify which monitor groups the monitor is used with. This tab is<br />
available when you open the Add Monitor window by selecting<br />
Monitors from the Configure menu. It is not available when you<br />
open the Add Monitor window from the Monitor Group Editor.<br />
Access Control Tab – Contains the options for specifying which user<br />
groups have read, write, and delete permissions for this monitor.<br />
Down Time Tab – Contains the options for applying downtime to<br />
this monitor.<br />
Each monitor that you create must have a unique name. In the<br />
Monitor Name box, <strong>OneSight</strong> creates a unique name for the current<br />
monitor by combining the name of the monitor type with the name<br />
of the host to which the monitor applies. To change the default<br />
assigned name, type a unique monitor name that helps you to<br />
identify what this monitor does.<br />
124 <strong>OneSight</strong> <strong>Administrator</strong> <strong>Guide</strong>
Configuring the VQ Inspector Monitor for the Avaya Communication Manager<br />
To create a VQ Inspector Monitor for the Avaya Communication<br />
Manager:<br />
1. On the Monitors Page, click Add to open the Add Monitor<br />
dialog box.<br />
2. The Monitor Types box lists all of the types of monitors that<br />
can be applied to your monitor group. Click Avaya<br />
Communication Manager to add a monitor that passively<br />
monitors Avaya phone call activity. You will use settings on the<br />
General tab to configure an Avaya Communication Manager<br />
monitor.<br />
Avaya CM IP Address – Specifies the IP Address of the Avaya<br />
Communication Manager.<br />
Version – Select the SNMP version being used, Snmp_Version1,<br />
Snmp_Version2c, or Snmp_Version3.<br />
Chapter 5: Configuring Monitors 125
Configuring the VQ Inspector Monitor for the Avaya Communication Manager<br />
The following additional fields are displayed for SNMP version<br />
3:<br />
Auth Mode – Select the authentication mode.<br />
NoAuth/NoPriv – No authentication and no privileges.<br />
Auth/NoPriv – Authentication and no privileges.<br />
Auth/Priv – Both Authentication and privileges.<br />
User Name – Enter the user name to use to log in to the SNMP<br />
version 3 protocol.<br />
Password – Enter the password to use to log in to the SNMP<br />
version 3 protocol.<br />
Auth – Select the authentication hashing function to use: MD5<br />
or SHA.<br />
Privacy Mode – Select the method to use for encrypting the<br />
data.<br />
Privacy Password – If you have selected a privacy mode,<br />
enter the password.<br />
Context – Enter the context setting that matches the setting in<br />
the device that is being monitored. Typically, it is a name that<br />
describes the device. For example, ―bridge.‖<br />
Time Out – The amount of time, in seconds, to wait for data<br />
from the Avaya Communications Manager before timing out.<br />
CDR Configuration – The CDR configuration specifies the index<br />
and length of the fields. This information must match what is<br />
configured on the CDR System Parameters dialog box in the<br />
Avaya CM and must take into account spaces. For example, if<br />
your Avaya CM is configured as follows:<br />
126 <strong>OneSight</strong> <strong>Administrator</strong> <strong>Guide</strong>
Configuring the VQ Inspector Monitor for the Avaya Communication Manager<br />
The index for the date is 1 and its length is 6. The index for<br />
time must take into consideration the space after the date. The<br />
index for time would be 8 (1 for the date index, plus 6 for the<br />
length of the date, plus 1 for the space after the date). The index<br />
for the duration would be 13 (8 for the time index, plus 4 for the<br />
length of time, plus 1 for the space after the time.)<br />
Note: If you change any of these fields, you must restart the<br />
Data Collector for the changes to take effect.<br />
Date Start Index and Length – Enter the date start index and<br />
length.<br />
Time Start Index and Length – Enter the time start index and<br />
length.<br />
Duration Start Index and Length – Enter the duration start<br />
index and length.<br />
Chapter 5: Configuring Monitors 127
Configuring the VQ Inspector Monitor for the Avaya Communication Manager<br />
Called Number Start Index and Length – Enter the called<br />
number start index and length.<br />
Calling Number Start Index and Length – Enter the calling<br />
number start index and length.<br />
Sample Every: – Specifies how often samples are<br />
taken for this monitor. Refer to, ―Sample Every Settings,‖ later<br />
in this chapter for a description of these settings.<br />
3. Enter the IP Address of the Avaya Communication Manager.<br />
4. Select the SNMP version being used.<br />
5. Enter the CDR configuration. You must restart the Data<br />
Collector for the changes to take effect.<br />
6. Enter the sampling rate.<br />
7. Click the Location tab.<br />
8. Select a specific named location to use for data collecting.<br />
Note: Because the Data Collector must listen on specific ports<br />
for incoming RTCP and Call Detail Records, the Avaya<br />
Communication Manager monitor must use one specific, named<br />
location for data collection. The location should not<br />
be used.<br />
In addition, only one data collector should be installed on the<br />
data collector machine.<br />
9. To verify that the monitor will work as configured, click the<br />
Test button. The Monitor Test window provides information<br />
about the success or failure of the test and indicates what may<br />
be causing any problem.<br />
10. If the test succeeds, click OK in the Add Monitor dialog box to<br />
save these settings. You can now add this monitor to a monitor<br />
128 <strong>OneSight</strong> <strong>Administrator</strong> <strong>Guide</strong>
Configuring the Cisco Call Manager Profile Monitor<br />
group. Refer to “Adding Monitor to a Monitor Group” in<br />
Chapter 4.<br />
Configuring the Cisco Call Manager Profile<br />
Monitor<br />
The Cisco Call Manager Profile monitor passively monitors call<br />
activity to create a metric data set for each completed call handled<br />
by the Cisco Call Manager.<br />
For the monitor to work, an FTP server must be running on the same<br />
machine that has the Data Collector for the Cisco Call Manager<br />
monitor. The Data Collector’s OSDC.properties file must be<br />
modified to specify the FTP root location and FTP and SNMP must<br />
be configured on the Cisco Call Manager.<br />
Configuring the OSDC.properties File<br />
To specify the location of the FTP server, edit the following section<br />
in the OSDC.properties file.<br />
##################################################<br />
#[Agents.CiscoCallManager]<br />
##################################################<br />
Agents.CiscoCM.Java.Library =<br />
com.wrq.wam.agents.CiscoCallManager.CiscoCallManag<br />
erMonitor<br />
Agents.CiscoCM.FTPDirectory =<br />
C:\\Inetpub\\ftproot\\<br />
Agents.CiscoCM.Status = enabled<br />
Agents.CiscoCM.DebugMode = false<br />
Chapter 5: Configuring Monitors 129
Configuring the Cisco Call Manager Profile Monitor<br />
The FTP server can be installed in any directory, however, it must<br />
be installed on the machine that has the Cisco Call Manager<br />
monitor Data Collector. Set Agents.CiscoCM.FTPDirectory to the<br />
FTP server location. Set the Agents.CiscoCM.Status to enabled.<br />
Configuring the Cisco Call Manager<br />
The FTP service and SNMP must be configured and activated on<br />
the Cisco Call Manager. To configure the Cisco Call Manager:<br />
Configuring FTP<br />
1. Log in to the machine on which your Cisco Call Manager reside<br />
by selecting Cisco Unified Serviceability from the Navigation<br />
dropdown and entering your user name and password.<br />
2. Select CDR Management from the Tools menu.<br />
130 <strong>OneSight</strong> <strong>Administrator</strong> <strong>Guide</strong>
Configuring the Cisco Call Manager Profile Monitor<br />
3. Click the Add new button.<br />
4. Enter the FTP server information and click Add. Note that the<br />
Host Name/IP Address must be the host name/IP address of the<br />
<strong>OneSight</strong> Data Collector for the Cisco Call Manager monitor.<br />
5. Select Service Activation from the Tools menu.<br />
Chapter 5: Configuring Monitors 131
Configuring the Cisco Call Manager Profile Monitor<br />
6. Scroll to the CDR Services section and enable the Cisco SOAP –<br />
CDRonDemand Service and the Cisco CAR Web Service.<br />
132 <strong>OneSight</strong> <strong>Administrator</strong> <strong>Guide</strong>
Configuring the Cisco Call Manager Profile Monitor<br />
Configuring SNMP V1 or V2c<br />
1. If you are using SNMP version 1 or 2c, select V1/V2c from the<br />
SNMP menu, then select Community String.<br />
Chapter 5: Configuring Monitors 133
Configuring the Cisco Call Manager Profile Monitor<br />
2. Click Find.<br />
134 <strong>OneSight</strong> <strong>Administrator</strong> <strong>Guide</strong>
Configuring the Cisco Call Manager Profile Monitor<br />
3. Click Add New.<br />
4. Set the Community String to Public.<br />
5. Select the Accept SNMP Packets from any host option.<br />
Chapter 5: Configuring Monitors 135
Configuring the Cisco Call Manager Profile Monitor<br />
6. Set the Access Privileges field to ReadOnly and click Save.<br />
7. Select Community String from the SNMP menu, then select<br />
Notification Destination.<br />
136 <strong>OneSight</strong> <strong>Administrator</strong> <strong>Guide</strong>
Configuring the Cisco Call Manager Profile Monitor<br />
8. Click Find.<br />
9. Click Add New.<br />
Chapter 5: Configuring Monitors 137
Configuring the Cisco Call Manager Profile Monitor<br />
10. Click Add New in the Host IP Addresses field.<br />
11. Select the Cisco Call Manager server.<br />
12. Enter the Host IP Address of the <strong>OneSight</strong> Data Collector<br />
where you want to send the information in the Host IP Address<br />
field.<br />
13. Enter 161 in the Port Number field.<br />
138 <strong>OneSight</strong> <strong>Administrator</strong> <strong>Guide</strong>
Configuring the Cisco Call Manager Profile Monitor<br />
14. Select the SNMP version that you are using and click Save.<br />
Chapter 5: Configuring Monitors 139
Configuring the Cisco Call Manager Profile Monitor<br />
15. Select Service Activation from the Tools menu.<br />
16. Make sure that Cisco CallManager SNMP Service is selected in<br />
the Performance and Monitoring Services list.<br />
140 <strong>OneSight</strong> <strong>Administrator</strong> <strong>Guide</strong>
Configuring the Cisco Call Manager Profile Monitor<br />
Configuring SNMP V3<br />
1. If you are using SNMP version 3, select V3 from the SNMP<br />
menu, then select User.<br />
Chapter 5: Configuring Monitors 141
Configuring the Cisco Call Manager Profile Monitor<br />
2. Click Find.<br />
142 <strong>OneSight</strong> <strong>Administrator</strong> <strong>Guide</strong>
Configuring the Cisco Call Manager Profile Monitor<br />
3. Click Add New.<br />
4. Enter the user name and password that will be used by<br />
<strong>OneSight</strong>.<br />
5. Select MD5 in the Protocol field and click Save.<br />
6. Select Community String from the SNMP menu, then select<br />
Notification Destination.<br />
Chapter 5: Configuring Monitors 143
Configuring the Cisco Call Manager Profile Monitor<br />
7. Click Find.<br />
8. Click Add New.<br />
144 <strong>OneSight</strong> <strong>Administrator</strong> <strong>Guide</strong>
Configuring the Cisco Call Manager Profile Monitor<br />
9. Click Add New in the Host IP Addresses field.<br />
10. Select the Cisco Call Manager server.<br />
11. Enter the Host IP Address of the <strong>OneSight</strong> Data Collector<br />
where you want to send the information in the Host IP Address<br />
field.<br />
12. Enter 161 in the Port Number field.<br />
Chapter 5: Configuring Monitors 145
Configuring the Cisco Call Manager Profile Monitor<br />
13. Select the SNMP version that you are using and click Save.<br />
146 <strong>OneSight</strong> <strong>Administrator</strong> <strong>Guide</strong>
Configuring the Cisco Call Manager Profile Monitor<br />
14. Select Service Activation from the Tools menu.<br />
15. Make sure that Cisco CallManager SNMP Service is selected in<br />
the Performance and Monitoring Services list.<br />
Configuring the Monitor in <strong>OneSight</strong><br />
Once the Cisco Call Manager is configured, you can create the<br />
monitor in <strong>OneSight</strong>.<br />
In the Add Monitor dialog box, when you click Cisco Call Manager<br />
in the Monitor Types box, settings to configure a Cisco Call<br />
Manager monitor appear on these dialog box tabs:<br />
General Tab – Contains the options that you can use to create a<br />
Cisco Call Manager monitor for your monitor group.<br />
Locations Tab – Specifies the Data Collector Location from which<br />
the monitor checks performance.<br />
Chapter 5: Configuring Monitors 147
Configuring the Cisco Call Manager Profile Monitor<br />
SmartLinks Tab – Contains the options for specifying a link to<br />
associate with a particular monitor or metric.<br />
Attributes Tab – Contains the options for specifying which attributes<br />
are applied to this monitor for Status page sorting.<br />
Monitor Groups Tab – Contains the options that you can use to<br />
specify which monitor groups the monitor is used with. This tab is<br />
available when you open the Add Monitor window by selecting<br />
Monitors from the Configure menu. It is not available when you<br />
open the Add Monitor window from the Monitor Group Editor.<br />
Access Control Tab – Contains the options for specifying which user<br />
groups have read, write, and delete permissions for this monitor.<br />
Down Time Tab – Contains the options for applying downtime to<br />
this monitor.<br />
Each monitor that you create must have a unique name. In the<br />
Monitor Name box, <strong>OneSight</strong> creates a unique name for the current<br />
monitor by combining the name of the monitor type with the name<br />
of the host to which the monitor applies. To change the default<br />
assigned name, type a unique monitor name that helps you to<br />
identify what this monitor does.<br />
To create a Cisco Call Manager profile monitor:<br />
1. On the Monitors Page, click Add to open the Add Monitor<br />
dialog box.<br />
148 <strong>OneSight</strong> <strong>Administrator</strong> <strong>Guide</strong>
Configuring the Cisco Call Manager Profile Monitor<br />
2. The Monitor Types box lists all of the types of monitors that<br />
can be applied to your monitor group. Click Cisco Call Manager<br />
to add a monitor that passively monitors Cisco phone call<br />
activity. You will use settings on the General tab to configure a<br />
Cisco Call Manager monitor.<br />
Cisco CM IP Address – Specifies the IP Address of the Cisco<br />
Call Manager.<br />
Version – Select the SNMP version being used, Snmp_Version1,<br />
Snmp_Version2c, or Snmp_Version3.<br />
The following additional fields are displayed for SNMP version<br />
3:<br />
Auth Mode – Select the authentication mode.<br />
NoAuth/NoPriv – No authentication and no privileges.<br />
Auth/NoPriv – Authentication and no privileges.<br />
Chapter 5: Configuring Monitors 149
Configuring the Cisco Call Manager Profile Monitor<br />
Auth/Priv – Both Authentication and privileges.<br />
User Name – Enter the user name to use to log in to the SNMP<br />
version 3 protocol.<br />
Password – Enter the password to use to log in to the SNMP<br />
aversion 3 protocol.<br />
Auth – Select the authentication hashing function to use: MD5<br />
or SHA.<br />
Privacy Mode – Select the method to use for encrypting the<br />
data.<br />
Privacy Password – If you have selected a privacy mode,<br />
enter the password.<br />
Context – Enter the context setting that matches the setting in<br />
the device that is being monitored. Typically, it is a name that<br />
describes the device. For example, ―bridge.‖<br />
Time Out – The amount of time, in seconds, to wait for data<br />
from the Cisco Call Manager before timing out.<br />
Port – Specifies the port number used on this system by the<br />
SNMP agent. Typically, this is port 161.<br />
Connection Method – Select the connection method to use.<br />
User Name – Enter the user name to use to log in to the Cisco<br />
Call Manager.<br />
Prompt – Specify the command line prompt for the Cisco Call<br />
Manager.<br />
Sample Every: – Specifies how often samples are<br />
taken for this monitor. Refer to, ―Sample Every Settings,‖ later<br />
in this chapter for a description of these settings.<br />
150 <strong>OneSight</strong> <strong>Administrator</strong> <strong>Guide</strong>
Configuring the IDMC Profile Monitor<br />
3. Enter the IP Address of the Cisco Communication Manager.<br />
4. Select the SNMP version being used.<br />
5. Enter the sampling rate.<br />
6. To verify that the monitor will work as configured, click the<br />
Test button. The Monitor Test window provides information<br />
about the success or failure of the test and indicates what may<br />
be causing any problem.<br />
7. If the test succeeds, click OK in the Add Monitor dialog box to<br />
save these settings. You can now add this monitor to a monitor<br />
group. Refer to “Adding Monitor to a Monitor Group” in<br />
Chapter 4.<br />
Configuring the IDMC Profile Monitor<br />
The IDMC (Intelligent Data Mediation and Correlation) Profile<br />
Monitor monitors Key Performance Indicators (KPIs) that are<br />
received from Empirix IDMC.<br />
IDMC profile monitors cannot be created directly in Empirix<br />
<strong>OneSight</strong>. Instead, monitors and metrics are created automatically<br />
based on the configuration information received from the Empirix<br />
IDMC system. To keep Empirix IDMC and Empirix <strong>OneSight</strong><br />
synchronized with one another, metrics cannot be added in<br />
<strong>OneSight</strong>. Metrics can only be edited and deleted. Alerts can be<br />
added, edited, and deleted.<br />
Note: After the monitors are created, sampling does not occur until<br />
the monitors are placed in a monitor group.<br />
When you choose to edit an IDMC monitor, settings to configure an<br />
IDMC profile monitor appear on these dialog box tabs:<br />
Locations Tab – Specifies the Data Collector Location from which<br />
the monitor checks performance.<br />
Chapter 5: Configuring Monitors 151
Configuring the IDMC Profile Monitor<br />
SmartLinks Tab – Contains the options for specifying a link to<br />
associate with a particular monitor or metric.<br />
Attributes Tab – Contains the options for specifying which attributes<br />
are applied to this monitor for Status page sorting.<br />
Monitor Groups Tab – Contains the options that you can use to<br />
specify which monitor groups the monitor is used with.<br />
Access Control Tab – Contains the options for specifying which user<br />
groups have read, write, and delete permissions for this monitor.<br />
Down Time Tab – Contains the options for applying downtime to<br />
this monitor.<br />
Refer to the, ―Using Empirix <strong>OneSight</strong> with Empirix IDMC,‖<br />
application note for details about how to configure this monitor in<br />
both Empirix IDMC and Empirix <strong>OneSight</strong>.<br />
152 <strong>OneSight</strong> <strong>Administrator</strong> <strong>Guide</strong>
Configuring <strong>OneSight</strong> Compound Metric Monitors<br />
Configuring <strong>OneSight</strong> Compound Metric<br />
Monitors<br />
The <strong>OneSight</strong> Compound Metric monitor lets you put together data<br />
from more than one monitor. For example, you can trigger an action<br />
plan based on the alert state of two metrics or you could calculate<br />
disk usage across all disks.<br />
The <strong>OneSight</strong> Compound Metric monitor has two main<br />
components:<br />
References – references are the values used to create expressions.<br />
There are four types of references: monitor group state, monitor<br />
state, metric value, and alert state. Monitor group and monitor<br />
state let you use the color of the status gumball in the expression.<br />
Metric value lets you use the value of the metric in the<br />
expression. Alert state lets you use the state of the alert in the<br />
expression. For example, you could create a reference to the<br />
retrieval time of a URL, or to the state of a particular monitor.<br />
Expression – the formula used to calculate the value of the<br />
<strong>OneSight</strong> Compound Metric monitor. The result of the formula<br />
must be numeric. For example, you could create an expression<br />
that returns 1 if all monitors are in a good state (green) and 0 if at<br />
least one monitor is in a critical state (red).<br />
The first thing you do when configuring a <strong>OneSight</strong> Compound<br />
Metric monitor is to configure references. Once you configure the<br />
references, you can create the expression for the Compound<br />
Monitor.<br />
In the Add Monitor dialog box, when you click <strong>OneSight</strong><br />
Compound Metric in the Monitor Types box, settings to configure a<br />
<strong>OneSight</strong> Compound Metric monitor appear on these dialog box<br />
tabs:<br />
Chapter 5: Configuring Monitors 153
Configuring <strong>OneSight</strong> Compound Metric Monitors<br />
Expression Tab – Contains the options that you can use to create a<br />
<strong>OneSight</strong> Compound Metric monitor for your monitor group.<br />
References Tab – Contains the options for creating the references to<br />
use in the <strong>OneSight</strong> Compound Metric expression.<br />
Alerts Tab – Shows what action plan will be used when an alert<br />
occurs. Options on this tab allow you to set up or modify an action<br />
plan that responds to alerts generated by the current <strong>OneSight</strong><br />
Compound Metric monitor. You can also configure how an alert<br />
will affect the monitor group’s health. It can result in a Warning<br />
state, a Critical state, or can have no impact on health.<br />
SmartLinks Tab – Contains the options for specifying a link to<br />
associate with a particular monitor or metric.<br />
Attributes Tab – Contains the options for specifying which attributes<br />
are applied to this monitor for Status page sorting.<br />
Monitor Groups Tab – Contains the options that you can use to<br />
specify which monitor groups the monitor is used with. This tab is<br />
available when you open the Add Monitor window by selecting<br />
Monitors from the Configure menu. It is not available when you<br />
open the Add Monitor window from the Monitor Group Editor.<br />
Access Control Tab – Contains the options for specifying which user<br />
groups have read, write, and delete permissions for this monitor.<br />
Down Time Tab – Contains the options for applying downtime to<br />
this monitor.<br />
Each monitor that you create must have a unique name. For<br />
<strong>OneSight</strong> Compound Metric monitors you must change the default<br />
name. To change the default assigned name, type a unique monitor<br />
name that helps you to identify what this monitor does.<br />
154 <strong>OneSight</strong> <strong>Administrator</strong> <strong>Guide</strong>
Configuring <strong>OneSight</strong> Compound Metric Monitors<br />
To create a <strong>OneSight</strong> Compound Metric monitor:<br />
1. On the Monitors Page, click Add to open the Add Monitor<br />
dialog box.<br />
2. The Monitor Types box lists all of the types of monitors that<br />
can be applied to your application. Click <strong>OneSight</strong> Compound<br />
Metric.<br />
Options – Displays the valid C language operators that you can<br />
use at this point in the expression. Select an operator to enter it<br />
into the expression. Refer to the following sections for a list of<br />
valid operators and examples.<br />
– Displays the status of the expression. Every time you<br />
stop typing, <strong>OneSight</strong> tries to determine if the expression is<br />
valid.<br />
Chapter 5: Configuring Monitors 155
Configuring <strong>OneSight</strong> Compound Metric Monitors<br />
Sample Continuously – Select this option when you want data<br />
sent whenever the agent has it.<br />
Sample Every: – Specifies how often samples are<br />
taken for this monitor. Refer to, ―Sample Every Settings,‖ later<br />
in this chapter for a description of these settings.<br />
3. Each monitor that you add must have a unique name. Enter a<br />
name for the monitor.<br />
4. Click the References tab.<br />
Add – Displays the Add Reference dialog box for creating a<br />
reference.<br />
156 <strong>OneSight</strong> <strong>Administrator</strong> <strong>Guide</strong>
Configuring <strong>OneSight</strong> Compound Metric Monitors<br />
Modify – Displays the Modify Reference dialog box for<br />
modifying the selected reference.<br />
Remove – Deletes the selected reference.<br />
Name – Displays the reference name.<br />
Type – Displays the reference’s type.<br />
Object – Displays the monitor group, monitor, metric, or alert<br />
used in this reference.<br />
5. Click Add.<br />
Not all fields on this dialog box need to be filled. Only the<br />
fields required for the type of object selected will be available.<br />
Name – Enter a name for this reference. Spaces can be included.<br />
Reference type – Select the type of object you are referencing,<br />
monitor group, monitor, metric, or alert.<br />
Group By – Determines how references are selected. Fields are<br />
displayed based on the selected option.<br />
Monitor Group – Lets you select based on monitor group.<br />
Chapter 5: Configuring Monitors 157
Configuring <strong>OneSight</strong> Compound Metric Monitors<br />
Attribute – Lets you select based on attribute values.<br />
The following fields are displayed when Monitor Group is<br />
selected in the Group by field.<br />
Monitor Group – Select the monitor group you want to use or<br />
the monitor group that contains the monitor, metric, or alert<br />
you want to reference.<br />
Monitor – Select the monitor that you want to use or the<br />
monitor that contains the metric or alert you want to<br />
reference.<br />
Metric – Select the metric you want to use or the metric that<br />
contains the alert you want to reference.<br />
Entity – Select the entity you want to use.<br />
Alert – Select the alert that you want to reference.<br />
The following fields are displayed when Attributes is selected in<br />
the Group by field.<br />
Attribute Set – Select the attribute set that you want to filter<br />
on.<br />
Attribute Value – Select the attribute values that you want to<br />
filter on.<br />
Monitor Type – Select the monitor type. This field is only<br />
available when Reference Type is Metric Value or Alert State.<br />
For these reference types, only the same type of metric or<br />
alert can be compounded. For example, it does not make<br />
sense to compound a Ping monitor with a Perfmon monitor<br />
on metric value even though they have the same attribute<br />
value.<br />
Metric – Select the metric you want to use or the metric that<br />
contains the alert you want to reference.<br />
158 <strong>OneSight</strong> <strong>Administrator</strong> <strong>Guide</strong>
Configuring <strong>OneSight</strong> Compound Metric Monitors<br />
Alert – Select the alert that you want to reference.<br />
6. Enter a name for the reference.<br />
7. Select the object type and complete the fields as they become<br />
available.<br />
8. Click OK.<br />
9. Create as many references are you need, then click the<br />
Expression tab.<br />
10. Enter the expression you want to use. Refer to the following<br />
section for a list of valid operators that can be used in the<br />
expression. The Options list field contains the options that are<br />
valid at the current point in the expression.<br />
For example, if you have created the expressions monitor1,<br />
monitorgroup1, and metric2, you could compare the status<br />
(color) of monitor1 to monitorgroup1 and display metric2 if<br />
they match and zero if they do not match:<br />
(monitor1 = monitorgroup1) ? metric2 : 0<br />
11. To verify that the monitor will work as configured, click the<br />
Test button. The Monitor Test window provides information<br />
about the success or failure of the test and indicates what may<br />
be causing any problem.<br />
12. If the test succeeds, click OK in the Add Monitor dialog box to<br />
save these basic <strong>OneSight</strong> Compound Metric monitor settings.<br />
You can now add this monitor to a monitor group. Refer to<br />
Adding Monitors to a Monitor Group in Chapter 4.<br />
Chapter 5: Configuring Monitors 159
Configuring <strong>OneSight</strong> Compound Metric Monitors<br />
<strong>OneSight</strong> Compound Metric Operators<br />
The following operators can be used to create expressions.<br />
Operator Description Applies To<br />
? : <br />
If the Boolean<br />
is true select<br />
the first value<br />
otherwise<br />
select the<br />
second value<br />
Numeric,<br />
Color<br />
+ Addition Numeric<br />
- Subtraction Numeric<br />
* Multiplication Numeric<br />
/ Division Numeric<br />
( ) Parenthesis Numeric,<br />
Boolean,<br />
Color<br />
abs(val) Absolute Value Numeric<br />
avg Average Numeric<br />
ceil(val) Ceiling Numeric<br />
count(set)<br />
Calculates the<br />
number of<br />
elements in a<br />
set.<br />
Numeric,<br />
Boolean,<br />
Color<br />
160 <strong>OneSight</strong> <strong>Administrator</strong> <strong>Guide</strong>
Configuring <strong>OneSight</strong> Compound Metric Monitors<br />
Operator Description Applies To<br />
deltaTimeStamp(metric)<br />
deltaValue(metric)<br />
Calculates the<br />
sample<br />
timestamp<br />
difference of the<br />
metric.<br />
Calculates the<br />
absolute value<br />
of the difference<br />
of two sampled<br />
values of a<br />
metric.<br />
Numeric<br />
Numeric<br />
false False Numeric,<br />
Boolean,<br />
Color<br />
floor(val) Floor Numeric<br />
median Median Numeric,<br />
Boolean,<br />
Color<br />
min Minimum Numeric,<br />
Color<br />
max Maximum Numeric,<br />
Color<br />
power(val1, val2)<br />
Raise val1 to the<br />
power of val2<br />
Numeric<br />
Chapter 5: Configuring Monitors 161
Configuring <strong>OneSight</strong> Compound Metric Monitors<br />
Operator Description Applies To<br />
Reflect(str1,str2,float<br />
list…)<br />
Calls class str1’s<br />
method and str2<br />
with the parameter<br />
list.<br />
Numeric<br />
round(val) Round Numeric<br />
sqrt(val) Square Root Numeric<br />
stddev(val)<br />
Standard<br />
Deviation<br />
Numeric<br />
true True Numeric,<br />
Boolean,<br />
Color<br />
trunc(val) Truncate Numeric<br />
valueOverTime(val,<br />
operator, time_interval)<br />
Returns the<br />
average, sum, min,<br />
or max value for a<br />
compound metric<br />
over a relative<br />
time interval.<br />
time_interval can<br />
be specified in<br />
s(seconds),<br />
m(minutes),<br />
h(hours) or<br />
d(days) and must<br />
be enclosed in<br />
quotes. For<br />
example, ―1d‖.<br />
Numeric<br />
162 <strong>OneSight</strong> <strong>Administrator</strong> <strong>Guide</strong>
Configuring <strong>OneSight</strong> Compound Metric Monitors<br />
Operator Description Applies To<br />
(val1, val2, val3) Set Numeric,<br />
Boolean,<br />
Color<br />
OR Boolean or Boolean<br />
AND Boolean and Boolean<br />
>= Greater than or<br />
equal to<br />
Numeric,<br />
Color<br />
><br />
Greater than<br />
Numeric,<br />
Color<br />
Configuring <strong>OneSight</strong> Compound Metric Monitors<br />
<strong>OneSight</strong> Compound Metric Examples<br />
Monitor States<br />
This example returns a 1 if monitor1 is in a critical state and<br />
monitor2 is in a good state is true and a 0 otherwise. In the Add<br />
Reference dialog box create the following two monitors:<br />
Monitor 1<br />
Monitor 2<br />
Name – monitor1<br />
Reference Type – Monitor State<br />
Monitor Group – Select a monitor group<br />
Monitor – Select a monitor<br />
No other fields need to be entered.<br />
Name – monitor2<br />
Reference Type – Monitor State<br />
Monitor Group – Select a monitor group<br />
Monitor – Select a monitor<br />
No other fields need to be entered.<br />
Enter the following expression on the Expression tab:<br />
(monitor1=red AND monitor2=green)? 1 : 0<br />
Derived Value based on more than one monitor<br />
This example creates an expression that returns the average page<br />
retrieval time for three URL monitors. In the Add Reference dialog<br />
box create the following three monitors:<br />
Monitor 1<br />
Name – url1<br />
Reference Type – Metric Value<br />
Monitor Group – Select a monitor group<br />
Monitor – Select a URL monitor<br />
Metric – Select URL Retrieval Time<br />
Entity – Select an entity<br />
No other fields need to be entered.<br />
164 <strong>OneSight</strong> <strong>Administrator</strong> <strong>Guide</strong>
Configuring <strong>OneSight</strong> Compound Metric Monitors<br />
Monitor 2<br />
Monitor 3<br />
Name – url2<br />
Reference Type – Metric Value<br />
Monitor Group – Select a monitor group<br />
Monitor – Select a URL monitor<br />
Metric – Select URL Retrieval Time<br />
Entity – Select an entity<br />
No other fields need to be entered.<br />
Name – url3<br />
Reference Type – Metric Value<br />
Monitor Group – Select a monitor group<br />
Monitor – Select a URL monitor<br />
Metric – Select URL Retrieval Time<br />
Entity – Select an entity<br />
No other fields need to be entered.<br />
Enter the following expression on the Expression tab:<br />
Alert State<br />
avg(url1,url2,url3)<br />
This example returns 1 if monitor 1 is in a sample failure or monitor<br />
2 is unavailable.<br />
In the Add Reference dialog box create the following two monitors:<br />
Monitor 1<br />
Name – monitor1<br />
Reference Type – Alert State<br />
Monitor Group – Select a monitor group<br />
Monitor – Select a monitor<br />
Metric – Select a metric<br />
Entity – Select an entity<br />
Alert – Select Sample Failure<br />
No other fields need to be entered.<br />
Chapter 5: Configuring Monitors 165
Configuring <strong>OneSight</strong> Compound Metric Monitors<br />
Monitor 2<br />
Name – monitor2<br />
Reference Type – Alert State<br />
Monitor Group – Select a monitor group<br />
Monitor – Select a URL monitor<br />
Metric – Select URL Retrieval Time<br />
Entity – Select an entity<br />
Alert – Select URL Unavailable<br />
No other fields need to be entered.<br />
Enter the following expression on the Expression tab:<br />
(monitor1 OR monitor2)? 1 : 0<br />
Summation of Metric Value using valueOverTime<br />
This example returns a summation of metric values in the last thirty<br />
minutes for all compounded Ping monitors tagged with the selected<br />
attribute value. If the compound monitor’s frequency is five<br />
minutes, then valueOverTime() will calculate the summation value<br />
for every five minutes.<br />
In the Add Reference dialog box create the following two monitors:<br />
Monitor 1<br />
Name – attrbasedPingRef<br />
Reference Type – Metric Value<br />
Group By - Attribute<br />
Attribute Set – Select an attribute set<br />
Attribute Value – Select an attribute value<br />
Monitor Type – URL monitor<br />
Metric – Select URL Retrieval Time<br />
No other fields need to be entered.<br />
Enter the following expression on the Expression tab:<br />
valueOverTime(attrbasedPingRef,sum,”30m”)<br />
166 <strong>OneSight</strong> <strong>Administrator</strong> <strong>Guide</strong>
Configuring Database Monitors<br />
Configuring Database Monitors<br />
You can set up a monitor that performs a database query for an<br />
individual machine. The monitor can then provide information on<br />
the success or failure of that query, measured either by result time<br />
or by content matching.<br />
Note: <strong>OneSight</strong> also includes profile monitors for Oracle and SQL<br />
Server databases. These profile-based monitors use a set of<br />
preselected database metrics and allow you to apply the same<br />
settings to multiple machines.<br />
At specified time intervals, Empirix <strong>OneSight</strong> sends a database<br />
query and records the success or failure of the query based on result<br />
time or by matching a content string. For example, the monitor can<br />
perform an SQL Query on a database server using a SELECT<br />
statement.<br />
When you click Database in the Monitor Types box in the Add<br />
Monitor dialog box, settings to configure a Database monitor<br />
appear on these dialog box tabs:<br />
JDBC tab – Contains configuration information for the driver used<br />
to connect to the monitored database.<br />
Query tab – Contains the query and sampling options for a Database<br />
monitor.<br />
Alerts tab – Shows what action plan will be used when an alert<br />
occurs. Options on this tab allow you to set up or modify an action<br />
plan that responds to alerts generated by the current Database<br />
monitor. You can also configure how an alert will affect the<br />
monitor group’s health. It can result in a Warning state, a Critical<br />
state, or can have no impact on health.<br />
Locations Tab – Specifies the Data Collector Location from which<br />
the Database monitor will query the database.<br />
Chapter 5: Configuring Monitors 167
Configuring Database Monitors<br />
SmartLinks Tab – Contains the options for specifying a link to<br />
associate with a particular monitor or metric.<br />
Attributes Tab – Contains the options for specifying which attributes<br />
are applied to this monitor for Status page sorting.<br />
Monitor Groups Tab – Contains the options that you can use to<br />
specify which monitor groups the monitor is used with. This tab is<br />
available when you open the Add Monitor window by selecting<br />
Monitors from the Configure menu. It is not available when you<br />
open the Add Monitor window from the Monitor Group Editor.<br />
Access Control Tab – Contains the options for specifying which user<br />
groups have read, write, and delete permissions for this monitor.<br />
Down Time Tab – Contains the options for applying downtime to<br />
this monitor.<br />
Each monitor that you create must have a unique name. In the<br />
Monitor Name box, <strong>OneSight</strong> creates a unique name for the current<br />
monitor by combining the name of the monitor type with the<br />
database name. To change the default assigned name, type a unique<br />
monitor name that helps you to identify what this monitor does.<br />
Database Monitor JDBC Driver Options<br />
<strong>OneSight</strong> uses a JDBC driver to connect to your database. When<br />
you select any Driver other than Custom on the JDBC tab for the<br />
Database monitor, the appropriate settings for that driver are<br />
automatically provided. Use these guidelines to select and configure<br />
the appropriate driver for your database.<br />
For monitoring enterprise level databases, the native drivers (Oracle<br />
Thin JDBC driver, Inet Sprinta JDBC driver) are recommended over<br />
the JDBC:ODBC Bridge option.<br />
jTDS JDBC Driver for Microsoft SQL Server – This driver option<br />
applies to SQL databases. This driver is installed automatically as<br />
168 <strong>OneSight</strong> <strong>Administrator</strong> <strong>Guide</strong>
Configuring Database Monitors<br />
part of <strong>OneSight</strong>. For monitoring enterprise level SQL databases,<br />
the jTDS JDBC driver is recommended over the JDBC: ODBC Bridge<br />
option.<br />
This driver supports NTLM authentication. For this to work, you<br />
must leave the use name and password fields blank, and the Data<br />
Collector service must run as a domain account with access to the<br />
target SQL server.<br />
Oracle Thin JDBC Driver – This driver option applies to Oracle<br />
databases. This driver is installed automatically as part of <strong>OneSight</strong><br />
Data collectors.<br />
Inet Sprinta JDBC Driver for SQL Server – This driver option applies<br />
to SQL databases.<br />
Note: This driver is not installed with <strong>OneSight</strong>.<br />
JDBC-ODBC Bridge Driver – This driver option is available as an<br />
option for SQL and Oracle databases and any other database for<br />
which you have an ODBC driver. This bridge driver is installed<br />
automatically as part of <strong>OneSight</strong>.<br />
SQL Database – The SQL Server ODBC driver is installed with<br />
MSDE and Microsoft SQL Server. If you do not have either of<br />
these on the Empirix <strong>OneSight</strong> server and you are using a<br />
remotely installed SQL database for <strong>OneSight</strong>, you need to install<br />
the SQL Server ODBC driver on the <strong>OneSight</strong> machine and set up<br />
an ODBC DSN. The ODBC driver is included with the SQL Server<br />
Client utilities.<br />
Oracle Database – You must set up an Oracle ODBC on the<br />
<strong>OneSight</strong> machine in order to use this driver.<br />
Creating a Database Monitor<br />
You can set up a monitor that performs a database query for an<br />
individual machine. The monitor can then provide information on<br />
Chapter 5: Configuring Monitors 169
Configuring Database Monitors<br />
the success or failure of that query, measured either by result time<br />
or by content matching.<br />
To use this monitor, the appropriate driver that allows<br />
communication between <strong>OneSight</strong> and the database must be<br />
installed on the <strong>OneSight</strong> server. To monitor an SQL Server<br />
database, the appropriate drivers are automatically installed during<br />
<strong>OneSight</strong> setup.<br />
1. On the Monitors Page, click Add to open the Add Monitor<br />
dialog box.<br />
2. The Monitor Types box lists all of the types of monitors that<br />
can be applied to your monitor group. Click Database to add a<br />
monitor that issues a database query and checks the results.<br />
You will use settings on the JDBC tab to configure settings for<br />
the database connection, and then you will use settings on the<br />
Query tab to configure the specific database query.<br />
170 <strong>OneSight</strong> <strong>Administrator</strong> <strong>Guide</strong>
Configuring Database Monitors<br />
Use the options on this tab to specify how the Database monitor<br />
will connect to the database for this query.<br />
Import/Export – Click this button to display the Import Export<br />
Monitors dialog box for importing or exporting monitors of this<br />
type. Refer to ―Exporting and Importing Monitors,‖ later in this<br />
chapter for more information.<br />
Driver – Select a driver type from the list: jTDS JDBC Driver for<br />
Microsoft SQL Server, Oracle Thin JDBC driver, Inet Sprinta<br />
JDBC driver for Microsoft SQL Server, Sun JDBC:ODBC<br />
Bridge, or Custom. You must have the appropriate driver<br />
installed on the <strong>OneSight</strong> Server in order to set up a Database<br />
monitor.<br />
Note: If you are using the : jTDS JDBC Driver for Microsoft<br />
SQL Server with NTLM authentication, leave the user name and<br />
password fields blank.<br />
Driver String – This information will vary depending on the type<br />
of database that you are monitoring. If you selected any option<br />
other than Custom, the appropriate string is automatically<br />
displayed. For example, this is the string for the Oracle Thin<br />
JDBC driver:<br />
oracle.jdbc.driver.OracleDriver<br />
If you selected a Custom driver type, you can type in the Driver<br />
String yourself.<br />
Connect String – For most drivers, this string is constructed<br />
from the information you supplied in the previous fields. The<br />
structure of the Connect String is different for each driver type,<br />
but <strong>OneSight</strong> builds this string for all driver types except a<br />
Custom driver type. For a Custom driver setting, type in the<br />
Connect String.<br />
Chapter 5: Configuring Monitors 171
Configuring Database Monitors<br />
Connection Settings<br />
Host – Specify the host name of the machine running the<br />
database. This is not required for a JDBC:ODBC or Custom<br />
driver setting.<br />
Instance – Specify the SQL server instance.<br />
Port – <strong>OneSight</strong> displays the default port for the driver you<br />
selected. For example, the default port for an Oracle Thin<br />
JDBC driver is 1521. Modify the port number if necessary.<br />
This is not required for a JDBC:ODBC or Custom driver<br />
setting.<br />
Database Name or Database SID – For the Inet Sprinta driver<br />
for SQL Server, provide the database name. For the Oracle<br />
Thin JDBC driver, provide the database or server ID.<br />
System DSN – This field applies to the JDBC:ODBC Bridge<br />
driver type only. In the Windows Control Panel, locate the<br />
System DSN in the ODBC Data Sources field to confirm the<br />
name of the database. The connect string will have the<br />
following format:<br />
jdbc:odbc:<br />
Authentication<br />
User name – If a user name and password are required for<br />
access to the database, enter the user name here. The user<br />
must have system administrator privileges.<br />
Password – If a user name and password are required for<br />
access to the database, enter the password here.<br />
Test – When you add or modify a monitor, you can test JDBC<br />
and Query settings to determine if they are set appropriately.<br />
After clicking the Test button, you will see messages in the<br />
status window as the test runs and when the test completes.<br />
172 <strong>OneSight</strong> <strong>Administrator</strong> <strong>Guide</strong>
Configuring Database Monitors<br />
3. Each monitor that you add must have a unique name. You can<br />
let <strong>OneSight</strong> create a unique name, or you can type in your own<br />
name for the monitor.<br />
4. On the JDBC tab, select the driver. In this example, select Inet<br />
Sprinta JDBC Driver for Microsoft SQL Server. The driver<br />
string com.inet.tds.TdsDriver, is automatically supplied.<br />
5. For the Host Name, type the name of the <strong>OneSight</strong> Server. The<br />
default port, 1433, does not need to be changed.<br />
6. Type <strong>OneSight</strong> for the Database Name.<br />
7. For authentication information, use the database username and<br />
password for your <strong>OneSight</strong> SQL Server.<br />
8. Click the Query tab.<br />
Chapter 5: Configuring Monitors 173
Configuring Database Monitors<br />
Use the options on this tab to specify how the Database monitor<br />
will query the database.<br />
Note: <strong>OneSight</strong> does not support multiple queries.<br />
Query – Enter a valid database statement. For example, you can<br />
enter the following Oracle SELECT statement:<br />
select value from v$sysstat where statistic# = 1<br />
If your database server supports returning a result set from a<br />
stored procedure you can call the procedure. For example, the<br />
following SQL Server stored procedure, present in the <strong>OneSight</strong><br />
database, returns a result set (not an output parameter) showing<br />
the configured <strong>OneSight</strong> sample rate (samples/minute):<br />
EmpirixAdmin.p_computeSampleRate<br />
Report On – Determines the data that is returned. Select query<br />
time to report on how long it takes the database to retrieve the<br />
query results. Select Query result to return the actual data<br />
retrieved by the query.<br />
Query time – Select query time to see how long it took to<br />
execute the query.<br />
Good Content string – Enter the string that you want to match<br />
in the query. If the query result does not contain this string,<br />
an error is returned instead of the query time.<br />
Query result – Select query result to return the actual numeric<br />
result of the query. If the result does not contain a number,<br />
use the Advanced button to map strings to numbers that will<br />
be returned to <strong>OneSight</strong>. If no Perl expression or string<br />
mapping is entered, <strong>OneSight</strong> returns the result.<br />
Perl Expression – Enter the Perl expression for the value that<br />
you want to match in the query result. If the query result does<br />
not contain this value, an error is returned.<br />
174 <strong>OneSight</strong> <strong>Administrator</strong> <strong>Guide</strong>
Configuring Database Monitors<br />
Return the first column of the first row – Select this option to<br />
return the first column of the first row if there are multiple<br />
results.<br />
Loop on result items, returning the first match – Select this<br />
option to loop on each result and return the first result that<br />
matches.<br />
Concatenate result items (space delimited) – Select this option<br />
to concatenate all results and return the first result that<br />
matches. Results are space delimited.<br />
String Mappings – Use this button to display the String<br />
Mappings dialog box.<br />
<strong>OneSight</strong> collects numeric performance data. If you are<br />
measuring a JDBC result representing a string datatype, it can<br />
be converted to a number for use in <strong>OneSight</strong> by using the<br />
String Mappings field. Specify a semicolon delimited<br />
mapping of strings to integers. For example, ―false=0;true=1‖<br />
converts a false reading to a zero value in <strong>OneSight</strong>. If you<br />
only want to display the string on the <strong>OneSight</strong> status page,<br />
use a colon, rather than a semi-colon to delimit the values.<br />
Note that data that has a colon cannot be used in a string<br />
mapping.<br />
Scale – If the value that is returned should be scaled for an<br />
alternate measure, enter the scale and unit of measure here.<br />
Timeout – Enter the number of seconds after which the query<br />
will time out.<br />
Sample Every: – Specifies how often samples are<br />
taken for this monitor. Refer to, ―Sample Every Settings,‖ later<br />
in this chapter for a description of these settings.<br />
Test – When you add or modify a monitor, you can test Query<br />
and JDBC settings to determine if they are set appropriately.<br />
Chapter 5: Configuring Monitors 175
Configuring Database Monitors<br />
After clicking the Test button, you will see messages in the<br />
status window as the test runs and when the test completes.<br />
9. On the Query tab, type in the following query string:<br />
select DBVersion from tbl_dbversion where component=’database’<br />
10. The Report on should be Query result.<br />
Setting Up Oracle ODBC for <strong>OneSight</strong><br />
<strong>OneSight</strong> uses a JDBC driver to connect to your Oracle database.<br />
Two options are available.<br />
JDBC-ODBC Bridge (installed as part of <strong>OneSight</strong>)<br />
Oracle Thin JDBC driver<br />
The procedure below is required only if you are using the JDBC-<br />
ODBC Bridge to monitor an Oracle database. This requires three<br />
separate steps:<br />
1. Install the Oracle Client on the <strong>OneSight</strong> machine.<br />
2. Create the Oracle service.<br />
3. Set up the ODBC DSN.<br />
Installing the Oracle Client<br />
Use your Oracle CD to install the Oracle client on the <strong>OneSight</strong><br />
machine. Use the suggested default values.<br />
Creating the Oracle Service<br />
1. Open Oracle’s Net8 Easy Config application to create a new<br />
service. You need to create a service for every Oracle system<br />
you want to monitor.<br />
176 <strong>OneSight</strong> <strong>Administrator</strong> <strong>Guide</strong>
Configuring Database Monitors<br />
2. Provide a protocol (TCP/IP), a host name or IP address, and the<br />
SID of the machine.<br />
3. Test the service.<br />
Setting up the ODBC DSN<br />
1. In the Control Panel dialog box, double-click ODBC Data<br />
Sources.<br />
2. In the ODBC Data Source <strong>Administrator</strong> dialog box. Select the<br />
System DSN tab, then click Add. Select the Oracle ODBC driver.<br />
3. Enter a Data Source Name, Under Data Source, enter the Oracle<br />
service name (created in the step above) or type in an IP<br />
address. In the User field, type in a user name that has<br />
administrator privileges.<br />
4. You can use the Oracle ODBC test to confirm the system data<br />
sources. After opening Oracle ODBC Test, click Connect. Click<br />
the Machine Data Source tab and select your Data Source.<br />
Click All Tables to confirm the data you expect is present.<br />
After completing these procedures, open the <strong>OneSight</strong> System<br />
Editor and create a Database component. Click the new component,<br />
and use the Component and JDBC tabs to fill in the information for<br />
monitoring the Oracle database. Use the system editor to create this<br />
component for each system you want to monitor.<br />
Setting Up DataDirect JDBC Driver for <strong>OneSight</strong><br />
The SQL Server and the data collector for the location being<br />
monitored must be running under a user account.<br />
SQL Server Configuration<br />
1. Stop the SQL Server service.<br />
Chapter 5: Configuring Monitors 177
Configuring Database Monitors<br />
2. For SQL Server 2000 use Enterprise Manager. For SQL Server<br />
2005 use the Management Studio. Go to SQL Server properties.<br />
3. Select the Security tab.<br />
4. Allow SQL Server and Windows authentication.<br />
5. Select run using this account instead of the local system<br />
account.<br />
6. Enter the Windows user name and password.<br />
7. Restart the SQL Server service.<br />
Data Collector Configuration<br />
The data collector must be in the same domain as the monitored<br />
SQL Server.<br />
1. Copy the following files from the DataDirect lib directory to<br />
the webapps\ROOT\WEB-INF\lib directory of the <strong>OneSight</strong><br />
DataCollector install directory. This lets the <strong>OneSight</strong> Data<br />
Collector to load the required jar files from DataDirect.<br />
base.jar<br />
sqlserver.jar<br />
util.jar<br />
2. Use one of the following methods to place the <strong>OneSight</strong> Data<br />
Collector service in the same active user account as the MSSQL<br />
user account:<br />
Run the <strong>OneSight</strong> Data Collector service under the specified<br />
user account instead of the local system account.<br />
Log in to Windows and leave the session logged in so that<br />
Windows knows the current active user information.<br />
178 <strong>OneSight</strong> <strong>Administrator</strong> <strong>Guide</strong>
Configuring Database Monitors<br />
Monitoring Multiple Rows in a Database<br />
You can monitor multiple rows in a database by creating a custom<br />
component, creating a profile, then applying the profile to the<br />
component.<br />
To create a custom component:<br />
1. Select Systems from the Configure menu.<br />
2. Select the system you want to monitor and click Modify or click<br />
Add to create a system.<br />
3. Select Add.<br />
4. Select Add New Component Type.<br />
5. Enter a name and description.<br />
6. Select JDBC and click OK.<br />
7. Fill in the connection information on the JDBC tab.<br />
8. In the Query field, enter the query. For example, select<br />
stor_id from sales.<br />
9. Click Discover Components.<br />
10. In the Discover Components Configuration dialog box, select<br />
JDBC and click OK.<br />
11. Click Cancel in the Discovery Status window. Discovered<br />
components are added under the custom type in the components<br />
tree.<br />
12. Click OK to save the discovery for the system.<br />
Chapter 5: Configuring Monitors 179
Configuring Database Monitors<br />
To create the database profile:<br />
1. Select Profiles from the Configure menu.<br />
2. Click Add.<br />
3. Enter a name and description for the profile.<br />
4. Select Global Metric Manager.<br />
5. Click Add.<br />
6. Enter a name and description for the metric.<br />
7. In the Sample for Each field on the General tab, select the<br />
custom component that you created.<br />
8. On the Data Sources tab, select JDBC as the data source.<br />
9. Enter the query using the %instance_n% variable. In the<br />
components tree, each custom node is assigned a value. In this<br />
example, there is one custom node ―A.‖ It’s value is 1. If there<br />
were another custom component it’s value would be 2 and so<br />
forth. Replace the n with the value corresponding to the node<br />
you want to monitor. In this example, the query is select<br />
storid from sales where stor_id=’%instance_1%’<br />
10. Click OK.<br />
11. Click Close.<br />
12. Click OK.<br />
To apply the profile:<br />
1. Select Monitors from the Configure menu.<br />
2. Select Add.<br />
180 <strong>OneSight</strong> <strong>Administrator</strong> <strong>Guide</strong>
Configuring DNS Monitors<br />
3. Expand the Profiles node and select the profile you just created.<br />
4. Click Next.<br />
5. Select the system you want to apply it to, and click Next.<br />
6. Click Finish.<br />
7. Click OK to exit.<br />
Configuring DNS Monitors<br />
The DNS monitor checks the Domain Name System (DNS) Server<br />
via the network.<br />
At specified time intervals, a DNS monitor verifies that the DNS<br />
servers are accepting requests and also verifies that the addresses<br />
for specific domain names can be found.<br />
If no response is received within a timeout period, or if a DNS<br />
response indicates any errors or no address found, an alert with an<br />
error message is generated. Optionally, the IP address returned by<br />
the DNS server can be compared with an expected IP address<br />
specified by the user. If they are not equal, an alert with an error<br />
message is generated.<br />
The DNS monitor performs the following tasks:<br />
Verifies that a DNS server is accepting requests.<br />
Verifies that the addresses for specific domain names can be<br />
found.<br />
Ensures that responses occur within a timeout value.<br />
If a Host address is specified, verifies that the IP address returned<br />
by the DNS server matched an expected IP address.<br />
Chapter 5: Configuring Monitors 181
Configuring DNS Monitors<br />
In the Add Monitor dialog box, when you click DNS in the Monitor<br />
Types box, settings to configure a DNS monitor appear on these<br />
dialog box tabs:<br />
General Tab – Contains the options that you can use to create a DNS<br />
monitor for your monitor group.<br />
Alerts Tab – Shows what action plan will be used when an alert<br />
occurs. Options on this tab allow you to set up or modify an action<br />
plan that responds to alerts generated by the current DNS monitor.<br />
You can also configure how an alert will affect the monitor group’s<br />
health. It can result in a Warning state, a Critical state, or can have<br />
no impact on health. New alerts cannot be added to DNS monitors.<br />
Locations Tab – Specifies the Data Collector Location to use as a<br />
DNS monitor for your monitor group.<br />
SmartLinks Tab – Contains the options for specifying a link to<br />
associate with a particular monitor or metric.<br />
Attributes Tab – Contains the options for specifying which attributes<br />
are applied to this monitor for Status page sorting.<br />
Monitor Groups Tab – Contains the options that you can use to<br />
specify which monitor groups the monitor is used with. This tab is<br />
available when you open the Add Monitor window by selecting<br />
Monitors from the Configure menu. It is not available when you<br />
open the Add Monitor window from the Monitor Group Editor.<br />
Access Control Tab – Contains the options for specifying which user<br />
groups have read, write, and delete permissions for this monitor.<br />
Down Time Tab – Contains the options for applying downtime to<br />
this monitor.<br />
Each monitor that you create must have a unique name. In the<br />
Monitor Name box, <strong>OneSight</strong> creates a unique name for the current<br />
monitor by combining the name of the monitor type with the name<br />
182 <strong>OneSight</strong> <strong>Administrator</strong> <strong>Guide</strong>
Configuring DNS Monitors<br />
of the host to which the monitor applies. To change the default<br />
assigned name, type a unique monitor name that helps you to<br />
identify what this monitor does.<br />
An apparent web server failure may be caused by a problem with a<br />
domain name server that translates host names to Internet addresses.<br />
Create a DNS monitor to evaluate the performance of the domain<br />
name resolution system for your web site.<br />
To create a DNS monitor:<br />
1. On the Monitors Page, click Add to open the Add Monitor<br />
dialog box.<br />
2. The Monitor Types box lists all of the types of monitors that<br />
can be applied to your monitor group. Click DNS to add a<br />
monitor that checks the availability and responsiveness of a<br />
specific domain name server. You will use settings on the<br />
General tab to configure a DNS monitor.<br />
Chapter 5: Configuring Monitors 183
Configuring DNS Monitors<br />
Import/Export – Click this button to display the Import Export<br />
Monitors dialog box for importing or exporting monitors of this<br />
type. Refer to ―Exporting and Importing Monitors,‖ later in this<br />
chapter for more information.<br />
DNS Server – Specifies the IP address of the DNS server. The<br />
monitor will verify that this DNS server is accepting requests.<br />
Host Name – Specifies the host name to look up on the DNS<br />
server. Depending on your network and system configuration,<br />
you may need to enter a fully qualified DNS name.<br />
Host Address – Specifies the IP address of the host that the DNS<br />
server is looking up. The monitor will verify that the IP address<br />
returned by the DNS server matches the host address specified<br />
in this box. This feature is optional.<br />
Timeout Seconds – Specifies the number of seconds to wait<br />
for a DNS reply. The value must be between 1 and 30, inclusive.<br />
If a DNS reply is not received in this amount of time, the DNS<br />
request is retried.<br />
Retries – Sets the upper limit for the number of times a DNS<br />
request is retried after timing out. For example, if Retry is set to<br />
3, the DNS request will be sent up to four times (the initial try<br />
plus three retries). After the fourth try, if no response is<br />
received, the DNS check is treated as a sample failure.<br />
On Failure – Indicates whether to include additional information<br />
in an alert when the monitor fails.<br />
Include Traceroute in alert – Includes a trace route in the alert.<br />
Include Ping in alert – Includes the results of a ping in the<br />
alert. This option is faster than including the trace route in<br />
the alert.<br />
Do Nothing – Does not include any additional information in<br />
the alert.<br />
184 <strong>OneSight</strong> <strong>Administrator</strong> <strong>Guide</strong>
Configuring DNS Monitors<br />
Sample Every: – Specifies how often samples are<br />
taken for this monitor. Refer to, ―Sample Every Settings,‖ later<br />
in this chapter for a description of these settings.<br />
Test – When you add or modify a monitor, you can test settings<br />
to determine if they are set appropriately. After clicking the<br />
Test button, you will see messages in the status window as the<br />
test runs and when the test completes.<br />
3. Each monitor that you add must have a unique name. You can<br />
let <strong>OneSight</strong> create a unique name using the DNS specifications<br />
you supply, or you can type in your own name for the monitor.<br />
4. On the General tab in the DNS Server box, type in the IP<br />
address of the domain name server that you want to monitor.<br />
5. Type in a Host Name that the DNS server should resolve. You<br />
can also type in the IP address of the host name you specify in<br />
the Host Address box so that the monitor will verify that the IP<br />
address returned by the DNS server matches the address you<br />
specify here.<br />
6. By default, a DNS monitor will check the availability and<br />
responsiveness of the domain name server every 10 minutes and<br />
will time out after 10 seconds if the name is not resolved. If you<br />
want the monitor to sample more or less frequently, change the<br />
sampling interval. If you want to have the timeout occur earlier<br />
or later, change the Timeout setting.<br />
7. To verify that the monitor will work as configured, click the<br />
Test button. The Monitor Test window provides information<br />
about the success or failure of the test and indicates what may<br />
be causing any problem.<br />
8. If the test succeeds, click OK in the Add Monitor dialog box to<br />
save these basic DNS monitor settings. You can now add this<br />
monitor to a monitor group. Refer to Adding Monitors to a<br />
Monitor Group in Chapter 4.<br />
Chapter 5: Configuring Monitors 185
Configuring Gomez GPN Monitors<br />
Configuring Gomez GPN Monitors<br />
Gomez GPN is Empirix’s hosted service that lets you monitor your<br />
Web site in real time, using objective performance data gathered<br />
from points on a global network. The service lets you monitor your<br />
web site performance from outside of your firewall from a secure<br />
network that spans five continents. If you have a Gomez GPN<br />
account, you can create a Gomez GPN monitor to provide external<br />
measurements from outside your firewall, and then correlate these<br />
measurements with the performance of internal systems. (See<br />
www.empirix.com for more information about the Gomez GPN<br />
service.)<br />
The Gomez GPN Monitor retrieves data for the monitors you have<br />
configured within your Gomez GPN service account. Data is<br />
aggregated for all locations.<br />
In the Add Monitor dialog box, when you click Gomez GPN in the<br />
Monitor Types box, settings to configure a Gomez GPN monitor<br />
appear on these dialog box tabs:<br />
General Tab – Contains the options that you can use to create a<br />
Gomez GPN monitor for your monitor group.<br />
Proxy Tab – Contains the options that you can use to configure a<br />
Proxy Server to use with a Gomez GPN monitor for your monitor<br />
group.<br />
Alerts Tab – Shows what action plan will be used when an alert<br />
occurs. Options on this tab allow you to set up or modify an action<br />
plan that responds to alerts generated by the current Gomez GPN<br />
monitor. You can also configure how an alert will affect the<br />
monitor group’s health. It can result in a Warning state, a Critical<br />
state, or can have no impact on health.<br />
Locations Tab – Specifies the Data Collector Location from which<br />
the monitor checks performance.<br />
186 <strong>OneSight</strong> <strong>Administrator</strong> <strong>Guide</strong>
Configuring Gomez GPN Monitors<br />
SmartLinks Tab – Contains the options for specifying a link to<br />
associate with a particular monitor or metric.<br />
Attributes Tab – Contains the options for specifying which attributes<br />
are applied to this monitor for Status page sorting.<br />
Monitor Groups Tab – Contains the options that you can use to<br />
specify which monitor groups the monitor is used with. This tab is<br />
available when you open the Add Monitor window by selecting<br />
Monitors from the Configure menu. It is not available when you<br />
open the Add Monitor window from the Monitor Group Editor.<br />
Access Control Tab – Contains the options for specifying which user<br />
groups have read, write, and delete permissions for this monitor.<br />
Down Time Tab – Contains the options for applying downtime to<br />
this monitor.<br />
Each monitor that you create must have a unique name. In the<br />
Monitor Name box, <strong>OneSight</strong> creates a unique name for the current<br />
monitor by combining the name of the monitor type with the name<br />
of the host to which the monitor applies. To change the default<br />
assigned name, type a unique monitor name that helps you to<br />
identify what this monitor does.<br />
To create a Gomez GPN monitor:<br />
8. On the Monitors Page, click Add to open the Add Monitor<br />
dialog box.<br />
Chapter 5: Configuring Monitors 187
Configuring Gomez GPN Monitors<br />
9. The Monitor Types box lists all of the types of monitors that<br />
can be applied to your monitor group. Click Gomez GPN to add<br />
a monitor that checks the availability and responsiveness of a<br />
selected monitor from the Gomez GPN service. You will use<br />
settings on the General tab to configure a Gomez GPN monitor.<br />
User ID – Type the User ID of your Gomez GPN service<br />
account.<br />
Password – Type the password of your Gomez GPN service<br />
account.<br />
Get Gomez GPN Monitors – After you provide the account<br />
information (User ID, Password), click Get Gomez GPN<br />
Monitors to retrieve the active monitors configured in your<br />
Gomez GPN service account. If you have previously specified<br />
188 <strong>OneSight</strong> <strong>Administrator</strong> <strong>Guide</strong>
Configuring Gomez GPN Monitors<br />
this account information, these monitors will be retrieved<br />
automatically.<br />
Monitors – After you click Get Gomez GPN Monitors, the active<br />
monitors configured in your Gomez GPN service account will<br />
be displayed in this list box.<br />
Location – Select the location for collecting the data.<br />
Step – Select the step to use for monitoring.<br />
Test – When you add or modify a monitor, you can test settings<br />
to determine if they are set appropriately. After clicking the<br />
Test button, you will see messages in the status window as the<br />
test runs and when the test completes.<br />
10. Each monitor that you add must have a unique name. You can<br />
let <strong>OneSight</strong> create a unique name using the Gomez GPN<br />
specifications you supply, or you can type in your own name<br />
for the monitor.<br />
11. On the General tab in the User ID box, type the name of your<br />
Gomez GPN User ID.<br />
12. On the General tab in the Password box, type your Gomez GPN<br />
password.<br />
13. Click Get Gomez GPN Monitors. Using the login information<br />
you have specified, the active monitors configured in your<br />
Gomez GPN service account are identified and listed here. If<br />
you have previously specified this account information, these<br />
monitors will be retrieved automatically.<br />
14. To verify that the monitor will work as configured, click the<br />
Test button. The Monitor Test window provides information<br />
about the success or failure of the test and indicates what may<br />
be causing any problem.<br />
Chapter 5: Configuring Monitors 189
Configuring Gomez GPN Monitors<br />
15. If the test succeeds, click OK in the Add Monitor dialog box to<br />
save these basic Gomez GPN monitor settings. You can now<br />
add this monitor to a monitor group. Refer to Adding Monitors<br />
to a Monitor Group in Chapter 4.<br />
To Specify Proxy Server Settings<br />
Use the options on the Proxy tab to specify proxy server settings.<br />
Proxy Server Settings – If your network makes use of a proxy server,<br />
you can specify this information here. Check Use a proxy server and<br />
add the information below.<br />
If you find that a <strong>OneSight</strong> Gomez GPN monitor fails to reach a<br />
URL when your browser successfully connects to the same URL,<br />
check your proxy server settings in your browser. For example, in<br />
190 <strong>OneSight</strong> <strong>Administrator</strong> <strong>Guide</strong>
Configuring Gomez GPN Profile Monitors<br />
Internet Explorer, select Internet Options from the Tools menu and<br />
then click LAN settings on the Connections tab. If proxy server<br />
settings are configured for your browser, they may also need to be<br />
configured for the Gomez GPN monitor.<br />
Proxy Host – The IP address of the proxy server.<br />
Port – The port of the proxy server.<br />
Proxy User Name – The username for the proxy server.<br />
Password – The password for the proxy server.<br />
Configuring Gomez GPN Profile Monitors<br />
Gomez GPN is Empirix’s hosted service that lets you monitor your<br />
Web site in real time, using objective performance data gathered<br />
from points on a global network. The service lets you monitor your<br />
web site performance from outside of your firewall from a secure<br />
network that spans five continents. If you have a Gomez GPN<br />
account, you can create a Gomez GPN monitor to provide external<br />
measurements from outside your firewall, and then correlate these<br />
measurements with the performance of internal systems. (See<br />
www.empirix.com for more information about the Gomez GPN<br />
service.)<br />
The Gomez GPN profile Monitor retrieves data for the monitors you<br />
have configured within your Gomez GPN service account. Data is<br />
aggregated for all locations.<br />
In the Add Monitor dialog box, when you click Gomez GPN in the<br />
Monitor Types box, settings to configure a Gomez GPN monitor<br />
appear on these dialog box tabs:<br />
General Tab – Contains the options that you can use to create a<br />
Gomez GPN profile monitor for your monitor group.<br />
Chapter 5: Configuring Monitors 191
Configuring Gomez GPN Profile Monitors<br />
Proxy Tab – Contains the options that you can use to configure a<br />
Proxy Server to use with a Gomez GPN profile monitor for your<br />
monitor group.<br />
Alerts Tab – Shows what action plan will be used when an alert<br />
occurs. Options on this tab allow you to set up or modify an action<br />
plan that responds to alerts generated by the current Gomez GPN<br />
profile monitor. You can also configure how an alert will affect the<br />
monitor group’s health. It can result in a Warning state, a Critical<br />
state, or can have no impact on health.<br />
Locations Tab – Specifies the Data Collector Location from which<br />
the monitor checks performance.<br />
Attributes Tab – Contains the options for specifying which attributes<br />
are applied to this monitor for Status page sorting.<br />
Monitor Groups Tab – Contains the options that you can use to<br />
specify which monitor groups the monitor is used with. This tab is<br />
available when you open the Add Monitor window by selecting<br />
Monitors from the Configure menu. It is not available when you<br />
open the Add Monitor window from the Monitor Group Editor.<br />
Access Control Tab – Contains the options for specifying which user<br />
groups have read, write, and delete permissions for this monitor.<br />
Down Time Tab – Contains the options for applying downtime to<br />
this monitor.<br />
Each monitor that you create must have a unique name. In the<br />
Monitor Name box, <strong>OneSight</strong> creates a unique name for the current<br />
monitor by combining the name of the monitor type with the name<br />
of the host to which the monitor applies. To change the default<br />
assigned name, type a unique monitor name that helps you to<br />
identify what this monitor does.<br />
192 <strong>OneSight</strong> <strong>Administrator</strong> <strong>Guide</strong>
Configuring Gomez GPN Profile Monitors<br />
To create a Gomez GPN profile monitor:<br />
1. On the Monitors Page, click Add to open the Add Monitor<br />
dialog box.<br />
2. The Monitor Types box lists all of the types of monitors that<br />
can be applied to your monitor group. Expand the Profiles node<br />
and click Gomez GPN Profile to add a monitor that checks the<br />
availability and responsiveness of a selected monitor from the<br />
Gomez GPN service. You will use settings on the General tab to<br />
configure a Gomez GPN profile monitor.<br />
User ID – Type the User ID of your Gomez GPN service<br />
account.<br />
Password – Type the password of your Gomez GPN service<br />
account.<br />
Chapter 5: Configuring Monitors 193
Configuring Gomez GPN Profile Monitors<br />
Get Gomez GPN Monitor – After you provide the account<br />
information (User ID, Password), click Get Gomez GPN Monitor<br />
to retrieve the active monitors configured in your Gomez GPN<br />
service account. If you have previously specified this account<br />
information, these monitors will be retrieved automatically.<br />
Info – Displays information about the selected monitor.<br />
3. Each monitor that you add must have a unique name. You can<br />
let <strong>OneSight</strong> create a unique name using the Gomez GPN<br />
specifications you supply, or you can type in your own name<br />
for the monitor.<br />
4. On the General tab in the User ID box, type the name of your<br />
Gomez GPN User ID.<br />
5. On the General tab in the Password box, type your Gomez GPN<br />
password.<br />
6. Click Get Gomez GPN Monitor. Using the login information you<br />
have specified, the active monitors configured in your Gomez<br />
GPN service account are identified and listed in the Select<br />
Gomez GPN Monitor dialog box.<br />
7. Select the monitor you want to use and click OK.<br />
8. To verify that the monitor will work as configured, click the<br />
Test button. The Monitor Test window provides information<br />
about the success or failure of the test and indicates what may<br />
be causing any problem.<br />
9. If the test succeeds, click OK in the Add Monitor dialog box to<br />
save these basic Gomez GPN profile monitor settings. You can<br />
now add this monitor to a monitor group. Refer to Adding<br />
Monitors to a Monitor Group in Chapter 4.<br />
194 <strong>OneSight</strong> <strong>Administrator</strong> <strong>Guide</strong>
Configuring Gomez GPN Profile Monitors<br />
To Specify Proxy Server Settings<br />
Use the options on the Proxy tab to specify proxy server settings.<br />
Proxy Server Settings – If your network makes use of a proxy server,<br />
you can specify this information here. Check Use a proxy server and<br />
add the information below.<br />
If you find that a <strong>OneSight</strong> Gomez GPN monitor fails to reach a<br />
URL when your browser successfully connects to the same URL,<br />
check your proxy server settings in your browser. For example, in<br />
Internet Explorer, select Internet Options from the Tools menu and<br />
then click LAN settings on the Connections tab. If proxy server<br />
settings are configured for your browser, they may also need to be<br />
configured for the Gomez GPN monitor.<br />
Chapter 5: Configuring Monitors 195
Configuring <strong>OneSight</strong> Call Statistics Profile Monitors<br />
Proxy Host – The IP address of the proxy server.<br />
Port – The port of the proxy server.<br />
Proxy User Name – The username for the proxy server.<br />
Password – The password for the proxy server.<br />
Configuring <strong>OneSight</strong> Call Statistics Profile<br />
Monitors<br />
<strong>OneSight</strong> Call Statistics Profile Monitors let you monitor call center<br />
devices that are configured to talk to the call statistics server.<br />
In the Add Monitor dialog box, when you click <strong>OneSight</strong> Call<br />
Statistics Profile in the Monitor Types box, settings to configure a<br />
<strong>OneSight</strong> Call Statistics Profile monitor appear on these dialog box<br />
tabs:<br />
General Tab – Contains the options that you can use to create a<br />
<strong>OneSight</strong> Call Statistics Profile monitor for your call center.<br />
Alerts Tab – Shows what action plan will be used when an alert<br />
occurs. Options on this tab allow you to set up or modify an action<br />
plan that responds to alerts generated by the current <strong>OneSight</strong> Call<br />
Statistics Profile monitor. You can also configure how an alert will<br />
affect the monitor group’s health. It can result in a Warning state, a<br />
Critical state, or can have no impact on health.<br />
Locations Tab – Specifies the Data Collector Location from which<br />
the monitor checks performance.<br />
Attributes Tab – Contains the options for specifying which attributes<br />
are applied to this monitor for Status page sorting.<br />
Monitor Groups Tab – Contains the options that you can use to<br />
specify which monitor groups the monitor is used with. This tab is<br />
196 <strong>OneSight</strong> <strong>Administrator</strong> <strong>Guide</strong>
Configuring <strong>OneSight</strong> Call Statistics Profile Monitors<br />
available when you open the Add Monitor window by selecting<br />
Monitors from the Configure menu. It is not available when you<br />
open the Add Monitor window from the Monitor Group Editor.<br />
Access Control Tab – Contains the options for specifying which user<br />
groups have read, write, and delete permissions for this monitor.<br />
Down Time Tab – Contains the options for applying downtime to<br />
this monitor.<br />
Monitor Name – Each monitor that you create must have a unique<br />
name. In the Monitor Name box, <strong>OneSight</strong> creates a unique name<br />
for the current monitor by combining the name of the monitor type<br />
with the name of the host to which the monitor applies. To change<br />
the default assigned name, type a unique monitor name that helps<br />
you to identify what this monitor does.<br />
Profile – Lists the profiles that are available to apply to this monitor.<br />
Multiple profiles may be listed if you have upgraded from a<br />
previous version of <strong>OneSight</strong>.<br />
Modify – Displays the <strong>OneSight</strong> Profile Editor that lets you add and<br />
remove metrics, and configure alerts, smartlinks, and attributes for<br />
this profile.<br />
To create a <strong>OneSight</strong> Call Statistics Profile monitor:<br />
1. On the Monitors Page, click Add to open the Add Monitor<br />
dialog box.<br />
Chapter 5: Configuring Monitors 197
Configuring <strong>OneSight</strong> Call Statistics Profile Monitors<br />
2. The Monitor Types box lists all of the types of monitors that<br />
can be applied to your monitor group. Click <strong>OneSight</strong> Call<br />
Statistics. You will use settings on the General tab to configure<br />
a <strong>OneSight</strong> Call Statistics Profile monitor.<br />
Server Name – Type the name or IP address of the <strong>OneSight</strong><br />
Call Statistics server.<br />
Server Port – Enter the port for the <strong>OneSight</strong> Call Statistics<br />
server.<br />
Sample Every: – Specifies how often samples are<br />
taken for this monitor. Refer to, ―Sample Every Settings,‖ later<br />
in this chapter for a description of these settings.<br />
Sample Continuously – Select this option when you want data<br />
sent whenever the agent has it.<br />
198 <strong>OneSight</strong> <strong>Administrator</strong> <strong>Guide</strong>
Configuring <strong>OneSight</strong> Call Statistics Profile Monitors<br />
– lists the devices that are configured to talk to the<br />
<strong>OneSight</strong> Call Statistics server.<br />
Discover Devices – After you provide the Server and Port<br />
information, click Discover Devices to retrieve the available<br />
devices.<br />
String Mappings – Displays the String Mappings dialog box for<br />
specifying string mappings.<br />
String Mappings – <strong>OneSight</strong> collects numeric performance<br />
data. If you are measuring a <strong>OneSight</strong> Call Statistics object<br />
representing a String datatype, it can be converted to a<br />
number for use in <strong>OneSight</strong> by using the <strong>OneSight</strong> Call<br />
Statistics String Mappings field. Simply specify a semicolon<br />
delimited mapping of Strings to Integers. For example,<br />
―false=0;true=1‖; will convert a ―false‖ reading to a 0 value<br />
in <strong>OneSight</strong>, and this will be displayed in <strong>OneSight</strong> Status as<br />
―false=0‖. If you only want to display the string on the<br />
<strong>OneSight</strong> status page, use a colon, rather than a semi-colon to<br />
delimit the values.<br />
If you neglect to provide a mapping for a specific string,<br />
<strong>OneSight</strong> will consider this a Sample Failure, and report the<br />
String that was returned. String Mappings can also be used to<br />
translate a number to a String for display in <strong>OneSight</strong> Status.<br />
This is helpful when numbers represent an objects state.<br />
Note that string matching is case-insensitive and data that has<br />
a colon cannot be used in string mapping.<br />
Set Primary Keys – After you select either an entire table or a<br />
column in the table, click Set Primary Keys to select the row in<br />
the table.<br />
3. Each monitor that you add must have a unique name. You can<br />
let <strong>OneSight</strong> create a unique name using the <strong>OneSight</strong> Call<br />
Statistics specifications you supply, or you can type in your<br />
own name for the monitor.<br />
Chapter 5: Configuring Monitors 199
Configuring <strong>OneSight</strong> Call Statistics Profile Monitors<br />
4. On the General tab in the Server name box, type the name or IP<br />
address of your <strong>OneSight</strong> Call Statistics server.<br />
5. Enter the server port.<br />
6. Click Discover Devices. The available devices and their<br />
database tables are listed.<br />
7. Select the device and tables that you want to monitor and click<br />
Set Primary Keys. The primary keys for the selected table are<br />
displayed. This dialog box lets you select the row that you want<br />
to monitor.<br />
Table name – lists the name of the table.<br />
Primary Key – lists the primary keys available in the selected<br />
tables.<br />
Value – lists the values associated with the key. The selected<br />
value determines which row you are selecting.<br />
8. Click the Value field to list the available values. Select a value<br />
and click OK.<br />
200 <strong>OneSight</strong> <strong>Administrator</strong> <strong>Guide</strong>
Configuring <strong>OneSight</strong> Probe Monitors<br />
9. Click OK in the Add Monitor dialog box to save these basic<br />
<strong>OneSight</strong> Call Statistics Profile monitor settings. You can now<br />
add this monitor to a monitor group. Refer to Adding Monitors<br />
to a Monitor Group in Chapter 4.<br />
Configuring <strong>OneSight</strong> Probe Monitors<br />
The <strong>OneSight</strong> Probe monitor uses a customer created probe,<br />
referred to as a self-describing probe (SDP) as a data source for<br />
reporting information for monitoring. The SDP allows unrestricted<br />
collection of information for metrics that are not known to<br />
<strong>OneSight</strong>. Refer to the <strong>OneSight</strong> Probe Reference Manual for<br />
details on creating an SDP.<br />
In the Add Monitor dialog box, when you click <strong>OneSight</strong> Probe in<br />
the Monitor Types box, settings to configure a <strong>OneSight</strong> Probe<br />
monitor appear on these dialog box tabs:<br />
General Tab – Contains the options that you can use to create a<br />
<strong>OneSight</strong> Probe monitor.<br />
Alerts Tab – Shows what action plan will be used when an alert<br />
occurs. Options on this tab allow you to set up or modify an action<br />
plan that responds to alerts generated by the current <strong>OneSight</strong> Probe<br />
monitor. You can also configure how an alert will affect the<br />
monitor group’s health. It can result in a Warning state, a Critical<br />
state, or can have no impact on health.<br />
SmartLinks Tab – Contains the options for specifying a link to<br />
associate with a particular monitor or metric.<br />
Attributes Tab – Contains the options for specifying which attributes<br />
are applied to this monitor for Status page sorting.<br />
Monitor Groups Tab – Contains the options that you can use to<br />
specify which monitor groups the monitor is used with. This tab is<br />
available when you open the Add Monitor window by selecting<br />
Chapter 5: Configuring Monitors 201
Configuring <strong>OneSight</strong> Probe Monitors<br />
Monitors from the Configure menu. It is not available when you<br />
open the Add Monitor window from the Monitor Group Editor.<br />
Access Control Tab – Contains the options for specifying which user<br />
groups have read, write, and delete permissions for this monitor.<br />
Down Time Tab – Contains the options for applying downtime to<br />
this monitor.<br />
Each monitor that you create must have a unique name. In the<br />
Monitor Name box, <strong>OneSight</strong> creates a unique name for the current<br />
monitor by combining the name of the monitor type with the name<br />
of the host to which the monitor applies. To change the default<br />
assigned name, type a unique monitor name that helps you to<br />
identify what this monitor does.<br />
To create a <strong>OneSight</strong> Probe monitor:<br />
1. On the Monitors Page, click Add to open the Add Monitor<br />
dialog box.<br />
202 <strong>OneSight</strong> <strong>Administrator</strong> <strong>Guide</strong>
Configuring <strong>OneSight</strong> Probe Monitors<br />
2. The Monitor Types box lists all of the types of monitors that<br />
can be applied to your monitor group. Click <strong>OneSight</strong> Probe to<br />
add a monitor. You will use settings on the General tab to<br />
configure a <strong>OneSight</strong> Probe monitor.<br />
Import/Export – Click this button to display the Import Export<br />
Monitors dialog box for importing or exporting monitors of this<br />
type. Refer to ―Exporting and Importing Monitors,‖ later in this<br />
chapter for more information.<br />
Collector Host Name – Enter the host name of the data collector<br />
to which the probe is registered.<br />
Sample Continuously – Select this option when you want data<br />
sent whenever the agent has it.<br />
Sample Every: – Specifies how often samples are<br />
taken for this monitor. Refer to, ―Sample Every Settings,‖ later<br />
in this chapter for a description of these settings.<br />
Chapter 5: Configuring Monitors 203
Configuring <strong>OneSight</strong> Probe Monitors<br />
Discover Probes and Metrics – Discovers the probes and metrics<br />
and populates the list as a tree.<br />
Info - Displays details about the probe and the metric.<br />
Metric Type – Select the type of metric.<br />
Perl Expression Value – Lets you enter a Perl Expression for<br />
parsing the results.<br />
Total Records Encountered Since Last Sample – Returns the<br />
number of records added since the last sample.<br />
Perl Expression – Enter the Perl Expression to use to parse the<br />
results. Refer to “Using Regular Expressions for Pattern<br />
Matching,” later in this chapter for more information.<br />
3. Each monitor that you add must have a unique name. You can<br />
let <strong>OneSight</strong> create a unique name using the <strong>OneSight</strong> Probe<br />
specifications you supply, or you can type in your own name<br />
for the monitor.<br />
4. On the General tab in the Collector Host Name field, enter the<br />
host name of the data collector to which the probe is registered.<br />
5. Click Discover Probes and Metrics. The probes and metrics on<br />
the specified data collector are displayed in a tree view.<br />
6. Select the metric you want to monitor.<br />
7. Select the metric type.<br />
8. To verify that the monitor will work as configured, click the<br />
Test button. The Monitor Test window provides information<br />
about the success or failure of the test and indicates what may<br />
be causing any problem.<br />
9. If the test succeeds, click OK in the Add Monitor dialog box to<br />
save these basic <strong>OneSight</strong> Probe monitor settings. You can now<br />
204 <strong>OneSight</strong> <strong>Administrator</strong> <strong>Guide</strong>
Configuring <strong>OneSight</strong> Voice Transaction Profile Monitors<br />
add this monitor to a monitor group. Refer to Adding Monitors<br />
to a Monitor Group in Chapter 4.<br />
Configuring <strong>OneSight</strong> Voice Transaction Profile<br />
Monitors<br />
<strong>OneSight</strong> Voice Transaction Profile Monitor lets you monitor your<br />
call center in real time, using objective performance data gathered<br />
from your CallMaster server. If you have your own CallMaster<br />
server, you can create a <strong>OneSight</strong> Voice Transaction Profile<br />
monitor in <strong>OneSight</strong> to verify the performance of your telephonybased<br />
voice transaction systems.<br />
Note: The Hammer CallMaster server and the proxy server must be<br />
the same version.<br />
The <strong>OneSight</strong> Voice Transaction Profile monitor lets you select<br />
which steps you want to test in the script.<br />
The <strong>OneSight</strong> Voice Transaction Profile monitor retrieves data for<br />
the monitors you have configured within your <strong>OneSight</strong> Voice<br />
Engine.<br />
In the Add Monitor dialog box, when you click <strong>OneSight</strong> Voice<br />
Transaction Profile in the Monitor Types box, settings to configure<br />
a <strong>OneSight</strong> Voice Transaction Profile monitor appear on these<br />
dialog box tabs:<br />
General Tab – Contains the options that you can use to create a<br />
<strong>OneSight</strong> Voice Transaction Profile monitor for your call center.<br />
Alerts Tab – Shows what action plan will be used when an alert<br />
occurs. Options on this tab allow you to set up or modify an action<br />
plan that responds to alerts generated by the current <strong>OneSight</strong><br />
Voice Transaction Profile monitor. You can also configure how an<br />
alert will affect the monitor group’s health. It can result in a<br />
Warning state, a Critical state, or can have no impact on health.<br />
Chapter 5: Configuring Monitors 205
Configuring <strong>OneSight</strong> Voice Transaction Profile Monitors<br />
Locations Tab – Specifies the Data Collector Location from which<br />
the monitor checks performance.<br />
Attributes Tab – Contains the options for specifying which attributes<br />
are applied to this monitor for Status page sorting.<br />
Down Time Tab – Contains the options for applying downtime to<br />
this monitor.<br />
Monitor Groups Tab – Contains the options that you can use to<br />
specify which monitor groups the monitor is used with. This tab is<br />
available when you open the Add Monitor window by selecting<br />
Monitors from the Configure menu. It is not available when you<br />
open the Add Monitor window from the Monitor Group Editor.<br />
Access Control Tab – Contains the options for specifying which user<br />
groups have read, write, and delete permissions for this monitor.<br />
Monitor Name – Each monitor that you create must have a unique<br />
name. In the Monitor Name box, <strong>OneSight</strong> creates a unique name<br />
for the current monitor by combining the name of the monitor type<br />
with the name of the host to which the monitor applies. To change<br />
the default assigned name, type a unique monitor name that helps<br />
you to identify what this monitor does.<br />
Profile – Lists the profiles that are available to apply to this monitor.<br />
Multiple profiles may be listed if you have upgraded from a<br />
previous version of <strong>OneSight</strong>.<br />
Modify – Displays the <strong>OneSight</strong> Profile Editor that lets you add and<br />
remove metrics, and configure alerts, smartlinks, and attributes for<br />
this profile.<br />
Note: When you modify alerts for <strong>OneSight</strong> Voice Transaction<br />
Profile monitors, you must select Override profile in the Alert Editor<br />
to make the fields available. Any changes that you make will apply<br />
to this monitor only, not to the profile itself.<br />
206 <strong>OneSight</strong> <strong>Administrator</strong> <strong>Guide</strong>
Configuring <strong>OneSight</strong> Voice Transaction Profile Monitors<br />
To create a <strong>OneSight</strong> Voice Transaction Profile monitor:<br />
1. On the Monitors Page, click Add to open the Add Monitor<br />
dialog box.<br />
2. The Monitor Types box lists all of the types of monitors that<br />
can be applied to your monitor group. Click <strong>OneSight</strong> Voice<br />
Transaction Profile to add a monitor that checks the availability<br />
and responsiveness of a selected monitor from the <strong>OneSight</strong><br />
Voice Transaction service. You will use settings on the General<br />
tab to configure a <strong>OneSight</strong> Voice Transaction Profile monitor.<br />
Script – Displays the script being used.<br />
Import – Displays the Import CallMaster script dialog box for<br />
selecting the script you want to use.<br />
Edit Steps – Displays the Script Steps dialog box for selecting<br />
the units to use to evaluate the script steps.<br />
Chapter 5: Configuring Monitors 207
Configuring <strong>OneSight</strong> Voice Transaction Profile Monitors<br />
Parameters – Displays the Input Parameter dialog box for<br />
entering an input parameter. For example, if you have a script<br />
that needs to place a call, you can enter one or more numbers in<br />
the input parameter list. This button is only available when the<br />
script requires input parameters.<br />
Voice Resource – Displays the Voice Resource Editor dialog<br />
box for specifying the CallMaster servers and channels to use<br />
as voice resources.<br />
Scenario Name – Specifies the name of the scenario.<br />
Retries – Specifies the number of times to retry the script if the<br />
script fails.<br />
Sample Every: – Specifies how often samples are<br />
taken for this monitor. Refer to, ―Sample Every Settings,‖ later<br />
in this chapter for a description of these settings.<br />
Sample as soon as possible – When you are using the x@y<br />
format, causes the monitor to sample as soon as it can. For<br />
example, if you specified 40@5 and the monitor was started at<br />
12:10, the first sample would normally be at 1:05. If this<br />
checkbox is selected, the first sample will be at 12:45.<br />
3. Each monitor that you add must have a unique name. You can<br />
let <strong>OneSight</strong> create a unique name using the <strong>OneSight</strong> Voice<br />
Transaction specifications you supply, or you can type in your<br />
own name for the monitor.<br />
208 <strong>OneSight</strong> <strong>Administrator</strong> <strong>Guide</strong>
Configuring <strong>OneSight</strong> Voice Transaction Profile Monitors<br />
4. Click the Import button to display the Import CallMaster script<br />
dialog box.<br />
Script – Enter the script path or click Browse. CallMaster<br />
scripts are SBX format files.<br />
Browse – Displays the Choose File dialog box for selecting a<br />
script.<br />
5. Select the script and click OK.<br />
This dialog box lets you select the script steps you want to test<br />
and select the units to use to evaluate the script steps.<br />
Check All – Selects all of the script steps.<br />
Uncheck All – Deselects all of the script steps.<br />
– Click the check box in front of the steps that you<br />
want to test.<br />
– Select the units to use to evaluate the steps.<br />
Chapter 5: Configuring Monitors 209
Configuring <strong>OneSight</strong> Voice Transaction Profile Monitors<br />
6. Select the steps that you want to test and click OK.<br />
7. If the script requires input parameters, the number of<br />
parameters required is shown in the Parameters field. Click<br />
Input Parameter to display the Input Parameter Editor.<br />
This dialog box lets you configure parameters particular to this<br />
script. The columns displayed are based on the script’s<br />
requirements.<br />
Add – Displays the Input Parameter Editor for entering<br />
parameters that pertain to this script.<br />
Modify – Displays the Input Parameter Editor for modifying the<br />
selected parameter set.<br />
Remove – Deletes the selected parameter set.<br />
Add from CSV file – Displays the Upload Input Parameter dialog<br />
box for adding parameters from a Comma Separated Value file.<br />
The file must be set up so that the first line of the file contains<br />
the column names, the second line contains the type of data,<br />
and the third line contains the default values. The input<br />
parameter data should start on the fourth line and each line<br />
should only contain one set of input parameter data. Data<br />
should be surrounded by double quotes.<br />
Parameters – Displays the configured parameters.<br />
210 <strong>OneSight</strong> <strong>Administrator</strong> <strong>Guide</strong>
Configuring <strong>OneSight</strong> Voice Transaction Profile Monitors<br />
8. The Input Parameter Editor shows the input parameters that it<br />
needs. In the example above, the script needs a phone number<br />
and digit. Click Add to add a parameter.<br />
Or click Add from CSV file to upload the parameters from a<br />
Comma Separated Value file. The file must be set up so that the<br />
first line of the file contains the column names, the second line<br />
contains the type of data, and the third line contains the default<br />
values. The input parameter data should start on the fourth line<br />
and each line should only contain one set of input parameter<br />
data. Data should be surrounded by double quotes.<br />
9. Enter the parameters or select the file and click OK.<br />
10. You can add multiple parameter sets. When you are finished<br />
adding parameters, click OK.<br />
Chapter 5: Configuring Monitors 211
Configuring <strong>OneSight</strong> Voice Transaction Profile Monitors<br />
11. Click Voice Resource to display the Voice Resource Editor for<br />
selecting servers and channels to use as voice resources.<br />
Add – Displays the CallMaster System Editor for adding a<br />
CallMaster server and for configuring voice groups for the<br />
server.<br />
Modify – Displays the Edit CallMaster System dialog box for<br />
editing the selected system.<br />
Remove – Deletes the selected system.<br />
CallMaster Server Name – Displays the configured CallMaster<br />
system names.<br />
Port – Displays the CallMaster system port being used.<br />
Available Voice Group – Displays the voice groups that are<br />
available for the selected system.<br />
Selected Voice Group – Displays the voice groups selected for<br />
testing.<br />
212 <strong>OneSight</strong> <strong>Administrator</strong> <strong>Guide</strong>
Configuring <strong>OneSight</strong> Voice Transaction Profile Monitors<br />
12. Click Add.<br />
CallMaster Server Name – Enter the CallMaster server name.<br />
Port – Enter the port to use.<br />
About CallMaster – Displays the minimum required CallMaster<br />
version and the current version and build numbers.<br />
Add – Displays the Voice Resource Editor for configuring a voice<br />
group.<br />
Modify – Displays the Voice Resource Editor for modifying the<br />
selected voice group.<br />
Remove – Deletes the selected voice group.<br />
13. Enter the CallMaster server name and its port that you want to<br />
use.<br />
Chapter 5: Configuring Monitors 213
Configuring <strong>OneSight</strong> Voice Transaction Profile Monitors<br />
14. Click Add to add a voice group or click OK to return to the<br />
Voice Resource Editor. If you click Add the following dialog<br />
box is displayed.<br />
This dialog box lets you configure voice groups.<br />
Voice Group – Enter the name of the voice group.<br />
Channels – Select the channels that you want to include in the<br />
voice group.<br />
15. Select the channels you want to use and click OK.<br />
16. In the Voice Resource Editor select the system and voice<br />
groups that you want to use and click OK.<br />
17. To verify that the monitor will work as configured, click the<br />
Test button. The Monitor Test window provides information<br />
214 <strong>OneSight</strong> <strong>Administrator</strong> <strong>Guide</strong>
Configuring JMX Monitors<br />
about the success or failure of the test and indicates what may<br />
be causing any problem.<br />
18. If the test succeeds, click OK in the Add Monitor dialog box to<br />
save these basic <strong>OneSight</strong> Voice Transaction Profile monitor<br />
settings. You can now add this monitor to a monitor group.<br />
Refer to Adding Monitors to a Monitor Group in Chapter 4.<br />
Configuring JMX Monitors<br />
The JMX monitor lets you determine if a Java application is<br />
performing properly. The JMX monitor checks the specified JMX<br />
MBean Attribute values at specified time intervals to confirm that<br />
the Java application is performing as expected. The JMX monitor<br />
also provides an easy way to confirm whether or not the JMX<br />
application is running.<br />
The JMX monitor connects to the remote JMX application’s MBean<br />
Server using Java RMI protocol for Weblogic and JBoss and SOAP<br />
for WebSphere. Once connected to the MBean Server, the JMX<br />
monitor can get an MBean’s Attribute’s current value. The JMX<br />
monitor configuration can also discover all available MBeans that<br />
the MBean Server knows about, making it easy to select the name<br />
of the MBean and its attribute of interest.<br />
For the JMX monitor to be able to connect to an MBean Server, the<br />
JMX-enabled application’s jar file must be copied to the monitoring<br />
(Data Collector) machine in a default directory location as specified<br />
in the table below. The jar file on the Data Collector machine must<br />
be the same version (that is, an exact copy) of the jar file that the<br />
JMX application is using, otherwise, the JMX monitor will not be<br />
able to connect to that MBean Server.<br />
The JMX monitor can concurrently connect to any number of<br />
MBean Servers and versions with some exceptions as described in<br />
―Installing the Data Collector on a Windows Machine,‖ in<br />
Chapter2. During the data collector installation process, you must<br />
have selected the application server(s) that you are using. If the<br />
Chapter 5: Configuring Monitors 215
Configuring JMX Monitors<br />
Application<br />
Server<br />
BEA<br />
Weblogic<br />
8 Serials<br />
JMX Proxy for the application server you are using has not been<br />
installed, you will not be able to connect. Refer to “Using the JMX<br />
Proxy,” in Chapter 2 for information on installing and configuring<br />
the JMX Proxy.<br />
The following table lists the supported JMX applications, the jar<br />
files, and the default directory location that the files must be copied<br />
to.<br />
Application<br />
Name Jar Files Default Directory<br />
weblogic81<br />
weblogic.jar<br />
webservices.jar<br />
C:\Empirix\DataCollector\<br />
JMXProxy\Proxy14\class<br />
es\weblogic8.1 and<br />
C:\Empirix\Datacollector\<br />
JMXProxy\Proxy14\lib<br />
BEA<br />
Weblogic<br />
9 Serials<br />
weblogic90<br />
weblogic.jar<br />
webservices.jar<br />
C:\Empirix\DataCollector\<br />
JMXProxy\Proxy15\class<br />
es\weblogic9.0<br />
BEA<br />
Weblogic<br />
10 Serials<br />
weblogic<br />
100<br />
wlclient.jar, wljmxclient.jar<br />
C:\Empirix\DataCollector\<br />
JMXProxy\Proxy15\class<br />
es\weblogic10.0<br />
IBM<br />
WebSpher<br />
e 6.0<br />
websphere6<br />
0<br />
admin.jar, bootstrap.jar,<br />
classloader.jar, emf.jar,<br />
ffdc.jar,<br />
ibmcertpathprovider.jar,<br />
ibmjceprovider.jar, j2ee.jar,<br />
mail-impl.jar,<br />
management.jar, ras.jar,<br />
runtimefw.jar, sas.jar,<br />
security.jar, soap.jar,<br />
utils.jar, wasjmx.jar,<br />
wasproduct.jar,<br />
wsexception.jar, wssec.jar,<br />
runtime.jar, idl.jar,<br />
iwsorb.jar<br />
C:\Empirix\DataCollector\<br />
JMXProxy\Proxy15\class<br />
es\websphere6.0<br />
216 <strong>OneSight</strong> <strong>Administrator</strong> <strong>Guide</strong>
Configuring JMX Monitors<br />
IBM<br />
WebSpher<br />
e 6.1<br />
websphere6<br />
1<br />
ws_runtime.jar<br />
C:\Empirix\DataCollector\<br />
JMXProxy\Proxy15\class<br />
es\websphere6.1 and<br />
C:\Empirix\DataCollector\<br />
JMXProxy\Proxy15\lib<br />
IBM<br />
WebSpher<br />
e 7.0<br />
websphere7<br />
0<br />
com.ibm.we.admin.client_7<br />
.0.0.jar<br />
C:\Empirix\DataCollector\<br />
JMXProxy16\lib<br />
JBoss 3.2 jboss32 jbossall-client.jar C:\Empirix\DataCollector\<br />
JMXProxy\Proxy15\class<br />
es\jboss3.2<br />
JBoss 4<br />
Serials<br />
JBoss 5<br />
Serials<br />
jboss40 jbossall-client.jar C:\Empirix\DataCollector\<br />
JMXProxy\Proxy15\class<br />
es\jboss4.0<br />
jboss50 jbossall-client.jar C:\Empirix\DataCollector\<br />
JMXProxy\Proxy15\class<br />
es\jboss5.0<br />
Tomcat 5+ Tomcat Not required Not required<br />
Additional Notes<br />
WebSphere 7.0 – Set the following line to false in the<br />
service.properties file:<br />
Agents.JMX.WLUseReflection = false<br />
WebLogic 8.1 –Change the following lines in the<br />
Proxy14\properties\service.properties file:<br />
PROXY.SupportedJMXServers = weblogic81<br />
Agents.JMX.WLUseReflection = false<br />
WebLogic 9.x – Change the following line in the<br />
Proxy15\properties\service.properties file:<br />
Chapter 5: Configuring Monitors 217
Configuring JMX Monitors<br />
PROXY.SupportedJMXServers = weblogic90 //No weblogic 100<br />
WebLogic 10.x – Change the following line in the<br />
Proxy15\properties\service.properties file:<br />
PROXY.SupportedJMXServers = weblogic100 //No Weblogic 90<br />
WebSphere 6.0 – Uncomment the following line in the<br />
Proxy15\properties\proxy_win_service.properties file:<br />
# JMXProxy.commandline =<br />
-<br />
Xbootclasspath/p:\..\classes\websphere6.0\mana<br />
gement.jar<br />
Set the following line in the Proxy15\properties\service.properties file<br />
to disable support to other Application Servers on this JMX Proxy:<br />
PROXY.SupportedJMXServers = websphere60<br />
JBoss 3.x – Change the following line in the<br />
Proxy15\properties\service.properties file:<br />
PROXY.SupportedJMXServers = jboss32<br />
JBoss 4.x – Change the following line in the<br />
Proxy15\properties\service.properties file:<br />
PROXY.SupportedJMXServers = Jboss40<br />
JBoss 5.x – Change the following line in the<br />
Proxy15\properties\service.properties file:<br />
PROXY.SupportedJMXServers = jboss50<br />
Tomcat – By default, Tomcat does not support JMX. Refer to<br />
\support\JMXProxy\Tomcat.doc for more details.<br />
Change the following line in the<br />
\properties\service.properties file:<br />
218 <strong>OneSight</strong> <strong>Administrator</strong> <strong>Guide</strong>
Configuring JMX Monitors<br />
PROXY.SupportedJMXServers = tomcat<br />
In the Add Monitor dialog box, when you click JMX in the Monitor<br />
Types box, settings to configure a JMX monitor appear on these<br />
dialog box tabs:<br />
General Tab – Contains the options that you can use to create a JMX<br />
monitor for your call center.<br />
Advanced Tab – Contains the options that you can use to configure<br />
authentication information if the web application server requires it.<br />
Alerts Tab – Shows what action plan will be used when an alert<br />
occurs. Options on this tab allow you to set up or modify an action<br />
plan that responds to alerts generated by the current JMX monitor.<br />
You can also configure how an alert will affect the monitor group’s<br />
health. It can result in a Warning state, a Critical state, or can have<br />
no impact on health.<br />
Locations Tab – Specifies the Data Collector Location from which<br />
the monitor checks performance.<br />
SmartLinks Tab – Contains the options for specifying a link to<br />
associate with a particular monitor or metric.<br />
Attributes Tab – Contains the options for specifying which attributes<br />
are applied to this monitor for Status page sorting.<br />
Monitor Groups Tab – Contains the options that you can use to<br />
specify which monitor groups the monitor is used with. This tab is<br />
available when you open the Add Monitor window by selecting<br />
Monitors from the Configure menu. It is not available when you<br />
open the Add Monitor window from the Monitor Group Editor.<br />
Access Control Tab – Contains the options for specifying which user<br />
groups have read, write, and delete permissions for this monitor.<br />
Down Time Tab – Contains the options for applying downtime to<br />
this monitor.<br />
Chapter 5: Configuring Monitors 219
Configuring JMX Monitors<br />
To create a JMX monitor:<br />
1. On the Monitors Page, click Add to open the Add Monitor<br />
dialog box.<br />
2. The Monitor Types box lists all of the types of monitors that<br />
can be applied to your monitor group. Click JMX to add a<br />
monitor that checks the availability and responsiveness of a<br />
selected monitor from the JMX service. You will use settings on<br />
the General tab to configure a JMX monitor.<br />
Import/Export – Click this button to display the Import Export<br />
Monitors dialog box for importing or exporting monitors of this<br />
type. Refer to ―Exporting and Importing Monitors,‖ later in this<br />
chapter for more information.<br />
JMX App name – The name of the JMX application. Valid<br />
entries are those listed or a user-created name in the Data<br />
Collector’s OSDC.properties file.<br />
220 <strong>OneSight</strong> <strong>Administrator</strong> <strong>Guide</strong>
Configuring JMX Monitors<br />
Host Name – The name of the JMX application’s JNDI server.<br />
Port – The port number of the JMX application’s JNDI server.<br />
MBean Name – The fully qualified MBean name. This is<br />
automatically filled in if you select an MBean attribute from the<br />
Discover MBeans result tree.<br />
Attribute Name – The Mbean’s attribute name or select it from<br />
the Discover MBeans result tree.<br />
Attribute Property – The attribute property or select it from the<br />
Discover MBeans result tree.<br />
Operation Name – Specifies the operation that will be called.<br />
The result from the operation is the sample metric.<br />
Operation Param – Specifies the parameters for invoking the<br />
operation. Only simple types are supported. For example, int,<br />
float, string, etc.<br />
Description – This is automatically filled in if you select an<br />
MBean name and attribute from the Discover MBeans result<br />
tree.<br />
Sample Every: – Specifies how often samples are<br />
taken for this monitor. Refer to, ―Sample Every Settings,‖ later<br />
in this chapter for a description of these settings.<br />
Discover MBeans – Discovers the MBean names and their<br />
attributes from the JMX application’s MBean Server. The<br />
results are displayed below the button. Selecting a node<br />
automatically fills in the MBean Name, Attribute Name, and<br />
Description fields.<br />
of type – Select the type of MBeans to discover or select All<br />
MBeans to discover all types of MBeans.<br />
Contains – Enter text to filter the list.<br />
Chapter 5: Configuring Monitors 221
Configuring JMX Monitors<br />
Test – When you add or modify a monitor, you can test General<br />
settings to determine if they are set appropriately. After clicking<br />
the Test button, you will see messages in the status window as<br />
the test runs and when the test completes.<br />
3. Each monitor that you add must have a unique name. You can<br />
let <strong>OneSight</strong> create a unique name using the JMX specifications<br />
you supply, or you can type in your own name for the monitor.<br />
4. On the General tab, enter the Host Name and Port number of<br />
the JNDI server.<br />
5. If required for accessing the JNDI server, enter the username<br />
and password.<br />
6. Click Discover MBeans to find all of the MBeans and their<br />
attributes.<br />
7. Select an MBean from the result tree to automatically fill in the<br />
MBean Name, Attribute Name, and Description fields.<br />
8. To verify that the monitor will work as configured, click the<br />
Test button. The Monitor Test window provides information<br />
about the success or failure of the test and indicates what may<br />
be causing any problem.<br />
9. If the test succeeds, click OK in the Add Monitor dialog box to<br />
save these basic JMX monitor settings. You can now add this<br />
monitor to a monitor group. Refer to Adding Monitors to a<br />
Monitor Group in Chapter 4.<br />
222 <strong>OneSight</strong> <strong>Administrator</strong> <strong>Guide</strong>
Configuring JMX Monitors<br />
Configuring Advanced Settings<br />
Use the Advanced tab to specify the following settings.<br />
Scale – Type the multiplier you want applied to the data that’s<br />
collected.<br />
Setting Scale to 1 means the data will be reported as it is. If the<br />
metric measurement is expressed in kilobytes, setting Scale to 1024<br />
will translate it to bytes. If the metric measurement is expressed in<br />
milliseconds, setting Scale to .001 will translate it to seconds.<br />
String Mappings – <strong>OneSight</strong> collects numeric performance data. If<br />
you are measuring an object representing a String datatype, it can<br />
be converted to a number for use in <strong>OneSight</strong> by using the String<br />
Mappings field. Simply specify a semicolon delimited mapping of<br />
Chapter 5: Configuring Monitors 223
Configuring JMX Monitors<br />
Strings to Integers. For example, ―false=0;true=1‖; will convert a<br />
―false‖ reading to a 0 value in <strong>OneSight</strong>, and this will be displayed<br />
in <strong>OneSight</strong> Status as ―false=0‖. If you only want to display the<br />
string on the <strong>OneSight</strong> status page, use a colon, rather than a semicolon<br />
to delimit the values.<br />
If you neglect to provide a mapping for a specific string, <strong>OneSight</strong><br />
will consider this a Sample Failure, and report the String that was<br />
returned. String Mappings can also be used to translate a number to<br />
a String for display in <strong>OneSight</strong> Status. This is helpful when<br />
numbers represent an objects state.<br />
Note that string matching is case-insensitive and data that has a<br />
colon cannot be used in string mapping.<br />
Translation Type – Select No Translation if the value requires no<br />
further modification. The Rate translation type means that the value<br />
should be calculated as frequency per minute.<br />
Unit Measure – To define a Unit Measure, click the arrow to select a<br />
unit measure (%, bytes, hours, minutes, seconds). You can also type<br />
in a unit measure such as messages/minute. This measure is a<br />
display string. It does not perform any data translation.<br />
MBean Server Requires Authentication – Select this checkbox to<br />
enter authentication information:<br />
Username – The username for accessing the JNDI server.<br />
Password – The password for accessing the JNDI server.<br />
In addition to the above fields, the following fields are required for<br />
WebSphere to identify the digital certificate. The WebSphere<br />
iKeyman utility (normally located in the Program<br />
Files\IBM\WebSphere\AppServer\bin\ directory) can be used to generate<br />
the certificate.<br />
224 <strong>OneSight</strong> <strong>Administrator</strong> <strong>Guide</strong>
Configuring <strong>OneSight</strong> Voice Watch Monitors<br />
Trust Store File – Enter the client-side trust store path and file<br />
name. This file should be in the datacollector directory.<br />
Trust Store Password – Enter the trust store file password.<br />
Key Store File – Enter the client-side key store path and file name.<br />
This file should be in the datacollector directory.<br />
Key Store Password – Enter the key store file password.<br />
If you are using a .p12 key file, you will need to save it as a .jks file.<br />
Do this by opening the file in the ikeyman utility (normally located<br />
in the Program Files\IBM\WebSphere\AppServer\bin\ directory) and<br />
saving it as a .jks file. Use this file name in the Trust Store File and<br />
Key Store File fields.<br />
Configuring <strong>OneSight</strong> Voice Watch Monitors<br />
<strong>OneSight</strong> Voice Watch is Empirix’s hosted service that lets you<br />
monitor your call center in real time, using objective performance<br />
data gathered from points around the country. The service lets you<br />
monitor your call center performance from outside of your firewall.<br />
If you have a <strong>OneSight</strong> Voice Watch account, you can create a<br />
<strong>OneSight</strong> Voice Watch monitor to provide external measurements<br />
of your telephony-based voice transaction systems and then<br />
correlate these measurements with the performance of internal<br />
systems. (See www.empirix.com for more information about the<br />
<strong>OneSight</strong> Voice Watch service.)<br />
The <strong>OneSight</strong> Voice Watch Monitor retrieves data for the monitors<br />
you have configured within your <strong>OneSight</strong> Voice Watch service<br />
account.<br />
In the Add Monitor dialog box, when you click <strong>OneSight</strong> Voice<br />
Watch in the Monitor Types box, settings to configure a <strong>OneSight</strong><br />
Voice Watch monitor appear on these dialog box tabs:<br />
Chapter 5: Configuring Monitors 225
Configuring <strong>OneSight</strong> Voice Watch Monitors<br />
General Tab – Contains the options that you can use to create a<br />
<strong>OneSight</strong> Voice Watch monitor for your call center.<br />
Proxy Tab – Contains the options that you can use to configure a<br />
Proxy Server to use with a <strong>OneSight</strong> Voice Watch monitor for your<br />
call center.<br />
Alerts Tab – Shows what action plan will be used when an alert<br />
occurs. Options on this tab allow you to set up or modify an action<br />
plan that responds to alerts generated by the current <strong>OneSight</strong><br />
Voice Watch monitor. You can also configure how an alert will<br />
affect the monitor group’s health. It can result in a Warning state, a<br />
Critical state, or can have no impact on health.<br />
Locations Tab – Specifies the Data Collector Location from which<br />
the monitor checks performance.<br />
SmartLinks Tab – Contains the options for specifying a link to<br />
associate with a particular monitor or metric.<br />
Attributes Tab – Contains the options for specifying which attributes<br />
are applied to this monitor for Status page sorting.<br />
Down Time Tab – Contains the options for applying downtime to<br />
this monitor.<br />
Monitor Groups Tab – Contains the options that you can use to<br />
specify which monitor groups the monitor is used with. This tab is<br />
available when you open the Add Monitor window by selecting<br />
Monitors from the Configure menu. It is not available when you<br />
open the Add Monitor window from the Monitor Group Editor.<br />
Access Control Tab – Contains the options for specifying which user<br />
groups have read, write, and delete permissions for this monitor.<br />
Each monitor that you create must have a unique name. In the<br />
Monitor Name box, <strong>OneSight</strong> creates a unique name for the current<br />
monitor by combining the name of the monitor type with the name<br />
226 <strong>OneSight</strong> <strong>Administrator</strong> <strong>Guide</strong>
Configuring <strong>OneSight</strong> Voice Watch Monitors<br />
of the host to which the monitor applies. To change the default<br />
assigned name, type a unique monitor name that helps you to<br />
identify what this monitor does.<br />
To create a <strong>OneSight</strong> Voice Watch monitor:<br />
1. On the Monitors Page, click Add to open the Add Monitor<br />
dialog box.<br />
2. The Monitor Types box lists all of the types of monitors that<br />
can be applied to your monitor group. Click <strong>OneSight</strong> Voice<br />
Watch to add a monitor that checks the availability and<br />
responsiveness of a selected monitor from the <strong>OneSight</strong> Voice<br />
Watch service.<br />
You will use settings on the General tab to configure a<br />
<strong>OneSight</strong> Voice Watch monitor.<br />
Chapter 5: Configuring Monitors 227
Configuring <strong>OneSight</strong> Voice Watch Monitors<br />
User ID – Type the User ID of your <strong>OneSight</strong> Voice Watch<br />
service account.<br />
Password – Type the password of your <strong>OneSight</strong> Voice Watch<br />
service account.<br />
Server – Enter the name or IP address of the <strong>OneSight</strong> Voice<br />
Watch server.<br />
Get Voice Watch Monitors – After you provide the account<br />
information (User ID, Password), click Get Voice Watch<br />
Monitors to retrieve the active monitors configured in your<br />
<strong>OneSight</strong> Voice Watch service account. If you have previously<br />
specified this account information, these monitors will be<br />
retrieved automatically.<br />
Monitors – After you click Get Voice Watch Monitors, the active<br />
monitors configured in your <strong>OneSight</strong> Voice Watch service<br />
account will be displayed in this list box.<br />
Measurement – The steps available for the monitor are listed.<br />
Sample Every: – Specifies how often samples are<br />
taken for this monitor. Refer to, ―Sample Every Settings,‖ later<br />
in this chapter for a description of these settings.<br />
Test – When you add or modify a monitor, you can test settings<br />
to determine if they are set appropriately. After clicking the<br />
Test button, you will see messages in the status window as the<br />
test runs and when the test completes.<br />
3. Each monitor that you add must have a unique name. You can<br />
let <strong>OneSight</strong> create a unique name using the <strong>OneSight</strong> Voice<br />
Watch specifications you supply, or you can type in your own<br />
name for the monitor.<br />
4. On the General tab in the User ID box, type the name of your<br />
<strong>OneSight</strong> Voice Watch User ID.<br />
228 <strong>OneSight</strong> <strong>Administrator</strong> <strong>Guide</strong>
Configuring <strong>OneSight</strong> Voice Watch Monitors<br />
5. On the General tab in the Password box, type your <strong>OneSight</strong><br />
Voice Watch password.<br />
6. Click Get Voice Watch Monitors. Using the login information<br />
you have specified, the active monitors configured in your<br />
<strong>OneSight</strong> Voice Watch service account are identified and listed<br />
here. If you have previously specified this account information,<br />
these monitors will be retrieved automatically.<br />
7. Select the monitor to use.<br />
8. To verify that the monitor will work as configured, click the<br />
Test button. The Monitor Test window provides information<br />
about the success or failure of the test and indicates what may<br />
be causing any problem.<br />
9. If the test succeeds, click OK in the Add Monitor dialog box to<br />
save these basic <strong>OneSight</strong> Voice Watch monitor settings. You<br />
can now add this monitor to a monitor group. Refer to Adding<br />
Monitors to a Monitor Group in Chapter 4.<br />
Chapter 5: Configuring Monitors 229
Configuring <strong>OneSight</strong> Voice Watch Monitors<br />
Specifying Proxy Server Settings<br />
Use the Proxy tab to specify the proxy server settings.<br />
Proxy tab settings – Use the options on this tab to specify which<br />
elements should be used when checking page links, how you want<br />
to handle cookies, user agent options, and authentication settings.<br />
Proxy Server Settings – If your network makes use of a proxy server,<br />
you can specify this information here. Check Use a proxy server and<br />
add the information below.<br />
If you find that a <strong>OneSight</strong> Voice Watch monitor fails to reach a<br />
URL when your browser successfully connects to the same URL,<br />
check your proxy server settings in your browser. For example, in<br />
Internet Explorer, select Internet Options from the Tools menu and<br />
230 <strong>OneSight</strong> <strong>Administrator</strong> <strong>Guide</strong>
Configuring <strong>OneSight</strong> Voice Watch Profile Monitors<br />
then click LAN settings on the Connections tab. If proxy server<br />
settings are configured for your browser, they may also need to be<br />
configured for the <strong>OneSight</strong> Voice Watch monitor.<br />
Proxy Host – The IP address of the proxy server.<br />
Port – The port of the proxy server.<br />
Proxy User Name – The username for the proxy server.<br />
Password – The password for the proxy server.<br />
Configuring <strong>OneSight</strong> Voice Watch Profile<br />
Monitors<br />
<strong>OneSight</strong> Voice Watch is Empirix’s hosted service that lets you<br />
monitor your call center in real time, using objective performance<br />
data gathered from points around the country. The service lets you<br />
monitor your call center performance from outside of your firewall.<br />
If you have a <strong>OneSight</strong> Voice Watch account, you can create a<br />
<strong>OneSight</strong> Voice Watch Profile monitor to provide external<br />
measurements of your telephony-based voice transaction systems<br />
and then correlate these measurements with the performance of<br />
internal systems. (See www.empirix.com for more information about<br />
the <strong>OneSight</strong> Voice Watch service.)<br />
The <strong>OneSight</strong> Voice Watch Profile monitor tests all of the steps in<br />
the script. Use the <strong>OneSight</strong> Voice Watch dedicated monitor if you<br />
are testing only one step in the script.<br />
The <strong>OneSight</strong> Voice Watch Profile Monitor retrieves data for the<br />
monitors you have configured within your <strong>OneSight</strong> Voice Watch<br />
service account.<br />
In the Add Monitor dialog box, when you click <strong>OneSight</strong> Voice<br />
Watch Profile in the Monitor Types box, settings to configure a<br />
Chapter 5: Configuring Monitors 231
Configuring <strong>OneSight</strong> Voice Watch Profile Monitors<br />
<strong>OneSight</strong> Voice Watch Profile monitor appear on these dialog box<br />
tabs:<br />
General Tab – Contains the options that you can use to create a<br />
<strong>OneSight</strong> Voice Watch Profile monitor for your call center.<br />
Proxy Tab – Contains the options that you can use to configure a<br />
Proxy Server to use with a <strong>OneSight</strong> Voice Watch Profile monitor<br />
for your call center.<br />
Alerts Tab – Shows what action plan will be used when an alert<br />
occurs. Options on this tab allow you to set up or modify an action<br />
plan that responds to alerts generated by the current <strong>OneSight</strong><br />
Voice Watch Profile monitor. You can also configure how an alert<br />
will affect the monitor group’s health. It can result in a Warning<br />
state, a Critical state, or can have no impact on health.<br />
Locations Tab – Specifies the Data Collector Location from which<br />
the monitor checks performance.<br />
Attributes Tab – Contains the options for specifying which attributes<br />
are applied to this monitor for Status page sorting.<br />
Monitor Groups Tab – Contains the options that you can use to<br />
specify which monitor groups the monitor is used with. This tab is<br />
available when you open the Add Monitor window by selecting<br />
Monitors from the Configure menu. It is not available when you<br />
open the Add Monitor window from the Monitor Group Editor.<br />
Access Control Tab – Contains the options for specifying which user<br />
groups have read, write, and delete permissions for this monitor.<br />
Down Time Tab – Contains the options for applying downtime to<br />
this monitor.<br />
Monitor Name – Each monitor that you create must have a unique<br />
name. In the Monitor Name box, <strong>OneSight</strong> creates a unique name<br />
for the current monitor by combining the name of the monitor type<br />
232 <strong>OneSight</strong> <strong>Administrator</strong> <strong>Guide</strong>
Configuring <strong>OneSight</strong> Voice Watch Profile Monitors<br />
with the name of the host to which the monitor applies. To change<br />
the default assigned name, type a unique monitor name that helps<br />
you to identify what this monitor does.<br />
Profile – Lists the profiles that are available to apply to this monitor.<br />
Multiple profiles may be listed if you have upgraded from a<br />
previous version of <strong>OneSight</strong>.<br />
Modify – Displays the <strong>OneSight</strong> Profile Editor that lets you add and<br />
remove metrics, and configure alerts, smartlinks, and attributes for<br />
this profile.<br />
Note: When you modify alerts for <strong>OneSight</strong> Voice Watch Profile<br />
monitors, you must select Override profile in the Alert Editor to make<br />
the fields available. Any changes that you make will apply to this<br />
monitor only, not to the profile itself.<br />
To create a <strong>OneSight</strong> Voice Watch profile monitor:<br />
1. On the Monitors Page, click Add to open the Add Monitor<br />
dialog box.<br />
2. The Monitor Types box lists all of the types of monitors that<br />
can be applied to your monitor group. Click <strong>OneSight</strong> Voice<br />
Watch Profile to add a monitor that checks the availability and<br />
responsiveness of a selected monitor from the <strong>OneSight</strong> Voice<br />
Watch service.<br />
Chapter 5: Configuring Monitors 233
Configuring <strong>OneSight</strong> Voice Watch Profile Monitors<br />
You will use settings on the General tab to configure a<br />
<strong>OneSight</strong> Voice Watch Profile monitor.<br />
User ID – Type the User ID of your <strong>OneSight</strong> Voice Watch<br />
service account.<br />
Password – Type the password of your <strong>OneSight</strong> Voice Watch<br />
service account.<br />
Server – Enter the name or IP address of the <strong>OneSight</strong> Voice<br />
Watch server.<br />
Sample Every: – Specifies how often samples are<br />
taken for this monitor. Refer to, ―Sample Every Settings,‖ later<br />
in this chapter for a description of these settings.<br />
Get Voice Watch Monitor – After you provide the account<br />
information (User ID, Password), click Get Voice Watch Monitor<br />
234 <strong>OneSight</strong> <strong>Administrator</strong> <strong>Guide</strong>
Configuring <strong>OneSight</strong> Voice Watch Profile Monitors<br />
to retrieve the active monitors configured in your <strong>OneSight</strong><br />
Voice Watch service account. If you have previously specified<br />
this account information, these monitors will be retrieved<br />
automatically. These monitors are displayed in the Select<br />
<strong>OneSight</strong> Voice Watch Monitor dialog box for selecting a<br />
monitor.<br />
Edit Steps – Displays the Script Steps dialog box for selecting<br />
the units to use to evaluate the script steps.<br />
Info – After you select a monitor, you can use this button to<br />
display the Selected <strong>OneSight</strong> Voice Watch Monitor<br />
Information dialog box. This dialog lists the monitor name and<br />
all of the steps in the script.<br />
3. Each monitor that you add must have a unique name. You can<br />
let <strong>OneSight</strong> create a unique name using the <strong>OneSight</strong> Voice<br />
Watch Profile specifications you supply, or you can type in<br />
your own name for the monitor.<br />
4. On the General tab in the User ID box, type the name of your<br />
<strong>OneSight</strong> Voice Watch User ID.<br />
5. On the General tab in the Password box, type your <strong>OneSight</strong><br />
Voice Watch password.<br />
6. Enter the name of IP address of the <strong>OneSight</strong> Voice Watch<br />
server.<br />
7. Click Get Voice Watch Monitor. Using the login information you<br />
have specified, the active monitors configured in your <strong>OneSight</strong><br />
Voice Watch service account are identified and listed in the<br />
Select Voice Watch Monitor dialog box. If you have previously<br />
specified this account information, these monitors will be<br />
retrieved automatically.<br />
Chapter 5: Configuring Monitors 235
Configuring <strong>OneSight</strong> Voice Watch Profile Monitors<br />
8. Select the monitor you want to use and click OK. The Script<br />
Steps dialog box is displayed.<br />
9. For each step, select the units you want <strong>OneSight</strong> to use to<br />
evaluate the script and click OK.<br />
10. To verify that the monitor will work as configured, click the<br />
Test button. The Monitor Test window provides information<br />
about the success or failure of the test and indicates what may<br />
be causing any problem.<br />
11. If the test succeeds, click OK in the Add Monitor dialog box to<br />
save these basic <strong>OneSight</strong> Voice Watch Profile monitor<br />
settings. You can now add this monitor to a monitor group.<br />
Refer to Adding Monitors to a Monitor Group in Chapter 4.<br />
236 <strong>OneSight</strong> <strong>Administrator</strong> <strong>Guide</strong>
Configuring <strong>OneSight</strong> Voice Watch Profile Monitors<br />
Specifying Proxy Server Settings<br />
Use the Proxy tab to specify the proxy server settings.<br />
Proxy tab settings – Use the options on this tab to specify which<br />
elements should be used when checking page links, how you want<br />
to handle cookies, user agent options, and authentication settings.<br />
Proxy Server Settings – If your network makes use of a proxy server,<br />
you can specify this information here. Check Use a proxy server and<br />
add the information below.<br />
If you find that a <strong>OneSight</strong> Voice Watch monitor fails to reach a<br />
URL when your browser successfully connects to the same URL,<br />
check your proxy server settings in your browser. For example, in<br />
Internet Explorer, select Internet Options from the Tools menu and<br />
Chapter 5: Configuring Monitors 237
Configuring Event Log Monitors<br />
then click LAN settings on the Connections tab. If proxy server<br />
settings are configured for your browser, they may also need to be<br />
configured for the <strong>OneSight</strong> Voice Watch monitor.<br />
Proxy Host – The IP address of the proxy server.<br />
Port – The port of the proxy server.<br />
Proxy User Name – The username for the proxy server.<br />
Password – The password for the proxy server.<br />
Configuring Event Log Monitors<br />
You can set up an Event Log monitor to determine if the event log<br />
associated with a monitor group component, such as a web server,<br />
has information in the log that indicates a problem with your<br />
monitor group.<br />
At specified time intervals, the Event Log monitor checks the event<br />
log.<br />
In the Add Monitor dialog box, when you click Event Log in the<br />
Monitor Types box, settings to configure an Event Log monitor<br />
appear on these dialog box tabs:<br />
General Tab – Contains the options that you can use to create an<br />
Event Log monitor for your monitor group.<br />
Metric Tab – Contains the options for specifying the type of metric.<br />
Alerts Tab – Displays the options that you can use to define alerts<br />
and associate them with action plans. You can also configure how<br />
an Event Log alert will affect the monitor group’s health. It can<br />
result in a Warning state, a Critical state, or can have no impact on<br />
health.<br />
238 <strong>OneSight</strong> <strong>Administrator</strong> <strong>Guide</strong>
Configuring Event Log Monitors<br />
Locations Tab – Specifies the Data Collector Location from which<br />
the monitor checks performance.<br />
SmartLinks Tab – Contains the options for specifying a link to<br />
associate with a particular monitor or metric.<br />
Attributes Tab – Contains the options for specifying which attributes<br />
are applied to this monitor for Status page sorting.<br />
Monitor Groups Tab – Contains the options that you can use to<br />
specify which monitor groups the monitor is used with. This tab is<br />
available when you open the Add Monitor window by selecting<br />
Monitors from the Configure menu. It is not available when you<br />
open the Add Monitor window from the Monitor Group Editor.<br />
Access Control Tab – Contains the options for specifying which user<br />
groups have read, write, and delete permissions for this monitor.<br />
Down Time Tab – Contains the options for applying downtime to<br />
this monitor.<br />
Each monitor that you create must have a unique name. In the<br />
Monitor Name box, <strong>OneSight</strong> creates a unique name for the current<br />
monitor by combining the name of the monitor type with the name<br />
of the host to which the monitor applies. To change the default<br />
assigned name, type a unique monitor name that helps you to<br />
identify what this monitor does.<br />
To create an Event Log monitor:<br />
1. On the Monitors Page, click Add to open the Add Monitor<br />
dialog box.<br />
Chapter 5: Configuring Monitors 239
Configuring Event Log Monitors<br />
2. The Monitor Types box lists all of the types of monitors that<br />
can be applied to your monitor group. Click Event Log to add a<br />
monitor that will read your event log.<br />
Use the options on this tab to specify how the monitor will<br />
check an event log.<br />
Import/Export – Click this button to display the Import Export<br />
Monitors dialog box for importing or exporting monitors of this<br />
type. Refer to ―Exporting and Importing Monitors,‖ later in this<br />
chapter for more information.<br />
System Identification – Specifies the system that has the event<br />
log.<br />
DNS Name – Specifies the name or IP address of the host that<br />
has the event log.<br />
NetBIOS Name – Specifies the NetBIOS name of the host that<br />
has the event log.<br />
240 <strong>OneSight</strong> <strong>Administrator</strong> <strong>Guide</strong>
Configuring Event Log Monitors<br />
Authentication – Specifies authentication information. These<br />
fields can be left blank if a <strong>OneSight</strong> Data Collector or Remote<br />
Agent is running on the system being monitored. Otherwise, the<br />
information is required, and if omitted, can result in the<br />
inability to find an appropriate agent for data collection. If you<br />
are monitoring a remote system that is running Windows<br />
2003/2008 and that does not have a Data Collector or Remote<br />
Agent running on it, you must authenticate with a domain, not<br />
directly with the machine.<br />
User Name – Specifies the user name.<br />
Domain – Specifies the domain.<br />
Password – Specifies the password.<br />
Note: Due to Microsoft Windows limitations, monitors that use<br />
NetBios (Windows) Authentication must use a single<br />
username/password combination.<br />
Event Log – Select whether the Windows event log that is being<br />
monitored is an Application, System, or Security event log. You<br />
can also specify a different type of log by typing its name here.<br />
Inactivity Sample Count – If the Event Log data source detects<br />
that the monitored event log does not log any new information<br />
for the number of sample counts you enter here, a sample<br />
failure will result.<br />
Sample Every: – Specifies how often samples are<br />
taken for this monitor. Refer to, ―Sample Every Settings,‖ later<br />
in this chapter for a description of these settings.<br />
Alert Collection Mode – Select how you want alerts to be<br />
processed.<br />
Report Alerts as they Occur – If multiple alerts occur on the<br />
same trigger they are all sent. Alerts with the same timestamp<br />
as a previous alert will not be sent.<br />
Chapter 5: Configuring Monitors 241
Configuring Event Log Monitors<br />
Report First Alert Encountered for a Trigger – The first alert<br />
that occurs during a sample run for a specific trigger is the<br />
only one sent. Subsequent alerts for the same trigger are<br />
ignored.<br />
Report Last Alert Encountered for a Trigger – The last alert<br />
that occurs during a sample run for a specific trigger is the<br />
only one sent. Previous alerts for the same trigger are<br />
ignored.<br />
Report all Alerts for a Trigger as a bundle – Send all alerts that<br />
occur for a specific trigger during the sample run as one alert<br />
message.<br />
Test – When you add or modify a monitor, you can test General<br />
settings to determine if they are set appropriately. After clicking<br />
the Test button, you will see messages in the status window as<br />
the test runs and when the test completes.<br />
3. Each monitor that you add must have a unique name. You can<br />
let <strong>OneSight</strong> create a unique name using the Event Log<br />
specifications you supply, or you can type in your own name<br />
for the monitor.<br />
4. On the General tab, type in the DNS Name, specifying the name<br />
or IP address of the host that has the event log.<br />
5. Type in the NetBIOS Name.<br />
6. Enter authentication information if necessary.<br />
7. Specify the type of Event Log that is being monitored.<br />
242 <strong>OneSight</strong> <strong>Administrator</strong> <strong>Guide</strong>
Configuring Event Log Monitors<br />
8. On the Metric tab, select the type of metric you want to use.<br />
Metric Type – Select the type of metric.<br />
None – Checks to see if the monitor is operational.<br />
Perl Expression Value – Lets you enter a Perl Expression for<br />
parsing the results.<br />
Number of Matching Records – Returns the number of records<br />
that match the specified criteria.<br />
Number of Records in Log – Returns the total number of<br />
records in the log.<br />
Total Records Encountered Since Last Sample – Returns the<br />
number of records added since the last sample.<br />
Chapter 5: Configuring Monitors 243
Configuring Event Log Monitors<br />
Time Since Last Modified – Returns the time since the log was<br />
last modified.<br />
The following additional fields are displayed when you select a<br />
metric type of Perl Expression or Number of Matching Records.<br />
Perl Expression – Enter the Perl Expression to use to parse the<br />
results.<br />
Match if NT Even Source is – Filter based on NT event source.<br />
Separate multiple sources with a comma.<br />
Match if NT Event ID is – Filter based on NT event ID. You can<br />
enter one ID, multiple IDs separated by commas, or a range of<br />
IDs. For example, ―1‖ or ―1,2‖ or ―1,2,7-10‖<br />
Match if Category is – Filter based on category. You can enter a<br />
list of strings or a list of number ranges separated by commas.<br />
Match if Username is – Filter based on Username. You can enter<br />
a list of strings separated by commas.<br />
NT Event Type – Select the type of NT event you want to<br />
monitor. If no type is selected, all event types are monitored.<br />
String Mappings – Displays the String Mappings dialog box for<br />
specifying string mappings. This button is only available when<br />
you select a metric type of Perl Expression.<br />
String Mappings – <strong>OneSight</strong> collects numeric performance<br />
data. If you are measuring an NT event log response that is a<br />
string, it can be converted to a number for use in <strong>OneSight</strong><br />
by using the String Mappings field. Simply specify a<br />
semicolon delimited mapping of Strings to Integers. For<br />
example, ―false=0;true=1‖; will convert a ―false‖ reading to<br />
a 0 value in <strong>OneSight</strong>, and this will be displayed in <strong>OneSight</strong><br />
Status as ―false=0‖. If you only want to display the string on<br />
the <strong>OneSight</strong> status page, use a colon, rather than a semicolon<br />
to delimit the values.<br />
244 <strong>OneSight</strong> <strong>Administrator</strong> <strong>Guide</strong>
Configuring FTP Monitors<br />
If you neglect to provide a mapping for a specific string,<br />
<strong>OneSight</strong> will consider this a Sample Failure, and report the<br />
String that was returned. String Mappings can also be used to<br />
translate a number to a String for display in <strong>OneSight</strong> Status.<br />
This is helpful when numbers represent an objects state.<br />
Note that string matching is case-insensitive and data that has<br />
a colon cannot be used in string mapping.<br />
9. Enter additional criteria if you have selected Perl Expression or<br />
Number of Matching Records.<br />
10. To verify that the monitor will work as configured, click the<br />
Test button. The Monitor Test window provides information<br />
about the success or failure of the test and indicates what may<br />
be causing any problem. Note that the Test button for the Event<br />
Log Monitor will simply verify that the file exists.<br />
11. If the test succeeds, click OK in the Add Monitor dialog box to<br />
save these basic Event Log monitor settings. You can now add<br />
this monitor to a monitor group. Refer to Adding Monitors to a<br />
Monitor Group in Chapter 4.<br />
Configuring FTP Monitors<br />
An FTP monitor verifies that an FTP server is working properly by<br />
connecting to it and retrieving a file. You can set up as many FTP<br />
monitors as you need to determine if your FTP servers are available<br />
and functioning correctly.<br />
At specified time intervals, the FTP monitor connects and logs into<br />
the FTP server, then retrieves the specified file and closes the<br />
connection. If any error occurs, the connection to the FTP server<br />
will be closed.<br />
If an error occurs, the FTP monitor will generate an alert. Some<br />
possible errors are:<br />
Chapter 5: Configuring Monitors 245
Configuring FTP Monitors<br />
unknown host name<br />
unable to connect to server<br />
timeout<br />
login failed<br />
file not found<br />
In the Add Monitor dialog box, when you click FTP in the Monitor<br />
Types box, settings to configure an FTP monitor appear on these<br />
dialog box tabs:<br />
General tab – Contains the options that you can use to create an FTP<br />
monitor for your monitor group.<br />
Advanced tab – Contains options that you can use to configure<br />
advanced connection options, including use of a nonstandard port,<br />
an account, and passive mode.<br />
Alerts tab – Shows what action plan will be used when an alert<br />
occurs. Options on this tab allow you to set up or modify an action<br />
plan that responds to alerts generated by the current FTP monitor.<br />
You can also configure how an alert will affect the monitor group’s<br />
health. It can result in a Warning state, a Critical state, or can have<br />
no impact on health.<br />
Locations Tab – Specifies the Data Collector Location from which<br />
the FTP monitor will interact with a specified FTP server.<br />
SmartLinks Tab – Contains the options for specifying a link to<br />
associate with a particular monitor or metric.<br />
Attributes Tab – Contains the options for specifying which attributes<br />
are applied to this monitor for Status page sorting.<br />
Monitor Groups Tab – Contains the options that you can use to<br />
specify which monitor groups the monitor is used with. This tab is<br />
246 <strong>OneSight</strong> <strong>Administrator</strong> <strong>Guide</strong>
Configuring FTP Monitors<br />
available when you open the Add Monitor window by selecting<br />
Monitors from the Configure menu. It is not available when you<br />
open the Add Monitor window from the Monitor Group Editor.<br />
Access Control Tab – Contains the options for specifying which user<br />
groups have read, write, and delete permissions for this monitor.<br />
Down Time Tab – Contains the options for applying downtime to<br />
this monitor.<br />
Each monitor that you create must have a unique name. In the<br />
Monitor Name box, <strong>OneSight</strong> creates a unique name for the current<br />
monitor by combining the name of the monitor type with the name<br />
of the FTP server to which the monitor applies. To change the<br />
default assigned name, type a unique monitor name that helps you<br />
to identify what this monitor does.<br />
To create an FTP monitor:<br />
1. On the Monitors Page, click Add to open the Add Monitor<br />
dialog box.<br />
Chapter 5: Configuring Monitors 247
Configuring FTP Monitors<br />
2. The Monitor Types box lists all of the types of monitors that<br />
can be applied to your monitor group. Click FTP to add a<br />
monitor that checks the availability and responsiveness of an<br />
FTP server. Use settings on the General tab to configure each<br />
FTP monitor.<br />
Use the options on this tab to specify how the FTP monitor will<br />
connect with an FTP server and GET a file. For case-sensitive<br />
servers, be sure to use the appropriate case when typing the<br />
values used to communicate with the FTP server.<br />
Import/Export – Click this button to display the Import Export<br />
Monitors dialog box for importing or exporting monitors of this<br />
type. Refer to ―Exporting and Importing Monitors,‖ later in this<br />
chapter for more information.<br />
Server Address – Specifies the host name or IP address of the<br />
FTP server.<br />
248 <strong>OneSight</strong> <strong>Administrator</strong> <strong>Guide</strong>
Configuring FTP Monitors<br />
When opening a connection, the server name you provide is<br />
resolved via the Hosts file or a domain name server. If you have<br />
no domain name server on the local network and do not use a<br />
Hosts file, you must specify the full IP address of the host FTP<br />
server.<br />
User Name – Specifies the name used to log in to the FTP<br />
server. This must be a valid user name registered on the FTP<br />
server. When opening an anonymous connection, the user name<br />
is usually ―anonymous.‖<br />
Password – Specifies the password assigned to the specified<br />
user. Most anonymous FTP servers expect you to supply your e-<br />
mail address as the password.<br />
File Name – Specifies the name of the server file that you want<br />
the FTP monitor to retrieve. The specification should include<br />
the name of the server folder where the file is located (for<br />
example: /Maps/Antarctica.html).<br />
Timeout: Seconds – Specifies the maximum number of<br />
seconds to wait while trying to establish an FTP server<br />
connection or for data packets to be transferred from the host.<br />
On Failure – Indicates whether to include additional information<br />
in an alert when the monitor fails.<br />
Include Traceroute in alert – Includes a trace route in the alert.<br />
Include Ping in alert – Includes the results of a ping in the<br />
alert. This option is faster than including the trace route in<br />
the alert.<br />
Do Nothing – Does not include any additional information in<br />
the alert.<br />
Sample Every: – Specifies how often samples are<br />
taken for this monitor. Refer to, ―Sample Every Settings,‖ later<br />
in this chapter for a description of these settings.<br />
Chapter 5: Configuring Monitors 249
Configuring FTP Monitors<br />
Test – When you add or modify a monitor, you can test General<br />
and Advanced settings to determine if they are set<br />
appropriately. After clicking the Test button, you will see<br />
messages in the status window as the test runs and when the test<br />
completes.<br />
3. Each monitor that you add must have a unique name. You can<br />
let <strong>OneSight</strong> create a unique name using the FTP specifications<br />
you supply, or you can type in your own name for the monitor.<br />
4. On the General tab, type in the server address of the FTP server<br />
that you want to monitor. For example: ftp.company.com<br />
5. Type in a known user name and password for the FTP server. If<br />
a specific user name and password combination is not known,<br />
try anonymous as the user name. An e-mail address is often the<br />
default password.<br />
6. Type the name of the server file that you want the FTP monitor<br />
to retrieve. The specification should include the name of the<br />
server folder where the file is located (for example:<br />
/Maps/Antarctica.html).<br />
7. By default, an FTP monitor will check the availability and<br />
responsiveness of the FTP server every 10 minutes and will time<br />
out after 120 seconds if the requested file is not found. If you<br />
want the monitor to sample more or less frequently, change the<br />
sampling interval. If you want to have the timeout occur earlier<br />
or later, change the Timeout setting.<br />
8. To verify that the monitor will work as configured, click the<br />
Test button. The Monitor Test window provides information<br />
about the success or failure of the test and indicates what may<br />
be causing any problem.<br />
9. If the test succeeds, click OK in the Add Monitor dialog box to<br />
save these basic FTP monitor settings. You can now add this<br />
250 <strong>OneSight</strong> <strong>Administrator</strong> <strong>Guide</strong>
Configuring FTP Monitors<br />
monitor to a monitor group. Refer to Adding Monitors to a<br />
Monitor Group in Chapter 4.<br />
Configuring Advanced Options<br />
When you add an FTP monitor, the Advanced tab displays the<br />
options that you can use to configure advanced connection options,<br />
including use of a nonstandard port, an account, and passive mode.<br />
Account – Specifies the name of the account to log in to on the FTP<br />
server. Most servers do not require this information.<br />
When logging in, some servers require the name of the account that<br />
the user wants to access. For servers with this requirement, you<br />
cannot work with the files in that account until you supply an<br />
account name. If your server uses accounts as part of access control,<br />
Chapter 5: Configuring Monitors 251
Configuring LDAP Monitors<br />
type the name of the account you want to access. For case-sensitive<br />
servers, be sure to use the appropriate case when typing the account<br />
name.<br />
Typically, anonymous FTP servers do not request an account, so<br />
this setting can be omitted. When you connect to an FTP site with a<br />
defined account setting, the account name is sent to the server as the<br />
last step in the login process.<br />
Port – Specifies a standard or nonstandard TCP service port number<br />
or socket for FTP. The standard service port for FTP is 21.<br />
Use Passive Mode – Passive mode is required for connections<br />
through some firewalls. When selected, the FTP monitor will send a<br />
PASV command to communicate with the server in passive mode. A<br />
separate data connection will be initiated for file transfers.<br />
Configuring LDAP Monitors<br />
You can set up Lightweight Directory Access Protocol (LDAP)<br />
monitors to test the connection to an LDAP Server. The monitor<br />
returns the response time for connecting to the LDAP server and can<br />
optionally authenticate.<br />
In the Add Monitor dialog box, when you click LDAP in the<br />
Monitor Types box, settings to configure an LDAP monitor appear<br />
on these dialog box tabs:<br />
General Tab – Contains the options that you can use to create a<br />
LDAP monitor for your monitor group.<br />
Alerts Tab – Displays the options that you can use to define alerts<br />
and associate them with action plans. You can also configure how a<br />
LDAP alert will affect the monitor group’s health. It can result in a<br />
Warning state, a Critical state, or can have no impact on health.<br />
Locations Tab – Specifies the Data Collector Location from which<br />
the LDAP monitor checks the specified metric of a specific host.<br />
252 <strong>OneSight</strong> <strong>Administrator</strong> <strong>Guide</strong>
Configuring LDAP Monitors<br />
SmartLinks Tab – Contains the options for specifying a link to<br />
associate with a particular monitor or metric.<br />
Attributes Tab – Contains the options for specifying which attributes<br />
are applied to this monitor for Status page sorting.<br />
Monitor Groups Tab – Contains the options that you can use to<br />
specify which monitor groups the monitor is used with. This tab is<br />
available when you open the Add Monitor window by selecting<br />
Monitors from the Configure menu. It is not available when you<br />
open the Add Monitor window from the Monitor Group Editor.<br />
Access Control Tab – Contains the options for specifying which user<br />
groups have read, write, and delete permissions for this monitor.<br />
Down Time Tab – Contains the options for applying downtime to<br />
this monitor.<br />
Each monitor that you create must have a unique name. In the<br />
Monitor Name box, <strong>OneSight</strong> creates a unique name for the current<br />
monitor by combining the name of the monitor type with the name<br />
of the host to which the monitor applies. To change the default<br />
assigned name, type a unique monitor name that helps you to<br />
identify what this monitor does.<br />
To create an LDAP monitor:<br />
1. On the Monitors Page, click Add to open the Add Monitor<br />
dialog box.<br />
Chapter 5: Configuring Monitors 253
Configuring LDAP Monitors<br />
2. The Monitor Types box lists all of the types of monitors that<br />
can be applied to your monitor group. Click LDAP to add a<br />
monitor that confirms that a host is responding. Use settings on<br />
the General tab to configure each LDAP monitor.<br />
Host – Specify the host name or IP address of the LDAP Server.<br />
Port – Enter a port number if different from the default.<br />
Anonymous bind – When selected, the connection to the LDAP<br />
Server will be Anonymous Bind, otherwise, the connection will<br />
use simple LDAP authentication.<br />
Note: SSL and SASL authentication schemes are not available.<br />
User DN – Enter the distinguished name.<br />
Password – Enter the password.<br />
254 <strong>OneSight</strong> <strong>Administrator</strong> <strong>Guide</strong>
Configuring LDAP Monitors<br />
Compare Test (Optional) – Enter this information if you want to<br />
check to see if an entry contains an attribute with a specified<br />
value.<br />
Entry DN – Enter the distinguished name of the entry to use in<br />
the comparison.<br />
has attribute name – Enter the attribute to compare against<br />
the entry.<br />
with value – Enter the value to compare against the entry.<br />
Sample Every: – Specifies how often samples are<br />
taken for this monitor. Refer to, ―Sample Every Settings,‖ later<br />
in this chapter for a description of these settings.<br />
3. Each monitor that you add must have a unique name. You can<br />
let <strong>OneSight</strong> create a unique name using the LDAP<br />
specifications you supply, or you can type in your own name<br />
for the monitor.<br />
4. Enter the host name or IP address of the host to monitor.<br />
5. Enter the port number if different from the default.<br />
6. Enter the User DN and password.<br />
7. Optionally enter comparison test information.<br />
8. Enter how often to sample.<br />
9. To verify that the monitor will work as configured, click the<br />
Test button. The Monitor Test window provides information<br />
about the success or failure of the test and indicates what may<br />
be causing any problem.<br />
10. If the test succeeds, click OK in the Add Monitor dialog box to<br />
save these basic LDAP monitor settings. You can now add this<br />
Chapter 5: Configuring Monitors 255
Configuring Log File, Directory Monitors<br />
monitor to a monitor group. Refer to Adding Monitors to a<br />
Monitor Group in Chapter 4.<br />
Configuring Log File, Directory Monitors<br />
There are two types of monitors that can be configured:<br />
Log File<br />
Directory<br />
Log File Monitors<br />
You can set up a Log File monitor to determine if the log file<br />
associated with a monitor group component, such as a web server,<br />
has information in the error log that indicates a problem with your<br />
monitor group. Additionally, some applications publish<br />
performance data to a text log file, so the Log File Monitor also<br />
allows you to specify Perl expressions for collecting performance<br />
data from a log file entry.<br />
Note: <strong>OneSight</strong> also includes profile monitors for IIS and Apache<br />
web servers. These profile-based monitors use a set of preselected<br />
metrics and allow you to apply the same settings to multiple<br />
machines.<br />
At specified time intervals, the Log File monitor checks the log file<br />
and optionally checks for a particular content string within the log<br />
file.<br />
Note: After restarting <strong>OneSight</strong>, the Log File monitor does not look<br />
at historical data.<br />
Log file metrics can be configured in two operating modes:<br />
One line at a time mode – each line read from the file is treated as<br />
a single log file entry and is processed individually.<br />
256 <strong>OneSight</strong> <strong>Administrator</strong> <strong>Guide</strong>
Configuring Log File, Directory Monitors<br />
Arbitrary record-based mode – a Perl expression is used to<br />
determine where each record in the file starts and ends. The<br />
expression is applied to the data as it is read, and records are<br />
picked out as they are found. Entries that exceed the specified<br />
maximum record size are ignored.<br />
Note: To use this monitor with a UNIX machine, the UNIX Remote<br />
Agent must be installed on the monitored machine.<br />
Directory Monitors<br />
You can monitor directory existence, size, or the number of files or<br />
folders in a directory. For metrics that apply to folders, you can<br />
select whether to return values on the directory and all<br />
subdirectories or only the topmost directory.<br />
Directory monitors are useful, for example, if you have an<br />
application that creates a log file every time it fails. You can count<br />
the number of files or folders in a directory and generate an alert if<br />
there were too many log files.<br />
In the Add Monitor dialog box, when you click Log File, Directory in<br />
the Monitor Types box, settings to configure a Log File, Directory<br />
monitor appear on these dialog box tabs:<br />
General Tab – Contains the options that you can use to create a Log<br />
File, Directory monitor for your monitor group.<br />
Alerts Tab – Displays the options that you can use to define alerts<br />
and associate them with action plans. You can also configure how a<br />
Log File, Directory alert will affect the monitor group’s health. It<br />
can result in a Warning state, a Critical state, or can have no impact<br />
on health.<br />
SmartLinks Tab – Contains the options for specifying a link to<br />
associate with a particular monitor or metric.<br />
Chapter 5: Configuring Monitors 257
Configuring Log File, Directory Monitors<br />
Attributes Tab – Contains the options for specifying which attributes<br />
are applied to this monitor for Status page sorting.<br />
Monitor Groups Tab – Contains the options that you can use to<br />
specify which monitor groups the monitor is used with. This tab is<br />
available when you open the Add Monitor window by selecting<br />
Monitors from the Configure menu. It is not available when you<br />
open the Add Monitor window from the Monitor Group Editor.<br />
Access Control Tab – Contains the options for specifying which user<br />
groups have read, write, and delete permissions for this monitor.<br />
Down Time Tab – Contains the options for applying downtime to<br />
this monitor.<br />
Each monitor that you create must have a unique name. In the<br />
Monitor Name box, <strong>OneSight</strong> creates a unique name for the current<br />
monitor by combining the name of the monitor type with the name<br />
of the host to which the monitor applies. To change the default<br />
assigned name, type a unique monitor name that helps you to<br />
identify what this monitor does.<br />
To create a Log File, Directory monitor:<br />
Note: The Log File monitor requires a <strong>OneSight</strong> Data Collector or<br />
Remote Agent to be installed on the same machine as the file being<br />
monitored.<br />
1. On the Monitors Page, click Add to open the Add Monitor<br />
dialog box.<br />
258 <strong>OneSight</strong> <strong>Administrator</strong> <strong>Guide</strong>
Configuring Log File, Directory Monitors<br />
2. The Monitor Types box lists all of the types of monitors that<br />
can be applied to your monitor group. Click Log File, Directory<br />
to add a monitor that will read your text log files for content<br />
string matches.<br />
Import/Export – Click this button to display the Import Export<br />
Monitors dialog box for importing or exporting monitors of this<br />
type. Refer to ―Exporting and Importing Monitors,‖ later in this<br />
chapter for more information.<br />
Monitor Type – Specifies the type of monitor you want to create:<br />
Log File – Select this monitor type to monitor a log file.<br />
Directory – Select this monitor type to monitor a directory.<br />
Collector Host Name – Specifies the name or IP address of the<br />
machine where the log file or socket is being monitored. This is<br />
the machine that is running the data collector.<br />
Chapter 5: Configuring Monitors 259
Configuring Log File, Directory Monitors<br />
File/Directory Name – Specifies the path to the log file or<br />
directory that you want to monitor. For example,<br />
c:\temp|mlog.txt.<br />
Metric Type – Select the type of metric. The metric types that<br />
are available depend on the type of monitor you are using:<br />
Log File Monitor<br />
Perl Expression – select this option when you want to use a<br />
Perl expression to collect numerical performance data from a<br />
log file entry.<br />
Number of Matching Records – this metric returns the number<br />
of records that match the entered Perl expression.<br />
File/Directory Existence – this metric returns a one when the<br />
file or directory exists, otherwise, it returns a sample failure.<br />
File/Directory Size – this metric returns the size of the file or<br />
directory.<br />
Total Records Encountered Since Last Sample – this metric<br />
returns the number of records written to the log file since the<br />
last sample.<br />
Time Since Last Modified – this metric returns the length of<br />
time since the log file was changed.<br />
Directory Monitor<br />
File/Directory Existence – this metric returns whether the file<br />
or directory exists.<br />
File/Directory Size – this metric returns the file or directory<br />
size.<br />
Number of Folders – this metric returns the number of folders<br />
in the directory.<br />
260 <strong>OneSight</strong> <strong>Administrator</strong> <strong>Guide</strong>
Configuring Log File, Directory Monitors<br />
Number of Files – this metric returns the number of files in the<br />
directory.<br />
Time Since Last Modified – this metric returns the length of<br />
time since the directory was last modified.<br />
Perl Expression –Specifies a Perl Expression used to collect<br />
numerical performance data from a log file entry. The monitor<br />
checks the last entry whenever the log file changes. This<br />
returned data can then be used within <strong>OneSight</strong>, both for<br />
alerting, using threshold alerts, and reporting.<br />
To check whether the file exists, use the File/directory exits<br />
metric type and leave this field blank.<br />
String Mappings – Displays the String Mappings dialog box for<br />
specifying string mappings.<br />
String Mappings – <strong>OneSight</strong> collects numeric performance<br />
data. If you are measuring a log file response that is a string,<br />
it can be converted to a number for use in <strong>OneSight</strong> by using<br />
the String Mappings field. Simply specify a semicolon<br />
delimited mapping of Strings to Integers. For example,<br />
―false=0;true=1‖; will convert a ―false‖ reading to a 0 value<br />
in <strong>OneSight</strong>, and this will be displayed in <strong>OneSight</strong> Status as<br />
―false=0‖. If you only want to display the string on the<br />
<strong>OneSight</strong> status page, use a colon, rather than a semi-colon to<br />
delimit the values.<br />
If you neglect to provide a mapping for a specific string,<br />
<strong>OneSight</strong> will consider this a Sample Failure, and report the<br />
String that was returned. String Mappings can also be used to<br />
translate a number to a String for display in <strong>OneSight</strong> Status.<br />
This is helpful when numbers represent an objects state.<br />
Note that string matching is case-insensitive and data that has<br />
a colon cannot be used in string mapping.<br />
Record Type – Specifies the operating mode:<br />
Chapter 5: Configuring Monitors 261
Configuring Log File, Directory Monitors<br />
Each record is one line – select this option to use one line at a<br />
time operating mode. In this mode each line read from the<br />
file is treated as a single log file entry and is processed<br />
individually.<br />
PERL expression defines record – select this option to use<br />
arbitrary record-based mode. In this mode a Perl expression<br />
is used to determine where each record in the file starts and<br />
ends. The expression is applied to the data as it is read, and<br />
records are picked out as they are found. Entries that exceed<br />
the specified maximum record size are ignored.<br />
If you select Perl expression defines record, the following<br />
additional fields are displayed:<br />
Max Record Length – Enter the maximum record length.<br />
Entries that exceed this length are ignored.<br />
Record Format (PERL) – Enter the Perl expression defining<br />
the record, including the delimiter character.<br />
Unit Measure – Specifies the units to use when displaying the<br />
metric.<br />
Inactivity Sample Count – If the Log File data source detects that<br />
the monitored log file does not log any new information for the<br />
number of sample counts you enter here, a sample failure will<br />
result.<br />
File/Directory Must Exist – Select to check that the file/directory<br />
exists.<br />
Directory Range – Specify whether to monitor all directories<br />
including sub directories or to monitor only the top directory.<br />
This field applies to all metric types except File/Directory<br />
Existence monitors.<br />
Sample Continuously – Select to sample continuously. This field<br />
is only available when Metric Type is Perl Expression value.<br />
262 <strong>OneSight</strong> <strong>Administrator</strong> <strong>Guide</strong>
Configuring Log File, Directory Monitors<br />
Sample Every: – Specifies how often samples are<br />
taken for this monitor. Refer to, ―Sample Every Settings,‖ later<br />
in this chapter for a description of these settings.<br />
Alert Collection Mode – Select how you want alerts to be<br />
processed.<br />
Report Alerts as they Occur – If multiple alerts occur on the<br />
same trigger they are all sent. Alerts with the same timestamp<br />
as a previous alert will not be sent.<br />
Report First Alert Encountered for a Trigger – The first alert<br />
that occurs during a sample run for a specific trigger is the<br />
only one sent. Subsequent alerts for the same trigger are<br />
ignored.<br />
Report Last Alert Encountered for a Trigger – The last alert<br />
that occurs during a sample run for a specific trigger is the<br />
only one sent. Previous alerts for the same trigger are<br />
ignored.<br />
Report all Alerts for a Trigger as a bundle – Send all alerts that<br />
occur for a specific trigger during the sample run as one alert<br />
message.<br />
Test – When you add or modify a monitor, you can test General<br />
settings to determine if they are set appropriately. After clicking<br />
the Test button, you will see messages in the status window as<br />
the test runs and when the test completes.<br />
3. Each monitor that you add must have a unique name. You can<br />
let <strong>OneSight</strong> create a unique name using the Log File<br />
specifications you supply, or you can type in your own name<br />
for the monitor.<br />
4. On the General tab, specify the type of monitor you want to<br />
create.<br />
Chapter 5: Configuring Monitors 263
Configuring Mail Monitors<br />
5. Enter the Collector Host Name, specifying the name or IP<br />
address of the host that has the log file to be monitored.<br />
6. Type in the File Name, specifying the name of the log file you<br />
want to monitor.<br />
7. Select the Metric Type.<br />
8. Type in a Perl Expression to collect performance data from a<br />
log file entry. If you want to verify that the file exists use the<br />
File/directory exists metric type and leave this field blank.<br />
9. On the Alerts tab, add your content string tests using the Pattern<br />
Match alert. If you have specified a Perl Expression to collect<br />
performance data, you can also add threshold alerts.<br />
10. To verify that the monitor will work as configured, click the<br />
Test button. The Monitor Test window provides information<br />
about the success or failure of the test and indicates what may<br />
be causing any problem. Note that the Test button for the Log<br />
File Monitor will simply verify that the file exists.<br />
11. If the test succeeds, click OK in the Add Monitor dialog box to<br />
save these basic Log File monitor settings. You can now add<br />
this monitor to a monitor group. Refer to Adding Monitors to a<br />
Monitor Group in Chapter 4.<br />
Configuring Mail Monitors<br />
A Mail monitor verifies that the mail server is accepting requests<br />
and that e-mails can be sent and retrieved. You can set up as many<br />
Mail monitors as you need to determine if mail servers used by your<br />
monitor group are available and functioning correctly.<br />
At specified time intervals, the Mail monitor sends a standard e-<br />
mail message using SMTP and then retrieves that same message via<br />
a POP3 user account. Each e-mail that the Mail monitor sends<br />
includes a unique key that is checked to insure that the right e-mail<br />
264 <strong>OneSight</strong> <strong>Administrator</strong> <strong>Guide</strong>
Configuring Mail Monitors<br />
is retrieved. If the Mail monitor is unable to send and receive the e-<br />
mail, it generates an alert.<br />
In the Add Monitor dialog box, when you click Mail in the Monitor<br />
Types box, settings to configure a Mail monitor appear on these<br />
dialog box tabs:<br />
General Tab – Contains the options that you can use to create a Mail<br />
monitor for your monitor group.<br />
Alerts Tab – Shows what action plan will be used when a Receive<br />
Mail Failure alert occurs. Options on this tab allow you to set up or<br />
modify an action plan that responds to Receive Mail Failure alerts<br />
generated by the current Mail monitor. You can also configure how<br />
a Receive Mail Failure alert will affect the monitor group’s health.<br />
It can result in a Warning state, a Critical state, or can have no<br />
impact on health. New alerts cannot be added to Mail monitors.<br />
Locations Tab – Specifies the Data Collector Location from which<br />
the Mail monitor verifies the mail server is accepting requests and<br />
that e-mail messages can be sent and retrieved.<br />
SmartLinks Tab – Contains the options for specifying a link to<br />
associate with a particular monitor or metric.<br />
Attributes Tab – Contains the options for specifying which attributes<br />
are applied to this monitor for Status page sorting.<br />
Monitor Groups Tab – Contains the options that you can use to<br />
specify which monitor groups the monitor is used with. This tab is<br />
available when you open the Add Monitor window by selecting<br />
Monitors from the Configure menu. It is not available when you<br />
open the Add Monitor window from the Monitor Group Editor.<br />
Access Control Tab – Contains the options for specifying which user<br />
groups have read, write, and delete permissions for this monitor.<br />
Chapter 5: Configuring Monitors 265
Configuring Mail Monitors<br />
Down Time Tab – Contains the options for applying downtime to<br />
this monitor.<br />
Each monitor that you create must have a unique name. In the<br />
Monitor Name box, <strong>OneSight</strong> creates a unique name for the current<br />
monitor by combining the name of the monitor type with the name<br />
of the SMTP server to which the monitor applies. To change the<br />
default assigned name, type a unique monitor name that helps you<br />
to identify what this monitor does.<br />
To create a Mail monitor:<br />
1. On the Monitors Page, click Add to open the Add Monitor<br />
dialog box.<br />
2. The Monitor Types box lists all of the types of monitors that<br />
can be applied to your monitor group. Click Mail to add a<br />
monitor that checks the availability and responsiveness of a<br />
Mail server. Use settings on the General tab to configure each<br />
Mail monitor.<br />
266 <strong>OneSight</strong> <strong>Administrator</strong> <strong>Guide</strong>
Configuring Mail Monitors<br />
Use the options on this tab to define how often the Mail<br />
monitor should send a standard e-mail message using a specific<br />
SMTP server and then retrieve that same message via a<br />
specified POP3 user account.<br />
Send Test Message Using Settings – The options in this group<br />
box specify the server that you want to use to send a test<br />
message and the e-mail address to which the test message<br />
should be sent.<br />
Server (SMTP) – Type the fully qualified host name of the SMTP<br />
Import/Export – Click this button to display the Import Export<br />
Monitors dialog box for importing or exporting monitors of this<br />
type. Refer to ―Exporting and Importing Monitors,‖ later in this<br />
chapter for more information.<br />
(outgoing) mail server to which the test mail message should<br />
be sent. You must specify the domain in the server name. For<br />
example: mailout.yourcompany.com.<br />
Port (SMTP) – The Mail monitor uses the standard SMTP port<br />
(25). If you use a nonstandard SMTP port, you can specify it<br />
here.<br />
From E-Mail Address – Type the mail address from which the<br />
test message will be sent (for example,<br />
mailtest@yourcompany.com).<br />
To E-Mail Address – Type the mail address to which the test<br />
message should be sent (for example,<br />
mailtest@yourcompany.com). This should be the address for the<br />
POP account that you specify in the Account Name box.<br />
This server (SMTP) requires authentication – Check this box if<br />
the server requires authentication.<br />
Account Name – Enter the account name. For example,<br />
defghi@gmail.com.<br />
Chapter 5: Configuring Monitors 267
Configuring Mail Monitors<br />
Password – Enter the password for the account.<br />
This server requires a secure connection (SSL) –Select this<br />
checkbox if the server requires an encrypted connection.<br />
Wait For Seconds Before Checking – Specifies the amount<br />
of time (in seconds) to wait before attempting to retrieve the<br />
test message. If the test message is not received in this<br />
amount of time, the Mail test is retried.<br />
Check If Test Message Received On settings – The options in<br />
this group box specify the server and user account that you<br />
want to use to retrieve the test message.<br />
Server (POP) – Type the fully qualified host name of the POP<br />
mail server (incoming) that should receive the test message.<br />
You must specify the domain in the server name. For<br />
example: mailin.yourcompany.com.<br />
Port (POP) – The Mail monitor uses the standard POP port<br />
(110). If you use a nonstandard POP port, you can specify it<br />
here.<br />
Account Name – Type the name of the user account to which<br />
the test message will be sent (for example, mailtest). This<br />
should be the account name for the e-mail address that you<br />
specified in the E-Mail Address box.<br />
Password – Type the POP mail server password, if necessary,<br />
for the test mail account.<br />
This server requires a secure connection (SSL) –select this<br />
checkbox if the server requires an encrypted connection. The<br />
target email server must be using SSL and you must place the<br />
mail server trust certificate in the .keystore file in the Data<br />
Collector installation directory for all Data Collectors in this<br />
location.<br />
268 <strong>OneSight</strong> <strong>Administrator</strong> <strong>Guide</strong>
Configuring Mail Monitors<br />
On Failure – Indicates whether to include additional information<br />
in an alert when the monitor fails.<br />
Include Traceroute in alert – Includes a trace route in the alert.<br />
Include Ping in alert – Includes the results of a ping in the<br />
alert. This option is faster than including the trace route in<br />
the alert.<br />
Do Nothing – Does not include any additional information in<br />
the alert.<br />
Sample Every: – Specifies how often samples are<br />
taken for this monitor. Refer to, ―Sample Every Settings,‖ later<br />
in this chapter for a description of these settings.<br />
Retries – Sets the upper limit for the number of times a Mail<br />
test is retried. For example, if Retries is set to 3, the Mail<br />
message will be sent up to four times (the initial try plus three<br />
retries). After the fourth try, if no response is received, the Mail<br />
check is treated as a sample failure.<br />
Test – When you add or modify a monitor, you can test General<br />
settings to determine if they are set appropriately. After clicking<br />
the Test button, you will see messages in the status window as<br />
the test runs and when the test completes. If you see a 501<br />
(syntax error) message, there may be a problem with your<br />
<strong>OneSight</strong> server name.<br />
3. Each monitor that you add must have a unique name. You can<br />
let <strong>OneSight</strong> create a unique name, or you can type in your own<br />
name for the monitor.<br />
4. On the General tab, type in the SMTP server address of the mail<br />
server that you want to monitor. For example:<br />
smtphost.company.com<br />
5. Type the mail address to which the test message should be sent<br />
(for example, mailtest@yourcompany.com). This should be the<br />
Chapter 5: Configuring Monitors 269
Configuring Mail Monitors<br />
address for the POP account that you specify later in the<br />
Account Name box.<br />
6. In the Wait For box, enter the amount of time (in seconds) to<br />
wait before attempting to retrieve the test message.<br />
7. In the Server (POP) box, type the fully qualified host name of<br />
the POP mail server (incoming) that should receive the test<br />
message. You must specify the domain in the server name. For<br />
example: mailin.yourcompany.com<br />
8. In the Account Name box, type the name of the user account to<br />
which the test message will be sent (for example, mailtest).<br />
This should be the account name for the e-mail address that you<br />
specified in the E-mail Address box.<br />
9. Type the POP mail server password, if necessary, for the test<br />
mail account.<br />
10. By default, a Mail monitor will check the availability of the<br />
mail server every 10 minutes.<br />
The Retries box sets the upper limit for the number of times a<br />
mail test is retried. For example, if Retries is set to 3, the mail<br />
message will be sent up to four times (the initial try plus three<br />
retries). After the fourth try, if no response is received, the mail<br />
check is treated as a sample failure.<br />
11. To verify that the monitor will work as configured, click the<br />
Test button. The Monitor Test window provides information<br />
about the success or failure of the test and indicates what may<br />
be causing any problem. If you see a 501 (invalid syntax error),<br />
you may have a problem with your <strong>OneSight</strong> server name.<br />
270 <strong>OneSight</strong> <strong>Administrator</strong> <strong>Guide</strong>
Configuring Mail Monitors<br />
12. If the test succeeds, click OK in the Add Monitor dialog box to<br />
save these basic mail monitor settings. You can now add this<br />
monitor to a monitor group. Refer to Adding Monitors to a<br />
Monitor Group in Chapter 4.<br />
Validating E-Mail Connections<br />
E-mail servers that check the host name using RFC 810 will not<br />
accept connections to machines with a name containing an<br />
underscore. If the machine name of the <strong>OneSight</strong> server includes an<br />
underscore, you may have problems associated with e-mail servers<br />
under the following conditions:<br />
If you change the default mail server specification in the Global<br />
Action Options dialog box.<br />
If you configure a Mail monitor for an e-mail server that enforces<br />
RFC 810.<br />
Most e-mail servers do not enforce this RFC. To check for this<br />
problem on <strong>OneSight</strong> servers with names that include an<br />
underscore:<br />
Test your Mail monitor when you create it.<br />
Test your e-mail action when you create it.<br />
SMTP daemons that do not accept this host name return a 501<br />
(syntax error) message when a connection is attempted. If you see<br />
an error of this type, you can reconfigure the monitored component<br />
or the e-mail server or you can install <strong>OneSight</strong> on a machine that<br />
has a name without an underscore.<br />
RFC 810 states that the host name must be ―text string up to 24<br />
characters drawn from the alphabet (A-Z), digits (0-9), and the<br />
minus sign (-) and period (.). No blank or space characters are<br />
permitted as part of a name. No distinction is made between upper<br />
Chapter 5: Configuring Monitors 271
Configuring Oracle OpenScript Profile Monitors<br />
and lower case. The first character must be a letter. The last<br />
character must not be a minus sign or period.‖<br />
Configuring Oracle OpenScript Profile Monitors<br />
You can set up an Oracle OpenScript profile monitor to replay your<br />
scripts previously recorded in Oracle OpenScript and exported as a<br />
.zip file. <strong>OneSight</strong> supports functional testing for web and load<br />
testing for web/http script types.<br />
Note: The Oracle OpenScript monitor requires the installation of the<br />
<strong>OneSight</strong> Data Collector for Windows on the host machine running<br />
OpenScript. In addition, OpenScript must be installed on all data<br />
collector locations that are assigned to the monitor.<br />
Note: Only one functional web test can be run on a data collector at<br />
one time.<br />
At specified time intervals, the Oracle OpenScirpt profile monitor<br />
replays an OpenScript Script and measures its response time.<br />
In the Add Monitor dialog box, when you click Oracle OpenScript<br />
in the Monitor Types box, settings to configure an Oracle<br />
OpenScript monitor appear on these dialog box tabs:<br />
General Tab – Contains the options that you can use to create an<br />
Oracle OpenScript monitor for your monitor group.<br />
Advanced Tab – Lets you enter the parameters to use for running<br />
OpenScript scripts from the command line.<br />
Proxy Tab – Displays the authentication data that was imported from<br />
OpenScript when the script was imported. This information is used<br />
for web sites that require login via a popup dialog box. The<br />
authentication data automates the login process during script<br />
playback.<br />
272 <strong>OneSight</strong> <strong>Administrator</strong> <strong>Guide</strong>
Configuring Oracle OpenScript Profile Monitors<br />
Alerts Tab – Displays the options that you can use to define alerts<br />
and associate them with action plans. You can also configure how<br />
an Oracle OpenScript alert will affect the monitor group’s health. It<br />
can result in a Warning state, a Critical state, or can have no impact<br />
on health.<br />
You can modify alerts for all Oracle OpenScript monitors by<br />
modify the Oracle OpenScript profile or you can modify individual<br />
alerts for a specific monitor by clicking the Alert button on the<br />
Alerts tab.<br />
Locations Tab – Specifies the Data Collector Location to use as an<br />
Oracle OpenScript monitor for your monitor group.<br />
Attributes Tab – Contains the options for specifying which attributes<br />
are applied to this monitor for Status page sorting.<br />
Monitor Groups Tab – Contains the options that you can use to<br />
specify which monitor groups the monitor is used with. This tab is<br />
available when you open the Add Monitor window by selecting<br />
Monitors from the Configure menu. It is not available when you<br />
open the Add Monitor window from the Monitor Group Editor.<br />
Access Control Tab – Contains the options for specifying which user<br />
groups have read, write, and delete permissions for this monitor.<br />
Down Time Tab – Contains the options for applying downtime to<br />
this monitor.<br />
Monitor Name – Each monitor that you create must have a unique<br />
name. In the Monitor Name box, <strong>OneSight</strong> creates a unique name<br />
for the current monitor by combining the name of the monitor type<br />
with the name of the host to which the monitor applies. To change<br />
the default assigned name, type a unique monitor name that helps<br />
you to identify what this monitor does.<br />
Chapter 5: Configuring Monitors 273
Configuring Oracle OpenScript Profile Monitors<br />
Profile – Lists the profiles that are available to apply to this monitor.<br />
Multiple profiles may be listed if you have upgraded from a<br />
previous version of <strong>OneSight</strong>.<br />
Modify – Displays the <strong>OneSight</strong> Profile Editor that lets you add and<br />
remove metrics, and configure alerts, smartlinks, and attributes for<br />
this profile.<br />
Note: When you modify alerts for Oracle OpenScript profile<br />
monitors, you must select Override profile in the Alert Editor to make<br />
the fields available. Any changes that you make will apply to this<br />
monitor only, not to the profile itself.<br />
1. Click Add in the Monitors Page. The Monitor Types box lists<br />
all of the types of monitors that can be applied to your monitor<br />
group. Click Oracle OpenScript. You will use the settings on the<br />
General Tab to configure the Oracle OpenScript Monitor.<br />
274 <strong>OneSight</strong> <strong>Administrator</strong> <strong>Guide</strong>
Configuring Oracle OpenScript Profile Monitors<br />
This dialog box has the following options:<br />
Script – Displays the name of the script associated with this<br />
monitor and buttons to import, export, or view properties of the<br />
Script associated with this monitor.<br />
Note: It is recommended that the last step in your script is to<br />
close the browser window to ensure that processes are not left<br />
open. You can do this either by closing the browser window<br />
before you stop recording the script or using the right-click<br />
menu in Oracle OpenScript to add the close browser step. To do<br />
this, select Add from the right-click menu, select Other, expand<br />
the browser folder in the tree, and select Close Browser.<br />
Import – Opens a dialog box for selecting the OpenScript<br />
Script to import into the <strong>OneSight</strong> database. The imported<br />
file must be an Oracle OpenScript .zip file exported from<br />
OpenScript. This file contains all of the files necessary to run<br />
the script and can be located anywhere.<br />
Export – Opens a dialog box for specifying the location<br />
where you want to export the Script. This button is only<br />
available when you are modifying a monitor.<br />
Info – Displays the Script Import Information dialog box<br />
showing the name of the script and the date it was imported.<br />
When you have reimported a script, this dialog box also<br />
displays unmatched pages.<br />
Pages are matched when both the ordinal and name in the<br />
reimported script match those in the previously imported<br />
script. Pages can become unmatched when you add, insert,<br />
rename, or delete pages in the script in OpenScript. History is<br />
not available for unmatched scripts.<br />
For example, if the original script had the following pages:<br />
[1](/www.google.com)<br />
Chapter 5: Configuring Monitors 275
Configuring Oracle OpenScript Profile Monitors<br />
[2] Empirix<br />
[3] Empirix - Products<br />
And a second login page is added so that the new script has<br />
the following pages:<br />
[1](/www.google.com)<br />
[2] Empirix<br />
[3] Empirix - Company<br />
[4] Empirix - Products<br />
The Empirix – Products page has a different ordinal so it is<br />
considered unmatched.<br />
Playback Settings – lets you configure the following options for<br />
determining how the script is played back.<br />
Browser Type – This field is only displayed when you have<br />
imported a script for a functional test. Select the browser type that<br />
you want to use, either Internet Explorer or Firefox.<br />
Show/Hide – These buttons are only displayed when the browser<br />
type is Internet Explorer. It is recommended that you select hide to<br />
hide the browser during playback. If certain actions in the script<br />
require the browser to be visible, such as key presses and physical<br />
mouse clicks, the script will not play back correctly.<br />
Sample Every: Advanced – Specifies how often<br />
samples are taken for this monitor. Sample frequency for<br />
Oracle OpenScript monitors apply to the entire transaction,<br />
that is, you cannot run one page at a different sample<br />
frequency than another. This means that alerts should be<br />
configured at the script level. Refer to, ―Sample Every<br />
Settings,‖ later in this chapter for a description of these<br />
settings.<br />
Timeout Every – Specifies how long the <strong>OneSight</strong><br />
agent should wait for the Oracle OpenScript agent to indicate<br />
276 <strong>OneSight</strong> <strong>Administrator</strong> <strong>Guide</strong>
Configuring Oracle OpenScript Profile Monitors<br />
that playback has finished before timing out. Select the unit<br />
of time: seconds, minutes, or hours.<br />
Retries – Specifies the number of times to retry running the<br />
Script before triggering a response plan or reporting a failure<br />
on the status page. Retries are triggered by the Oracle<br />
OpenScript alerts that affect the monitor availability. The<br />
alerts that affect availability are:<br />
OpenScript Transaction Failure<br />
Navigation Failure<br />
Slow Page<br />
Acquisition Failure<br />
When a retry is triggered, the entire script is replayed<br />
immediately. The status page displays a blue triangle icon<br />
with a plus sign (+) beside it indicating that a retry is<br />
happening.<br />
Save Diagnostic Data – lets you select the following options for<br />
collecting data.<br />
Save HTML from failing runs* – When selected, the HTML<br />
source from the last failure is saved for viewing. When you<br />
view the Status details for the Transaction Monitor, the Last<br />
Measured column includes a link icon ( ). Click the icon to<br />
open the retained HTML in the browser. Note that the<br />
retained HTML does not show page images.<br />
Save HTML from successful runs* – When selected, the HTML<br />
source from the last successful Script play back is saved for<br />
viewing. When you view the Status details for the<br />
Transaction Monitor, the Last Measured column includes a<br />
link icon ( ). Click the icon to open the retained HTML in<br />
the browser. Note that the retained HTML does not show<br />
page images.<br />
*The Save HTML from failing runs and Save HTML from<br />
successful runs options both work with the HTML from failing<br />
runs and HTML from successful runs option settings in the<br />
Chapter 5: Configuring Monitors 277
Configuring Oracle OpenScript Profile Monitors<br />
Database storage configuration. When a check box in this form<br />
is selected, the database will always save the HTML from the<br />
last failure/successful run—even beyond the time frame<br />
specified in the corresponding settings in the Database storage<br />
configuration. If there are multiple failures/successful runs, the<br />
HTML for runs prior to the last run is saved for as long as<br />
specified in the Database storage configuration settings.<br />
2. Click Import to import the OpenScript Script to use with this<br />
monitor.<br />
Script – Select the name of the Oracle OpenScript script you<br />
want to monitor or click the Browse button to locate it. The<br />
script file must be an Oracle OpenScript .zip file. This file<br />
contains all of the files necessary to run the script and can be<br />
located anywhere.<br />
3. Enter the script path or click Browse to locate the script.<br />
4. Click OK to import the script.<br />
5. Specify the properties to use for the transaction monitor:<br />
Specify the sampling interval.<br />
Specify the timeout value.<br />
Specify the number of retries.<br />
Select options for retaining HTML.<br />
6. To verify that the monitor will work as configured, click the<br />
Test button. The Monitor Test window provides information<br />
278 <strong>OneSight</strong> <strong>Administrator</strong> <strong>Guide</strong>
Configuring Oracle OpenScript Profile Monitors<br />
Exporting Scripts<br />
about the success or failure of the test and indicates what may<br />
be causing any problem.<br />
7. If the test succeeds, click OK. If you are reimporting a script,<br />
and page names or ordinals have changed, the Confirm History<br />
Deletion dialog box is displayed.<br />
8. Click OK to delete history for the pages that are no longer<br />
present. Click Cancel to revert to the original script.<br />
Click the Export button to Export Oracle OpenScript Scripts from<br />
the <strong>OneSight</strong> Database. This option is only available when you are<br />
modifying a monitor. To export a script:<br />
1. Click Export. The File Download dialog box is displayed.<br />
2. Click Save. The Save As dialog box is displayed.<br />
3. Select the folder in which to export the script.<br />
4. Click Save.<br />
Chapter 5: Configuring Monitors 279
Configuring Oracle OpenScript Profile Monitors<br />
Setting Command Line Options<br />
Use the Advanced tab to specify the parameters for running<br />
OpenScript scripts from the command line.<br />
Enter the parameters for running OpenScript from the command<br />
line in the following format:<br />
-parameter value<br />
For example, -http.proxyHost hostname<br />
Refer to the OpenScript User <strong>Guide</strong> for information about<br />
OpenScript parameters. Incorrectly entered parameters can cause an<br />
OpenScript failure. In addition, parameters that are used by<br />
<strong>OneSight</strong> to run the script or that can be configured on the General<br />
tab should not be entered here. <strong>OneSight</strong> will display a message<br />
requesting that they be removed from this dialog box.<br />
280 <strong>OneSight</strong> <strong>Administrator</strong> <strong>Guide</strong>
Configuring Oracle OpenScript Profile Monitors<br />
Specifying Proxy Settings<br />
Use the Proxy tab to specify proxy server settings.<br />
Proxy Server Settings – If your network makes use of a proxy server, you<br />
can specify this information here. Check Use a proxy server and add the<br />
information below.<br />
If you find that a <strong>OneSight</strong> OpenScript monitor fails to reach a URL<br />
when your browser successfully connects to the same URL, check your<br />
proxy server settings in your browser. For example, in Internet Explorer,<br />
select Internet Options from the Tools menu and then click LAN settings<br />
on the Connections tab. If proxy server settings are configured for your<br />
browser, they may also need to be configured for the monitor.<br />
Use a proxy server – When selected, <strong>OneSight</strong> uses the specified<br />
proxy server for this monitor.<br />
Chapter 5: Configuring Monitors 281
Configuring Oracle Test for Web Applications Monitors<br />
Host – The name or IP address of the proxy server.<br />
Port – The port of the proxy server.<br />
User Name – The proxy server login user name.<br />
Password – The proxy server login password.<br />
Configuring Oracle Test for Web Applications<br />
Monitors<br />
You can set up an Oracle Test for Web Applications monitor to<br />
replay your Visual Scripts previously recorded in Empirix e-Tester<br />
and saved as e-Manager Enterprise Package (.emePKG) files or<br />
Visual Scripts previously recording in OATS (Oracle Application<br />
Testing Suite) and saved as an OATS .otmpkg files.<br />
With e-Tester and OATS, you can record and test your entire<br />
application in minutes with reusable, object-oriented Visual Scripts.<br />
Recorded Visual Scripts automatically capture and test Anchors,<br />
Elements, Forms, Frames, HTML, Images, Image Maps, Links,<br />
ActiveX controls, Java Applets, VBScript, and JavaScript. Visual<br />
Scripts offer the fastest and easiest way to define tests for Web<br />
transactions.<br />
Note: The Oracle Test for Web applications monitor requires the<br />
installation of the <strong>OneSight</strong> Data Collector for Windows on the host<br />
machine running e-Tester or OATS. In addition, e-Tester or OATS<br />
must be installed on all data collector locations that are assigned to<br />
the monitor.<br />
At specified time intervals, the Oracle Test for Web Application<br />
monitor replays a Visual Script and measures the response time of<br />
the Visual Script. In the monitor configuration, you specify the host<br />
machine that contains your previously recorded Visual Scripts. The<br />
<strong>OneSight</strong> Data Collector for Windows must also be running on the<br />
specified host machine, since it is the data collector that manages<br />
282 <strong>OneSight</strong> <strong>Administrator</strong> <strong>Guide</strong>
Configuring Oracle Test for Web Applications Monitors<br />
the connection between the Visual Script playback engine and the<br />
<strong>OneSight</strong> server.<br />
In the Add Monitor dialog box, when you click Oracle Test for Web<br />
Applications in the Monitor Types box, settings to configure an<br />
Oracle Test for Web Applications monitor appear on these dialog<br />
box tabs:<br />
General Tab – Contains the options that you can use to create an<br />
Oracle Test for Web Applications monitor for your monitor group.<br />
Authentication Tab – Displays the authentication data that was<br />
imported from e-Tester or OATS when the script was imported. This<br />
information is used for web sites that require login via a popup<br />
dialog box. The authentication data automates the login process<br />
during script playback.<br />
Alerts Tab – Displays the options that you can use to define alerts<br />
and associate them with action plans. You can also configure how<br />
an Oracle Test for Web Applications alert will affect the monitor<br />
group’s health. It can result in a Warning state, a Critical state, or<br />
can have no impact on health.<br />
You can modify alerts for Oracle Test for Web Applications<br />
monitors by modify the Empirix e-TEST transaction profile or you<br />
can modify individual alerts for a specific monitor by clicking the<br />
Alert button on the Alerts tab.<br />
Locations Tab – Specifies the Data Collector Location to use as an<br />
Oracle Test for Web Applications monitor for your monitor group.<br />
Attributes Tab – Contains the options for specifying which attributes<br />
are applied to this monitor for Status page sorting.<br />
Monitor Groups Tab – Contains the options that you can use to<br />
specify which monitor groups the monitor is used with. This tab is<br />
available when you open the Add Monitor window by selecting<br />
Chapter 5: Configuring Monitors 283
Configuring Oracle Test for Web Applications Monitors<br />
Monitors from the Configure menu. It is not available when you<br />
open the Add Monitor window from the Monitor Group Editor.<br />
Access Control Tab – Contains the options for specifying which user<br />
groups have read, write, and delete permissions for this monitor.<br />
Down Time Tab – Contains the options for applying downtime to<br />
this monitor.<br />
Monitor Name – Each monitor that you create must have a unique<br />
name. In the Monitor Name box, <strong>OneSight</strong> creates a unique name<br />
for the current monitor by combining the name of the monitor type<br />
with the name of the host to which the monitor applies. To change<br />
the default assigned name, type a unique monitor name that helps<br />
you to identify what this monitor does.<br />
Profile – Lists the profiles that are available to apply to this monitor.<br />
Multiple profiles may be listed if you have upgraded from a<br />
previous version of <strong>OneSight</strong>.<br />
Modify – Displays the <strong>OneSight</strong> Profile Editor that lets you add and<br />
remove metrics, and configure alerts, smartlinks, and attributes for<br />
this profile.<br />
Note: When you modify alerts for Oracle Test for Web Applications<br />
Profile monitors, you must select Override profile in the Alert Editor<br />
to make the fields available. Any changes that you make will apply<br />
to this monitor only, not to the profile itself.<br />
If you are using a Visual Script that uses client certificates, the<br />
script may not play in <strong>OneSight</strong>. This occurs because the certificate<br />
is associated with the logged in user, therefore, the <strong>OneSight</strong> Data<br />
Collector service must also be associated with the user. To associate<br />
the Data collector service with the logged in user:<br />
1. Select Start Settings Control Panel Administrative Tools <br />
Services.<br />
284 <strong>OneSight</strong> <strong>Administrator</strong> <strong>Guide</strong>
Configuring Oracle Test for Web Applications Monitors<br />
2. Open the <strong>OneSight</strong> Data Collector service.<br />
3. Click the Logon tab.<br />
4. Select This account in the Log on as section.<br />
5. Enter the user name and password of the user associated with<br />
the certificate.<br />
6. Click OK.<br />
7. Restart the <strong>OneSight</strong> Data Collector service.<br />
To create an Oracle Test for Web Applications Monitor:<br />
1. Click Add in the Monitors Page. The Monitor Types box lists<br />
all of the types of monitors that can be applied to your monitor<br />
group. Click Oracle Test for Web Applications. You will use the<br />
settings on the General Tab to configure the Oracle Test for<br />
Web Applications Monitor.<br />
Chapter 5: Configuring Monitors 285
Configuring Oracle Test for Web Applications Monitors<br />
This dialog box has the following options:<br />
Visual Script – Displays the name of the script associated with<br />
this monitor and buttons to import, export, or view properties of<br />
the Visual Script associated with this monitor.<br />
Note: OATS version 8.4 or later no longer supports test<br />
scriptlets.<br />
Import – Opens a dialog box for selecting the Visual Script to<br />
import into the <strong>OneSight</strong> database. The imported file must be<br />
an e-Manager Enterprise Package (.emePKG) file or an<br />
OATS.otmpkg file and must be the same version of e-Tester or<br />
OATS as the version of the software on which it will be run.<br />
This file contains all of the files necessary to run the script<br />
and can be located anywhere.<br />
Export – Opens a dialog box for specifying the location<br />
where you want to export the Visual Script.<br />
Info – Displays the Script Import Information dialog box<br />
showing the name of the script as well as the date it was<br />
imported. When you have reimported a script, this dialog box<br />
also displays unmatched pages.<br />
Pages are matched when both the ordinal and name in the<br />
reimported script match those in the previously imported<br />
script. Pages can become unmatched when you add, insert,<br />
rename, or delete pages in the script in e-Tester or OATS.<br />
History is not available for unmatched scripts.<br />
For example, if the original script had the following pages:<br />
[1]Login<br />
[2]Welcome<br />
[3]Register<br />
And a second login page is added so that the new script has<br />
286 <strong>OneSight</strong> <strong>Administrator</strong> <strong>Guide</strong>
Configuring Oracle Test for Web Applications Monitors<br />
the following pages:<br />
[1]Login<br />
[2]LoginTwo<br />
[3]Welcome<br />
[4]Register<br />
The Welcome and Register pages have different ordinals so<br />
they are considered unmatched.<br />
Playback Settings – lets you configure the following options for<br />
determining how the script is played back.<br />
Browser Type – Specifies the type of browser control to use<br />
when running the Visual Script. Select one of the following:<br />
Thick – Thick Client mode. The virtual users run<br />
using full browser capabilities. This mode requires<br />
more resources and is less scalable than Thin Client,<br />
and should only be used in special cases. Reasons<br />
for using Thick client may include Web pages that<br />
require large amounts of client side processing.<br />
Thin – Thin Client mode. A less resource intensive<br />
method that provides a high level of Web<br />
compatibility and Visual Script verification. Thin<br />
Client mode consumes fewer system resources per<br />
process than Thick Client, and is able to run more<br />
virtual users on a given agent workstation.<br />
Java Agent – A highly scalable version of the Thin<br />
Client that executes the e-Tester script in native Java<br />
code. This agent provides a flexible code interface<br />
for performing customized scripting operations.<br />
Use WinInet – This option is only available for Thin agent. Runs<br />
the script using the Microsoft Win32 Internet (WinInet)<br />
application programming interface version of the Thin Client<br />
Agent.<br />
Chapter 5: Configuring Monitors 287
Configuring Oracle Test for Web Applications Monitors<br />
Use JHTTP – Runs the script using the Empirix version of the<br />
Thin Client agent (JHTTP).<br />
Use Databank – When selected, the Visual Script plays back<br />
using any Data Bank connected to the Visual Script. Data<br />
Banks are used to hold unlimited amounts of input data that<br />
can be automatically fed into your script. During Visual<br />
Script playback, the parameters in the Web page are filled<br />
with values from the Data Bank file.<br />
If you want to use the databank feature, select the Use<br />
Databank check box. When selected, the Visual Script plays<br />
back using a single data bank record. The record is<br />
determined by the record pointer of the Data Bank Wizard.<br />
The record increments after each iteration of the Visual<br />
Script.<br />
Download Images – When selected, images, scripts, and style<br />
sheets in the Web pages recorded to the Visual Script are<br />
downloaded during play back of the script. Downloading of<br />
these items affects the overall page response time. However,<br />
individual download times are not stored or shown as part of<br />
the monitor status or reporting data.<br />
Sample Every: – Specifies how often samples are<br />
taken for this monitor. Sample frequency for Oracle Test for<br />
Web Applications monitors apply to the entire transaction,<br />
that is, you cannot run one page at a different sample<br />
frequency than another. This means that alerts should be<br />
configured at the script level. Refer to, ―Sample Every<br />
Settings,‖ later in this chapter for a description of these<br />
settings.<br />
Timeout Every – Specifies how long the <strong>OneSight</strong><br />
agent should wait for the e-TEST or OATS agent to indicate<br />
that playback has finished before timing out. Select the unit<br />
of time: seconds, minutes, or hours. The value for timeout<br />
should not be null or a decimal value.<br />
288 <strong>OneSight</strong> <strong>Administrator</strong> <strong>Guide</strong>
Configuring Oracle Test for Web Applications Monitors<br />
Retries – Specifies the number of times to retry running the<br />
Visual Script before triggering a response plan or reporting a<br />
failure on the status page. Retries are triggered by the Oracle<br />
Test for Web Applications alerts that affect the monitor<br />
availability. The alerts that affect availability are:<br />
Sample Failure<br />
Navigation Failure<br />
Page Timeout<br />
Failure<br />
When a retry is triggered, the entire script is replayed<br />
immediately. The status page displays a blue triangle icon<br />
with a plus sign (+) beside it indicating that a retry is<br />
happening.<br />
Save Diagnostic Data – lets you select the following options for<br />
collecting data.<br />
Save object download details – When selected, componentlevel<br />
metrics are collected for individual objects on a page<br />
and the Object Timer report is enabled.<br />
Save HTML from failing runs* – When selected, the HTML<br />
source from the last failure is saved for viewing. When you<br />
view the Status details for the Transaction Monitor, the Last<br />
Measured column includes a link icon ( ). Click the icon to<br />
open the retained HTML in the browser. Note that the<br />
retained HTML does not show page images.<br />
Save HTML from successful runs* – When selected, the HTML<br />
source from the last successful Visual Script play back is<br />
saved for viewing. When you view the Status details for the<br />
Transaction Monitor, the Last Measured column includes a<br />
link icon ( ). Click the icon to open the retained HTML in<br />
the browser. Note that the retained HTML does not show<br />
page images.<br />
*The Save HTML from failing runs and Save HTML from<br />
successful runs options both work with the HTML from failing<br />
Chapter 5: Configuring Monitors 289
Configuring Oracle Test for Web Applications Monitors<br />
runs and HTML from successful runs option settings in the<br />
Database storage configuration. When a check box in this form<br />
is selected, the database will always save the HTML from the<br />
last failure/successful run—even beyond the time frame<br />
specified in the corresponding settings in the Database storage<br />
configuration. If there are multiple failures/successful runs, the<br />
HTML for runs prior to the last run is saved for as long as<br />
specified in the Database storage configuration settings.<br />
2. Click Import to import the Visual Script to use with this<br />
monitor.<br />
Script – Select the name of the script you want to monitor or<br />
click the Browse button to locate it. The script file must be an<br />
e-Manager Enterprise Package (.emePKG) file or an OATS<br />
.otmpkg file. This file contains all of the files necessary to run<br />
the script and can be located anywhere.<br />
3. Enter the script path or click Browse to locate the script.<br />
4. Click OK to import the Visual Script and its authentication data<br />
into the <strong>OneSight</strong> database.<br />
5. Specify the properties to use for the transaction monitor:<br />
Specify the number of retries.<br />
Specify the sampling interval.<br />
290 <strong>OneSight</strong> <strong>Administrator</strong> <strong>Guide</strong>
Configuring Oracle Test for Web Applications Monitors<br />
Exporting Scripts<br />
Specify the timeout value. The value for timeout should not<br />
be null or a decimal value.<br />
Specify the browser type.<br />
Select other playback options for databanks, download<br />
images, save object details, and retain HTML.<br />
6. To verify that the monitor will work as configured, click the<br />
Test button. The Monitor Test window provides information<br />
about the success or failure of the test and indicates what may<br />
be causing any problem.<br />
7. If the test succeeds, click OK. If you are reimporting a script,<br />
and page names or ordinals have changed, the Confirm History<br />
Deletion dialog box is displayed.<br />
8. Click OK to delete history for the pages that are no longer<br />
present. Click Cancel to revert to the original script.<br />
9. Specify the alert options for the dedicated transaction monitor:<br />
Set up an action plan to notify you if the transaction fails.<br />
Set up a threshold-based alert.<br />
Click the Export button to Export Visual Scripts from the <strong>OneSight</strong><br />
Database. To export a script:<br />
1. Click Export. The File Download dialog box is displayed.<br />
2. Click Save. The Save As dialog box is displayed.<br />
3. Select the folder in which to export the script.<br />
4. Click Save.<br />
Chapter 5: Configuring Monitors 291
Configuring Oracle Test for Web Applications Monitors<br />
Specifying Authentication Data<br />
Authentication data for web sites that use popup login dialog boxes<br />
is imported when you import Visual Scripts. <strong>OneSight</strong> imports the<br />
entire set of authentication information, which is shared by all<br />
scripts in e-TEST or OATS. You can remove realms that are not<br />
accessed by an individual transaction; however, it is not necessary.<br />
Use the options on the Authentication tab to modify login data for<br />
individual transactions.<br />
Note: To modify password information for all transactions that use a<br />
given realm/username combination, use the Configure Password<br />
page.<br />
Realm – Displays the full Uniform Resource Locator (URL) for the<br />
Web application that requires a user name and password.<br />
Username – Displays the username for corresponding URL.<br />
292 <strong>OneSight</strong> <strong>Administrator</strong> <strong>Guide</strong>
Configuring Perfmon Monitors<br />
Add – Displays the Add Realm dialog box for adding a realm.<br />
Modify – Displays a dialog box for modifying the selected realm.<br />
Remove – Deletes the selected realm.<br />
Configuring Perfmon Monitors<br />
Note: <strong>OneSight</strong> also includes profile monitors for Windows. This<br />
profile-based monitor uses a set of preselected metrics and allow<br />
you to apply the same settings to multiple machines.<br />
A Perfmon monitor checks on the performance of a specific<br />
Perfmon metric on a single machine. The monitor must have<br />
appropriate privileges to access the Perfmon statistics on the<br />
monitored machine.<br />
Note: The Perfmon monitor requires a Data Collector or Remote<br />
Agent that is version 5.1 or higher to discover metrics.<br />
Monitoring Multiple Processes With the Same Name<br />
Processes with the same name cannot be distinguished from one<br />
another in the Instance dropdown. For <strong>OneSight</strong> PerfMon to<br />
distinguish processes with multiple instances the following registry<br />
change must be made:<br />
1. Click Run from the Start menu.<br />
2. Enter regedit and click OK.<br />
3. Locate and then click the following registry subkey:<br />
HKEY_LOCAL_MACHINE\SYSTEM\CurrentControlSet\Services\PerfP<br />
roc\Performance<br />
4. On the Edit menu click New, and then click DWORD Value.<br />
Chapter 5: Configuring Monitors 293
Configuring Perfmon Monitors<br />
5. Right-click New Value #1, click Rename, and then type<br />
ProcessNameFormat to name the new value.<br />
6. Right-click ProcessNameFormat, and then click Modify.<br />
7. In the Data value box, enter 2 (which Enables PID data) and<br />
click OK.<br />
8. Exit the Registry Editor.<br />
Creating the Monitor<br />
Warning: Serious problems can occur if you modify the registry<br />
incorrectly. These problems might require the operating system<br />
to be reinstalled. Modify the registry at your own risk.<br />
9. Restart the <strong>OneSight</strong> service.<br />
In the Add Monitor dialog box, when you click Perfmon in the<br />
Monitor Types box, settings to configure a Perfmon monitor appear<br />
on these dialog box tabs:<br />
System Tab – Contains the options that you can use to define the<br />
system identification and authentication settings for a Perfmon<br />
monitor for your monitor group.<br />
Object Tab – Specifies the object configuration for a specific<br />
Perfmon Metric.<br />
Alerts Tab – Displays the options that you can use to define alerts<br />
and associate them with action plans. You can also configure how a<br />
Perfmon alert will affect the monitor group’s health. It can result in<br />
a Warning state, a Critical state, or can have no impact on health.<br />
Locations Tab – Specifies the Data Collector Location from which<br />
the Perfmon monitor checks a specific metric.<br />
294 <strong>OneSight</strong> <strong>Administrator</strong> <strong>Guide</strong>
Configuring Perfmon Monitors<br />
SmartLinks Tab – Contains the options for specifying a link to<br />
associate with a particular monitor or metric.<br />
Attributes Tab – Contains the options for specifying which attributes<br />
are applied to this monitor for Status page sorting.<br />
Monitor Groups Tab – Contains the options that you can use to<br />
specify which monitor groups the monitor is used with. This tab is<br />
available when you open the Add Monitor window by selecting<br />
Monitors from the Configure menu. It is not available when you<br />
open the Add Monitor window from the Monitor Group Editor.<br />
Access Control Tab – Contains the options for specifying which user<br />
groups have read, write, and delete permissions for this monitor.<br />
Down Time Tab – Contains the options for applying downtime to<br />
this monitor.<br />
Each monitor that you create must have a unique name. In the<br />
Monitor Name box, <strong>OneSight</strong> creates a unique name for the current<br />
monitor by combining the name of the monitor type with the name<br />
of the host and the Perfmon metric. To change the default assigned<br />
name, type a unique monitor name that helps you to identify what<br />
this monitor does.<br />
To create a Perfmon monitor:<br />
1. On the Monitors Page, click Add to open the Add Monitor<br />
dialog box.<br />
Chapter 5: Configuring Monitors 295
Configuring Perfmon Monitors<br />
2. The Monitor Types box lists all of the types of monitors that<br />
can be applied to your monitor group. Click Perfmon to add a<br />
monitor that will measure the performance of a specific<br />
Perfmon metric on a single machine.<br />
Use the options on this tab to specify the Windows machine to<br />
be monitored.<br />
Import/Export – Click this button to display the Import Export<br />
Monitors dialog box for importing or exporting monitors of this<br />
type. Refer to ―Exporting and Importing Monitors,‖ later in this<br />
chapter for more information.<br />
System Identification – Configure these settings to specify the<br />
Windows machine that will report the Perfmon metric.<br />
DNS Name – Specifies the DNS name of the computer.<br />
NetBIOS name – Specifies the NetBIOS name, or Windows<br />
computer name, for this machine.<br />
296 <strong>OneSight</strong> <strong>Administrator</strong> <strong>Guide</strong>
Configuring Perfmon Monitors<br />
Authentication – Configure these settings when a <strong>OneSight</strong> Data<br />
Collector or Remote Agent is not running on the system being<br />
monitored. If you are monitoring a remote system that is<br />
running Windows Server 2003 or newer addition, and that does<br />
not have a Data Collector or Remote Agent running on it, you<br />
must use the same user name and password for all monitors on<br />
a given system. Otherwise, your monitor may fail to connect to<br />
the <strong>OneSight</strong> Server.<br />
User Name – Specifies the logon name that will provide<br />
access to the monitored machine. The user name and<br />
password that you specify must have administrative<br />
privileges on the monitored machine.<br />
Domain – Specifies the domain or machine name of the user<br />
name account.<br />
Password – Specifies the password associated with the user<br />
name you supply. The user name and password that you<br />
specify must have administrative privileges on the monitored<br />
machine.<br />
Test – When you add or modify a monitor, you can test System<br />
settings to determine if they are set appropriately. After clicking<br />
the Test button, you will see messages in the status window as<br />
the test runs and when the test completes.<br />
3. Each monitor that you add must have a unique name. You can<br />
let <strong>OneSight</strong> create a unique name using the Perfmon<br />
specifications you supply, or you can type in your own name<br />
for the monitor.<br />
Chapter 5: Configuring Monitors 297
Configuring Perfmon Monitors<br />
4. On the System tab, type in the DNS name, NetBIOS name, user<br />
name, password, and domain of the machine you want to<br />
monitor. If you have a <strong>OneSight</strong> Data Collector or Remote<br />
Agent installed on the machine you want to monitor, the<br />
authentication information (Username, Password, and Domain)<br />
is not required. Click the Object tab.<br />
Use the options on this tab to specify the Perfmon metric to be<br />
monitored.<br />
Use these settings to designate which Perfmon metric you want<br />
to check. To complete this information, click Discover Perfmon<br />
Metrics to find available metrics and populate the Object,<br />
Counter, and Instance dropdown lists.<br />
Note: Occasionally the Data Collector will not be able to<br />
discover all metrics on the local machine on which it is<br />
298 <strong>OneSight</strong> <strong>Administrator</strong> <strong>Guide</strong>
Configuring Perfmon Monitors<br />
installed. This is because the data collector runs as the local<br />
system account and some counters cannot be collected unless<br />
the Data Collector is set up to run as either the same user or a<br />
user with administrative rights.<br />
You can also run Perfmon on the machine you plan to monitor.<br />
To review individual metrics, select Add Counters from the<br />
right-click shortcut menu in Perfmon.<br />
Note: Although the Perfmon application on your local machine<br />
can provide some guidance, Perfmon metrics can differ among<br />
various Windows versions, and Perfmon metrics for specific<br />
applications such as IIS may not be present on your local<br />
machine.<br />
Note: Even if you add the.NET CLR Data object SqlClient<br />
counters will not be collected because this object is not<br />
supported by Perfmon itself on Windows servers.<br />
Object – Specifies the Perfmon Object name (for example,<br />
Processor or Memory). Select or enter the object name. You<br />
must enter the object name exactly as it is displayed in the<br />
Perfmon editor. Be careful to check for spaces and case in the<br />
Object name.<br />
Counter – Specifies the Perfmon Counter name (for example, %<br />
Processor Time). Select or enter the counter name. You must<br />
enter the counter name exactly as it is displayed in the Perfmon<br />
editor. Be careful to check for spaces and case in the Counter<br />
name.<br />
Instance – If the Perfmon metric has an instance associated with<br />
it, specify or select it here. For example, if you see 0 as the<br />
instance in the Perfmon metric, type in 0 as the value. If no<br />
instance is listed, leave this blank.<br />
Note: LogicalDisk objects may include instances such as 0 =><br />
C: that reflect a distinction between logical and physical disks.<br />
In this case, specify C: as the instance.<br />
Chapter 5: Configuring Monitors 299
Configuring Perfmon Monitors<br />
Scale – Specifies any custom scaling to be applied to the<br />
Perfmon metric when reported within <strong>OneSight</strong>. Typically, the<br />
default 1.0 scale is appropriate.<br />
Translation Type – Translation Type controls how a metric’s<br />
data is displayed on the Alerts page and in Reports.<br />
No Translation – <strong>OneSight</strong> will present the data as it is<br />
provided by the metric’s data source.<br />
Rate (minutes) – <strong>OneSight</strong> will present the data as a number,<br />
per minute. For example, if the time interval between two<br />
samples was 10 minutes, and 50 errors were found, the Rate<br />
(minutes) would be five (5) errors per minute.<br />
Note: Rate (minutes) translates data sources that return their<br />
values as an endlessly increasing counter. If the data source<br />
does not return data this way, use No Translation.<br />
Unit Measure – Select which unit of measurement should be<br />
associated with this metric and displayed in <strong>OneSight</strong> Alerts<br />
and Reports.<br />
% (percent) – As a percentage<br />
bytes – this data will be expressed in bytes<br />
hours – this data will be expressed in hours<br />
minutes – this data will be expressed in minutes<br />
seconds – this data will be expressed in seconds<br />
– this data will be expressed with no unit of<br />
measurement<br />
Sample Every: – Specifies how often samples are<br />
taken for this monitor. Refer to, ―Sample Every Settings,‖ later<br />
in this chapter for a description of these settings.<br />
300 <strong>OneSight</strong> <strong>Administrator</strong> <strong>Guide</strong>
Configuring Perfmon Monitors<br />
Retries – Sets the upper limit for the number of times a Perfmon<br />
request is retried. For example, if Retries is set to 3, the<br />
Perfmon request will be sent up to four times (the initial try<br />
plus three retries).<br />
Time Out – Specifies the amount of time (in seconds) to wait for<br />
a Perfmon reply. If Retries is greater than 0 and a reply is not<br />
received, a retry attempt is made. For each subsequent retry, the<br />
timeout value is doubled. For example, if Time Out is 5 and<br />
Retries is 2, the first request attempt will occur after 5 seconds,<br />
the second attempt will occur after 10 seconds, and the third<br />
attempt will occur after 20 seconds. In this example, the total<br />
timeout period equals 35 seconds. If there is no response after<br />
this time, a Sample Failure is triggered.<br />
If Retries is 0, a Sample Failure is triggered when a reply is not<br />
received in this amount of time.<br />
Discover Perfmon Metrics – Finds the available metrics and<br />
populates the Object, Counter, and Instance dropdown lists so that<br />
you can select the metric you want to monitor.<br />
5. On the Object tab, use the settings to designate which Perfmon<br />
metric you want to check. To complete this information, click<br />
Discover Perfmon Metrics to find available metrics and populate<br />
the Object, Counter, and Instance dropdown lists. Or run Perfmon<br />
on the machine you plan to monitor. To review individual<br />
metrics, select Add to Chart from the Edit menu in Perfmon.<br />
Note: Although the Perfmon application on your local machine<br />
can provide some guidance, Perfmon metrics can differ for<br />
Windows 2000 and 2003 machines, and Perfmon metrics for<br />
specific applications such as IIS may not be present on your<br />
local machine.<br />
6. On the Object tab, select or type in the Perfmon Object,<br />
Counter, and Instance name.<br />
Chapter 5: Configuring Monitors 301
Configuring Ping Monitors<br />
7. On the Object tab, modify the metric translation type and<br />
sampling parameters as needed. For more information on these<br />
parameters, see the System Tab description.<br />
8. To verify that the monitor will work as configured, click the<br />
Test button. The Monitor Test window provides information<br />
about the success or failure of the test and indicates what may<br />
be causing any problem.<br />
9. If the test succeeds, click OK in the Add Monitor dialog box to<br />
save these basic Perfmon monitor settings. You can now add<br />
this monitor to a monitor group. Refer to Adding Monitors to a<br />
Monitor Group in Chapter 4.<br />
Configuring Ping Monitors<br />
You can set up Ping monitors to determine if hosts used by your<br />
monitor group are functioning. Ping is an easy way to confirm that a<br />
host is responding. The Ping monitor sends a Ping request at<br />
specified time intervals to confirm whether a particular host is<br />
operational.<br />
At specified time intervals, the Ping monitor sends an echo request<br />
to a specified host and waits for a reply. The monitor returns the<br />
round trip time or sets an alert if the request times out or exceeds a<br />
threshold.<br />
In the Add Monitor dialog box, when you click Ping in the Monitor<br />
Types box, settings to configure a Ping monitor appear on these<br />
dialog box tabs:<br />
General Tab – Contains the options that you can use to create a Ping<br />
monitor for your monitor group.<br />
Alerts Tab – Displays the options that you can use to define alerts<br />
and associate them with action plans. You can also configure how a<br />
Ping alert will affect the monitor group’s health. It can result in a<br />
Warning state, a Critical state, or can have no impact on health.<br />
302 <strong>OneSight</strong> <strong>Administrator</strong> <strong>Guide</strong>
Configuring Ping Monitors<br />
Locations Tab – Specifies the Data Collector Location from which<br />
the Ping monitor checks the availability of a specific host.<br />
SmartLinks Tab – Contains the options for specifying a link to<br />
associate with a particular monitor or metric.<br />
Attributes Tab – Contains the options for specifying which attributes<br />
are applied to this monitor for Status page sorting.<br />
Monitor Groups Tab – Contains the options that you can use to<br />
specify which monitor groups the monitor is used with. This tab is<br />
available when you open the Add Monitor window by selecting<br />
Monitors from the Configure menu. It is not available when you<br />
open the Add Monitor window from the Monitor Group Editor.<br />
Access Control Tab – Contains the options for specifying which user<br />
groups have read, write, and delete permissions for this monitor.<br />
Down Time Tab – Contains the options for applying downtime to<br />
this monitor.<br />
Each monitor that you create must have a unique name. In the<br />
Monitor Name box, <strong>OneSight</strong> creates a unique name for the current<br />
monitor by combining the name of the monitor type with the name<br />
of the host to which the monitor applies. To change the default<br />
assigned name, type a unique monitor name that helps you to<br />
identify what this monitor does.<br />
To create a Ping monitor:<br />
1. On the Monitors Page, click Add to open the Add Monitor<br />
dialog box.<br />
Chapter 5: Configuring Monitors 303
Configuring Ping Monitors<br />
2. The Monitor Types box lists all of the types of monitors that<br />
can be applied to your monitor group. Click Ping to add a<br />
monitor that confirms that a host is responding. Use settings on<br />
the General tab to configure each Ping monitor.<br />
Use the options on this tab to specify how the Ping monitor will<br />
make Ping attempts.<br />
Import/Export – Click this button to display the Import Export<br />
Monitors dialog box for importing or exporting monitors of this<br />
type. Refer to ―Exporting and Importing Monitors,‖ later in this<br />
chapter for more information.<br />
Host Name – Specifies the name or IP address of the host to<br />
ping.<br />
Metric – Specifies the metric to use for the Ping monitor. Select<br />
the metric to use: Average Round Trip Time or Percentage of<br />
Success.<br />
304 <strong>OneSight</strong> <strong>Administrator</strong> <strong>Guide</strong>
Configuring Ping Monitors<br />
Length – Enter the number of bytes that should be included in<br />
each echo request packet.<br />
Time to Live – Specify the maximum number of router hops<br />
permitted. If the echo request takes more than the maximum<br />
number of hops, it is thrown away and the Ping attempt is<br />
treated as a failure.<br />
Timeout (sec) – Specifies the number of seconds to wait for an<br />
echo reply. The value must be between 1 and 30, inclusive. If<br />
an echo reply is not received in this amount of time, the Ping<br />
echo request is retried.<br />
# of Packets – Specifies how many packets should be included<br />
in Ping echo requests. This can be used with the Percentage of<br />
Success metric to specify a threshold.<br />
On Failure – Indicates whether to include additional information<br />
in an alert when the monitor fails.<br />
Include Traceroute in alert – Includes a trace route in the alert.<br />
Include Ping in alert – Includes the results of a ping in the<br />
alert. This option is faster than including the trace route in<br />
the alert.<br />
Do Nothing – Does not include any additional information in<br />
the alert.<br />
Sample Every: – Specifies how often samples are<br />
taken for this monitor. Refer to, ―Sample Every Settings,‖ later<br />
in this chapter for a description of these settings.<br />
Test – When you add or modify a monitor, you can test General<br />
settings to determine if they are set appropriately. After clicking<br />
the Test button, you will see messages in the status window as<br />
the test runs and when the test completes.<br />
Chapter 5: Configuring Monitors 305
Configuring Port Monitors<br />
3. Each monitor that you add must have a unique name. You can<br />
let <strong>OneSight</strong> create a unique name using the Ping specifications<br />
you supply, or you can type in your own name for the monitor.<br />
4. On the General tab, type in the host name for the server you<br />
want to monitor. This value specifies the name or IP address of<br />
the host to ping.<br />
5. All the other settings in the Ping monitor have defaults that will<br />
allow you to start using a Ping monitor. You can change<br />
defaults for any of the other settings.<br />
6. To verify that the monitor will work as configured, click the<br />
Test button. The Monitor Test window provides information<br />
about the success or failure of the test and indicates what may<br />
be causing any problem.<br />
7. If the test succeeds, click OK in the Add Monitor dialog box to<br />
save these basic Ping monitor settings. You can now add this<br />
monitor to a monitor group. Refer to Adding Monitors to a<br />
Monitor Group in Chapter 4.<br />
Configuring Port Monitors<br />
A Port monitor checks on the availability of a specified network<br />
port. While checking network port availability, the port monitor can<br />
also check the value returned from a query to ensure that an<br />
application is available and running correctly. If a port does not<br />
reply, or if the reply is incorrect (as determined by a text match), an<br />
alert is triggered. The Port monitor can be used to monitor network<br />
applications that are not available as part of other <strong>OneSight</strong><br />
monitors.<br />
The monitor must have appropriate privileges to access the<br />
specified port on the monitored machine.<br />
306 <strong>OneSight</strong> <strong>Administrator</strong> <strong>Guide</strong>
Configuring Port Monitors<br />
In the Add Monitor dialog box, when you click Port in the Monitor<br />
Types box, settings to configure a Port monitor appear on these<br />
dialog box tabs:<br />
General Tab – Contains the options that you can use to create a Port<br />
monitor for your monitor group.<br />
Advanced Tab – Contains the options that you can use to specify<br />
what string should be returned from your query.<br />
Alerts Tab – Displays the options that you can use to define alerts<br />
and associate them with action plans. You can also configure how a<br />
Port alert will affect the monitor group’s health. It can result in a<br />
Warning state, a Critical state, or can have no impact on health.<br />
Note: This monitor detects and reports on any availability problem<br />
encountered. You may want to use the Trigger Response if <br />
Samples Out of Samples Failed setting to control the frequency<br />
of alerts for this monitor. As a comparison, a busy port will still be<br />
considered available if an SMTP client (such as an e-mail client or<br />
delivery server) successfully retries the port, while the Port monitor<br />
will trigger an alert regardless of the success of a retry attempt.<br />
Locations Tab – Specifies the Data Collector Location from which<br />
the Port monitor queries a specific port.<br />
SmartLinks Tab – Contains the options for specifying a link to<br />
associate with a particular monitor or metric.<br />
Attributes Tab – Contains the options for specifying which attributes<br />
are applied to this monitor for Status page sorting.<br />
Monitor Groups Tab – Contains the options that you can use to<br />
specify which monitor groups the monitor is used with. This tab is<br />
available when you open the Add Monitor window by selecting<br />
Monitors from the Configure menu. It is not available when you<br />
open the Add Monitor window from the Monitor Group Editor.<br />
Chapter 5: Configuring Monitors 307
Configuring Port Monitors<br />
Access Control Tab – Contains the options for specifying which user<br />
groups have read, write, and delete permissions for this monitor.<br />
Down Time Tab – Contains the options for applying downtime to<br />
this monitor.<br />
Each monitor that you create must have a unique name. In the<br />
Monitor Name box, <strong>OneSight</strong> creates a unique name for the current<br />
monitor by combining the name of the monitor type with the name<br />
of the host and the port. To change the default assigned name, type<br />
a unique monitor name that helps you to identify what this monitor<br />
does.<br />
To create a Port monitor:<br />
1. On the Monitors Page, click Add o open the Add Monitor dialog<br />
box.<br />
308 <strong>OneSight</strong> <strong>Administrator</strong> <strong>Guide</strong>
Configuring Port Monitors<br />
2. The Monitor Types box lists all of the types of monitors that<br />
can be applied to your monitor group. Click Port to add a<br />
monitor that confirms that a port on a host is responding. Use<br />
settings on the General tab to configure each Port monitor.<br />
Use the options on this tab to specify the host name and port to<br />
be monitored.<br />
Import/Export – Click this button to display the Import Export<br />
Monitors dialog box for importing or exporting monitors of this<br />
type. Refer to ―Exporting and Importing Monitors,‖ later in this<br />
chapter for more information.<br />
Host Address – Specifies the name or IP address of the host.<br />
Port – Specifies the port you want to monitor. Click the arrow<br />
to select from a variety of common ports. If the port you want to<br />
monitor is not listed, select Other and type in the port number.<br />
Timeout Seconds – Specifies the number of seconds to wait<br />
for a reply.<br />
Chapter 5: Configuring Monitors 309
Configuring Port Monitors<br />
On Failure – Indicates whether to include additional information<br />
in an alert when the monitor fails.<br />
Include Traceroute in alert – Includes a trace route in the alert.<br />
Include Ping in alert – Includes the results of a ping in the<br />
alert. This option is faster than including the trace route in<br />
the alert.<br />
Do Nothing – Does not include any additional information in<br />
the alert.<br />
Sample Every: – Specifies how often samples are<br />
taken for this monitor. Refer to, ―Sample Every Settings,‖ later<br />
in this chapter for a description of these settings.<br />
Test – When you add or modify a monitor, you can test General<br />
settings to determine if they are set appropriately. After clicking<br />
the Test button, you will see messages in the status window as<br />
the test runs and when the test completes.<br />
3. Each monitor that you add must have a unique name. You can<br />
let <strong>OneSight</strong> create a unique name using the Port specifications<br />
you supply, or you can type in your own name for the monitor.<br />
4. On the General tab, type in the host name or IP address of the<br />
server you want to monitor.<br />
5. Select the port that you want to monitor. For example, the<br />
standard FTP port, 21, allows you to confirm that an FTP<br />
connection is available. If you don’t see the port you want, click<br />
Other and type in the port number.<br />
6. If you want additional information you can also configure a<br />
string to be sent and a string to be returned from a sample. Click<br />
the Advanced tab and type the string to be sent to the port (Send<br />
String) and the string that should be returned (Match String). In<br />
the following example, the username and password ―test1‖<br />
310 <strong>OneSight</strong> <strong>Administrator</strong> <strong>Guide</strong>
Configuring Port Monitors<br />
should return a specific string indicating that the user is now<br />
logged in:<br />
Send String: test1\0x0a\0x0dtest1<br />
Match String: 230 User test1 logged in.<br />
If the string you specify is not found, the monitor status will<br />
change on the <strong>OneSight</strong> Console. You can also add an action,<br />
such as an e-mail, to send an alert if a port is not responding or<br />
if the string you specified is not found.<br />
7. To verify that the monitor will work as configured, click the<br />
Test button. The Monitor Test window provides information<br />
about the success or failure of the test and indicates what may<br />
be causing any problem.<br />
8. If the test succeeds, click OK in the Add Monitor dialog box to<br />
save these basic Port monitor settings. You can now add this<br />
monitor to a monitor group. Refer to Adding Monitors to a<br />
Monitor Group in Chapter 4.<br />
Chapter 5: Configuring Monitors 311
Configuring Port Monitors<br />
Setting Advanced Options<br />
Use the options on this tab to specify the string to use when<br />
querying the port and the expected response.<br />
Send String – Specifies the query to be sent to the port.<br />
By default, a linefeed character (\n or \0x0a) is appended to the<br />
string you specify. If you want to use an alternate control<br />
character, simply append the character(s) you prefer. If you do<br />
not want any control character appended, add the null character<br />
(\0x00) to the end of the string. If you add any control character,<br />
the linefeed character will not be added by default and you will<br />
have to add it manually. For example, ―hello\r\n‖ would be<br />
―hello\0x0d\0x0a‖.<br />
To include a pause of 500 ms, add ―\p‖ to the send string.<br />
312 <strong>OneSight</strong> <strong>Administrator</strong> <strong>Guide</strong>
Configuring Process Monitors<br />
Match String – Specifies the string that should be returned. If<br />
you specify this string, you can trigger an alert and an action<br />
plan when the string is not returned. String matching is case<br />
sensitive.<br />
Maximum Read Length – Specifies maximum length of the string<br />
to be read from the port when searching for the text specified in<br />
the Match String box.<br />
Test – When you add or modify a monitor, you can test General<br />
settings to determine if they are set appropriately. After clicking<br />
the Test button, you will see messages in the status window as<br />
the test runs and when the test completes.<br />
Configuring Process Monitors<br />
You can set up Process monitors to verify that important processes<br />
are running. At specified time intervals, the Process monitor checks<br />
specified system processes for the specified value. The monitor<br />
returns the value or sets an alert if the request times out or exceeds<br />
a threshold.<br />
Note: A Data Collector or Remote Agent must be installed on the<br />
machine on which the process will be monitored.<br />
In the Add Monitor dialog box, when you click Process in the<br />
Monitor Types box, settings to configure a Process monitor appear<br />
on these dialog box tabs:<br />
General Tab – Contains the options that you can use to create a<br />
Process monitor for your monitor group.<br />
Alerts Tab – Displays the options that you can use to define alerts<br />
and associate them with action plans. You can also configure how a<br />
Process alert will affect the monitor group’s health. It can result in a<br />
Warning state, a Critical state, or can have no impact on health.<br />
Chapter 5: Configuring Monitors 313
Configuring Process Monitors<br />
SmartLinks Tab – Contains the options for specifying a link to<br />
associate with a particular monitor or metric.<br />
Attributes Tab – Contains the options for specifying which attributes<br />
are applied to this monitor for Status page sorting.<br />
Monitor Groups Tab – Contains the options that you can use to<br />
specify which monitor groups the monitor is used with. This tab is<br />
available when you open the Add Monitor window by selecting<br />
Monitors from the Configure menu. It is not available when you<br />
open the Add Monitor window from the Monitor Group Editor.<br />
Access Control Tab – Contains the options for specifying which user<br />
groups have read, write, and delete permissions for this monitor.<br />
Down Time Tab – Contains the options for applying downtime to<br />
this monitor.<br />
Each monitor that you create must have a unique name. In the<br />
Monitor Name box, <strong>OneSight</strong> creates a unique name for the current<br />
monitor by combining the name of the monitor type with the name<br />
of the host to which the monitor applies. To change the default<br />
assigned name, type a unique monitor name that helps you to<br />
identify what this monitor does.<br />
To create a Process monitor:<br />
1. On the Monitors Page, click Add to open the Add Monitor<br />
dialog box.<br />
314 <strong>OneSight</strong> <strong>Administrator</strong> <strong>Guide</strong>
Configuring Process Monitors<br />
2. The Monitor Types box lists all of the types of monitors that<br />
can be applied to your monitor group. Click Process to add a<br />
monitor that confirms that a process on a host is within the<br />
specified measurement. Use settings on the General tab to<br />
configure each Process monitor.<br />
Use the options on this tab to specify the host name and process<br />
to be monitored. The process may be specified by process name<br />
(e.g. httpd) or by process name and commandline string (e.g.<br />
httpd (./lib/httpd -f)). The agent monitors one of three attributes<br />
(count, memory usage, and CPU usage) for all processes with the<br />
given name or commandline.<br />
Import/Export – Click this button to display the Import Export<br />
Monitors dialog box for importing or exporting monitors of this<br />
type. Refer to ―Exporting and Importing Monitors,‖ later in this<br />
chapter for more information.<br />
DNS Name – Specifies the name or IP address of the host.<br />
Chapter 5: Configuring Monitors 315
Configuring Process Monitors<br />
Discover Processes – Click Discover Processes to load all the<br />
names of processes running on the host machine. The list will<br />
show most processes twice, once using the generic process<br />
name and once using the name and the commandline string.<br />
Each entry in the list, however, is unique.<br />
Process – Specifies the name of the process you want to<br />
monitor. Click the arrow to select from all of the running<br />
processes loaded using the Discover Processes button. If the<br />
process you want to monitor is not listed, enter the name in the<br />
text field.<br />
Measurement – Specifies the process measurement you want to<br />
monitor. Click the arrow to select either count (number of<br />
instances), memory usage (in MB), or CPU usage (in percent).<br />
Method of Aggregation – Specifies the method of aggregation to<br />
use for monitoring memory or CPU usage. Click the arrow to<br />
select a method, either Total, Minimum, or Maximum.<br />
It is common for an application to run multiple processes with<br />
the same name or even the same commandline. Method of<br />
Aggregation indicates how to aggregate data about multiple<br />
processes.<br />
Total – specifies that the monitor should add the<br />
measurements from all such processes, for example,<br />
returning the total memory used by processes named ―httpd‖.<br />
Minimum – specifies the smallest measurement for all such<br />
processes, returning, for example, the least CPU usage for all<br />
such processes.<br />
Maximum – specifies the largest measurement for all such<br />
processes, which would help determine, for example, if a<br />
single httpd process is using most of the CPU.<br />
Send sample failure if zero processes found – Sends a sample<br />
failure if no processes are found.<br />
316 <strong>OneSight</strong> <strong>Administrator</strong> <strong>Guide</strong>
Configuring Process Monitors<br />
Sample Every: – Specifies how often samples are<br />
taken for this monitor. Refer to, ―Sample Every Settings,‖ later<br />
in this chapter for a description of these settings.<br />
Test – When you add or modify a monitor, you can test General<br />
settings to determine if they are set appropriately. After clicking<br />
the Test button, you will see messages in the status window as<br />
the test runs and when the test completes.<br />
3. Each monitor that you add must have a unique name. You can<br />
let <strong>OneSight</strong> create a unique name using the Process<br />
specifications you supply, or you can type in your own name<br />
for the monitor.<br />
4. On the General tab, type in the host name or IP address of the<br />
server you want to monitor.<br />
5. Select the process that you want to monitor. If you don’t see the<br />
process you want, click Other and type in the process name.<br />
6. Select the measurement that you want to use to monitor the<br />
process.<br />
7. Select the method of aggregation that you want to use to<br />
monitor the process.<br />
8. Specify the sample frequency.<br />
9. To verify that the monitor will work as configured, click the<br />
Test button. The Monitor Test window provides information<br />
about the success or failure of the test and indicates what may<br />
be causing any problem.<br />
10. If the test succeeds, click OK in the Add Monitor dialog box to<br />
save these basic Process monitor settings. You can now add this<br />
monitor to a monitor group. Refer to Adding Monitors to a<br />
Monitor Group in Chapter 4.<br />
Chapter 5: Configuring Monitors 317
Configuring Service Monitors<br />
Configuring Service Monitors<br />
A Service monitor allows you to see status on and be notified of the<br />
availability of a Windows Service. The Service monitor verifies that<br />
critical Windows services, such as FTP, DNS, or Telnet are running.<br />
To use this monitor, the user information you provide must have<br />
sufficient rights to query status of services on remote machines.<br />
In the Add Monitor dialog box, when you click Service in the<br />
Monitor Types box, settings to configure a Service monitor appear<br />
on these dialog box tabs:<br />
General Tab – Contains the options that you can use to create a<br />
Service monitor for your monitor group.<br />
Alerts Tab – Displays the options that you can use to modify an alert<br />
and associate it with action plans. You can also configure how a<br />
Service alert will affect the monitor group’s health. It can result in a<br />
Warning state, a Critical state, or can have no impact on health.<br />
New alerts cannot be added to a Service monitor.<br />
Locations Tab – Specifies the Data Collector Location from which<br />
to monitor the status of a Windows service.<br />
SmartLinks Tab – Contains the options for specifying a link to<br />
associate with a particular monitor or metric.<br />
Attributes Tab – Contains the options for specifying which attributes<br />
are applied to this monitor for Status page sorting.<br />
Monitor Groups Tab – Contains the options that you can use to<br />
specify which monitor groups the monitor is used with. This tab is<br />
available when you open the Add Monitor window by selecting<br />
Monitors from the Configure menu. It is not available when you<br />
open the Add Monitor window from the Monitor Group Editor.<br />
Access Control Tab – Contains the options for specifying which user<br />
groups have read, write, and delete permissions for this monitor.<br />
318 <strong>OneSight</strong> <strong>Administrator</strong> <strong>Guide</strong>
Configuring Service Monitors<br />
Down Time Tab – Contains the options for applying downtime to<br />
this monitor.<br />
Each monitor that you create must have a unique name. In the<br />
Monitor Name box, <strong>OneSight</strong> creates a unique name for the current<br />
monitor by combining the name of the monitor type with the name<br />
of the host to which the monitor applies. To change the default<br />
assigned name, type a unique monitor name that helps you to<br />
identify what this monitor does.<br />
A Service monitor determines if a specific service on a Windows<br />
machine is available. Use this procedure to create a Service<br />
monitor. The Service monitor verifies that critical Windows<br />
services, such as FTP, DNS, or Telnet are running.<br />
To create a Service monitor:<br />
1. On the Monitors Page, click Add to open the Add Monitor<br />
dialog box.<br />
Chapter 5: Configuring Monitors 319
Configuring Service Monitors<br />
2. The Monitor Types box lists all of the types of monitors that<br />
can be applied to your monitor group. Click Service to add a<br />
monitor that confirms that a service on a Windows machine has<br />
been started. Use settings on the General tab to configure each<br />
Service monitor.<br />
Use the options on this tab to specify the Windows information<br />
about the machine on which you want to monitor services.<br />
Import/Export – Click this button to display the Import Export<br />
Monitors dialog box for importing or exporting monitors of this<br />
type. Refer to ―Exporting and Importing Monitors,‖ later in this<br />
chapter for more information.<br />
System Identification Settings<br />
DNS Name – Specifies the DNS name of the Windows<br />
machine. In many environments, this is the same as the<br />
NetBIOS name, described below.<br />
320 <strong>OneSight</strong> <strong>Administrator</strong> <strong>Guide</strong>
Configuring Service Monitors<br />
NetBIOS Name – Specifies the NetBIOS name of the<br />
Windows machine. The NetBIOS name is the Windows<br />
Computer Name. In Windows 2003, this is on the<br />
Identification tab in Network Neighborhood properties tab. In<br />
Windows 2000, it is on the Network Identification tab in My<br />
Computer properties.<br />
Authentication Settings – If you are monitoring a remote system<br />
that is running Windows 2003/2008 and that does not have a<br />
Data Collector or Remote Agent running on it, you must<br />
authenticate with a domain, not directly with the machine. If<br />
you have installed a <strong>OneSight</strong> Data Collector or Remote Agent<br />
on the machine you are monitoring, the user name, domain, and<br />
password are not required.<br />
User Name – Specifies the name to use for authentication to<br />
the remote Windows machine.<br />
Domain – Specifies the domain to use for authentication to<br />
the remote Windows machine. The Username and Password<br />
information you supply should be associated with the domain<br />
to which the user belongs.<br />
Password – Specifies the password to use for authentication<br />
to the remote Windows machine.<br />
Service<br />
Discover Services – Click Discover Services to add service<br />
entries to the Service Name list.<br />
Service Name – After you provide the system information<br />
(DNS name, NetBIOS name, user name, password, and<br />
domain authentication), <strong>OneSight</strong> can find the services on<br />
that machine. Click the Discover Services button, and then<br />
click the arrow next to the Service Name box to see a list of<br />
available services on the specified machine.<br />
Chapter 5: Configuring Monitors 321
Configuring Service Monitors<br />
Sample Every: – Specifies how often samples are<br />
taken for this monitor. Refer to, ―Sample Every Settings,‖ later<br />
in this chapter for a description of these settings.<br />
Test – When you add or modify a monitor, you can test General<br />
settings to determine if they are set appropriately. After clicking<br />
the Test button, you will see messages in the status window as<br />
the test runs and when the test completes.<br />
3. Each monitor that you add must have a unique name. You can<br />
let <strong>OneSight</strong> create a unique name using the Service<br />
specifications you supply, or you can type in your own name<br />
for the monitor.<br />
4. On the General tab, type in the DNS name, NetBIOS name, user<br />
name, password, and domain of the machine you want to<br />
monitor. If you have a <strong>OneSight</strong> Data Collector or Remote<br />
Agent installed on the machine you want to monitor, the<br />
authentication information (Username, Password, and Domain)<br />
is not required.<br />
5. Click Discover Services. Using the login information you have<br />
specified, the available services on that machine are identified<br />
and listed here.<br />
6. Select the service you want to monitor in the Service Name list<br />
box.<br />
7. To verify that the monitor will work as configured, click the<br />
Test button. The Monitor Test window provides information<br />
about the success or failure of the test and indicates what may<br />
be causing any problem.<br />
8. If the test succeeds, click OK in the Add Monitor dialog box to<br />
save these basic Service monitor settings. You can now add this<br />
monitor to a monitor group. Refer to Adding Monitors to a<br />
Monitor Group in Chapter 4.<br />
322 <strong>OneSight</strong> <strong>Administrator</strong> <strong>Guide</strong>
Configuring SNMP Monitors<br />
Configuring SNMP Monitors<br />
Creating an SNMP (Simple Network Management Protocol) monitor<br />
allows <strong>OneSight</strong> to provide specific performance and configuration<br />
information on network devices, such as routers, or on hosts, such<br />
as workstations or mainframes.<br />
To use this monitor, enable SNMP on the machine you intend to<br />
monitor. Also, be sure that the MIB data you plan on collecting is<br />
supported by the SNMP daemon on the monitored machine.<br />
Note: If you want to gather a variety of SNMP metrics or you want<br />
to compare the same metric or set of metrics on multiple machines,<br />
you may want to create a profile monitor for the RFC 1213 Network<br />
Device profile instead of using this dedicated SNMP monitor.<br />
In the Add Monitor dialog box, when you click SNMP in the<br />
Monitor Types box, settings to configure an SNMP monitor appear<br />
on these dialog box tabs:<br />
General Tab – Contains the options that you can use to create an<br />
SNMP monitor for your monitor group.<br />
Advanced Tab – Contains the options for configuring objects.<br />
Alerts Tab – Displays the options that you can use to modify an alert<br />
and associate it with an action plan. You can also configure how the<br />
SNMP alert will affect the monitor group’s health. It can result in a<br />
Warning state, a Critical state, or can have no impact on health.<br />
Locations Tab – Specifies the Data Collector Location from which<br />
to monitor a specific SNMP object.<br />
SmartLinks Tab – Contains the options for specifying a link to<br />
associate with a particular monitor or metric.<br />
Attributes Tab – Contains the options for specifying which attributes<br />
are applied to this monitor for Status page sorting.<br />
Chapter 5: Configuring Monitors 323
Configuring SNMP Monitors<br />
Monitor Groups Tab – Contains the options that you can use to<br />
specify which monitor groups the monitor is used with. This tab is<br />
available when you open the Add Monitor window by selecting<br />
Monitors from the Configure menu. It is not available when you<br />
open the Add Monitor window from the Monitor Group Editor.<br />
Access Control Tab – Contains the options for specifying which user<br />
groups have read, write, and delete permissions for this monitor.<br />
Down Time Tab – Contains the options for applying downtime to<br />
this monitor.<br />
Each monitor that you create must have a unique name. In the<br />
Monitor Name box, <strong>OneSight</strong> creates a unique name for the current<br />
monitor by combining the name of the monitor type with the name<br />
of the host to which the monitor applies. To change the default<br />
assigned name, type a unique monitor name that helps you to<br />
identify what this monitor does.<br />
To create an SNMP monitor:<br />
1. On the Monitors Page, click Add to open the Add Monitor<br />
dialog box.<br />
324 <strong>OneSight</strong> <strong>Administrator</strong> <strong>Guide</strong>
Configuring SNMP Monitors<br />
2. The Monitor Types box lists all of the types of monitors that<br />
can be applied to your monitor group. Click SNMP to add a<br />
monitor that checks an SNMP object. You’ll use settings on the<br />
General tab to configure an SNMP monitor.<br />
Import/Export – Click this button to display the Import Export<br />
Monitors dialog box for importing or exporting monitors of this<br />
type. Refer to ―Exporting and Importing Monitors,‖ later in this<br />
chapter for more information.<br />
Host Name – Specifies the name or IP address of the host.<br />
Community – Specifies the SNMP password of the system. The<br />
default SNMP community string is public.<br />
Port – Specifies the port number used on this system by the<br />
SNMP agent. Typically, this is port 161.<br />
Time Out– Specifies the amount of time (in seconds) to wait for<br />
an SNMP reply. If Retries is greater than 0 and a reply is not<br />
received, a retry attempt is made. For each subsequent retry, the<br />
Chapter 5: Configuring Monitors 325
Configuring SNMP Monitors<br />
timeout value is doubled. For example, if Time Out is 5 and<br />
Retries is 2, the first request attempt will occur after 5 seconds,<br />
the second attempt will occur after 10 seconds, and the third<br />
attempt will occur after 20 seconds. In this example, the total<br />
timeout period equals 35 seconds. If there is no response after<br />
this time, a Sample Failure is triggered.<br />
If Retries is 0, a Sample Failure is triggered when a reply is not<br />
received in this amount of time.<br />
Retries – Sets the upper limit for the number of times an SNMP<br />
request is retried. For example, if Retries is set to 3, the SNMP<br />
request will be sent up to four times (the initial try plus three<br />
retries).<br />
3. Each monitor that you add must have a unique name. You can<br />
let <strong>OneSight</strong> create a unique name based on the Object, or you<br />
can type in your own name for the monitor.<br />
4. For the Host Name specification, type in the name or IP address<br />
of the machine.<br />
5. Confirm that the other System defaults (community string of<br />
public, default port 161, etc.) are appropriate for the SNMP<br />
object you want to monitor.<br />
326 <strong>OneSight</strong> <strong>Administrator</strong> <strong>Guide</strong>
Configuring SNMP Monitors<br />
6. Click the Advanced tab.<br />
Metric – Click the arrow next to the Metric box to select from<br />
the list of common SNMP metrics (for example, HOST-<br />
RESOURCES-MIB % Disk Space Used). When you select one of<br />
these metrics, the appropriate object information is<br />
automatically supplied. In some cases, the settings allow you to<br />
supply an additional setting, such as a Search for string.<br />
If the metric you want to monitor is not in this list, use the<br />
option and complete the items described below.<br />
Object ID – Specify an Object ID (OID). <strong>OneSight</strong> only uses<br />
objects that return numeric values. If the Object ID you enter<br />
does not begin with a ―.‖, <strong>OneSight</strong> assumes the OID is within<br />
the MIB-II (.1.3.6.1.2.1) hierarchy.<br />
Chapter 5: Configuring Monitors 327
Configuring SNMP Monitors<br />
MIB Browser – Displays the MIB browser in a separate window.<br />
You can view objects in the MIB browser and optionally<br />
populate the Object ID field on the Advanced tab.<br />
Action – Select an action:<br />
Get – Performs a traditional SNMP get operation. If you select<br />
Get, you must also specify a valid Object ID and append the<br />
instance identifier to it.<br />
Table Get – Searches an SNMP table for numeric data<br />
associated with a particular instance, or row, of the table. If<br />
you select Table Get, you must also specify a valid Object ID<br />
(no instance identifier), Search for String, and column to look<br />
in.<br />
Instance – Performs a traditional SNMP get operation using the<br />
instance, or row, identifier you specify here. For scalar objects,<br />
the instance is always 0. For example, if you want to retrieve<br />
the MIB-2 sysUpTime (.1.3.6.1.2.1.1.3) object, there is only one<br />
instance of this object, and scalar SNMP objects require the ―.0‖<br />
instance identifier.<br />
Search for string – Enter the string <strong>OneSight</strong> will search for in<br />
the OID column that you specify below. This setting applies<br />
only if Table Get is selected in the Action field. A regular<br />
expression can be used. Refer to Using Regular Expressions for<br />
Pattern Matching for more information.<br />
In OID column – Enter the column where <strong>OneSight</strong> will search<br />
for string you specified above. This setting applies only if Find<br />
Instance is selected.<br />
Scale – Type the multiplier you want applied to the data that’s<br />
collected.<br />
Setting Scale to 1 means the data will be reported as it is. If the<br />
metric measurement is expressed in kilobytes, setting Scale to<br />
1024 will translate it to bytes. If the metric measurement is<br />
328 <strong>OneSight</strong> <strong>Administrator</strong> <strong>Guide</strong>
Configuring SNMP Monitors<br />
expressed in milliseconds, setting Scale to .001 will translate it<br />
to seconds.<br />
Version – Select the SNMP version being used.<br />
The following additional fields are displayed for SNMP version<br />
3:<br />
User Name – Enter the user name to use to log in to the SNMP<br />
version 3 protocol.<br />
Password – Enter the password to use to log in to the SNMP<br />
version 3 protocol.<br />
Auth – Select the authentication hashing function to use: MD5<br />
or SHA.<br />
Auth Mode – Select the authentication mode.<br />
NoAuth/NoPriv – No authentication and no privileges.<br />
Auth/NoPriv – Authentication and no privileges.<br />
Auth/Priv – Both Authentication and privileges.<br />
Privacy Mode – Select the method to use for encrypting the<br />
data.<br />
Privacy Password – If you have selected a privacy mode,<br />
enter the password.<br />
Context – Enter the context setting that matches the setting in<br />
the device that is being monitored. Typically, it is a name that<br />
describes the device. For example, ―bridge.‖<br />
Translation Type – Select No Translation if the value requires no<br />
further modification. The Rate translation type means that the<br />
value should be calculated as frequency per minute.<br />
Chapter 5: Configuring Monitors 329
Configuring SNMP Monitors<br />
Unit Measure – To define a Unit Measure, click the arrow to<br />
select a unit measure (%, bytes, hours, minutes, seconds). You<br />
can also type in a unit measure such as messages/minute. This<br />
measure is a display string. It does not perform any data<br />
translation.<br />
Sample Every: – Specifies how often samples are<br />
taken for this monitor. Refer to, ―Sample Every Settings,‖ later<br />
in this chapter for a description of these settings.<br />
Divide by Object ID Settings – Use this setting in conjunction<br />
with the Object ID setting (above) to gather information that is<br />
best expressed as a ration. The value retrieved by Object ID is<br />
the dividend and the value retrieved by Divide by Object ID is the<br />
divisor. (Object ID/Divide by Object ID).<br />
Enable – Select this check box to enable this setting.<br />
Object ID – Enter an object ID. For example, in the HOST-<br />
RESOURCES MIB, disk size (hrStorageSize) and disk in use<br />
(hrStorageUsed) are two different OIDs which, when<br />
divided, give you the ration, or portion, of the disk that is in<br />
use. Using this example, you could enter 25.2.3.1.6 as the<br />
Object ID and 25.2.3.1.5 as the Divide By Object ID.<br />
String Mappings – Displays the String Mappings dialog box for<br />
specifying string mappings.<br />
String Mappings – <strong>OneSight</strong> collects numeric performance<br />
data. If you are measuring an SNMP object representing an<br />
SNMP String datatype, it can be converted to a number for<br />
use in <strong>OneSight</strong> by using the SNMP String Mappings field.<br />
Simply specify a semicolon delimited mapping of Strings to<br />
Integers. For example, ―false=0;true=1‖; will convert a<br />
―false‖ reading to a 0 value in <strong>OneSight</strong>, and this will be<br />
displayed in <strong>OneSight</strong> Status as ―false=0‖. If you only want<br />
to display the string on the <strong>OneSight</strong> status page, use a colon,<br />
rather than a semi-colon to delimit the values.<br />
330 <strong>OneSight</strong> <strong>Administrator</strong> <strong>Guide</strong>
Configuring SNMP Monitors<br />
If you neglect to provide a mapping for a specific string,<br />
<strong>OneSight</strong> will consider this a Sample Failure, and report the<br />
String that was returned. String Mappings can also be used to<br />
translate a number to a String for display in <strong>OneSight</strong> Status.<br />
This is helpful when numbers represent an objects state.<br />
Note that string matching is case-insensitive and data that has<br />
a colon cannot be used in string mapping.<br />
Test – When you add or modify a monitor, you can test General<br />
settings to determine if they are set appropriately. After clicking<br />
the Test button, you will see messages in the status window as<br />
the test runs and when the test completes.<br />
7. Click the arrow next to the Metric box to select from the list of<br />
common SNMP metrics (for example, HOST-RESOURCES-MIB<br />
% Disk Space Used). The list includes metrics for a variety of<br />
SNMP MIBs. If you’re using a metric in the HOST-RESOURCES-<br />
MIB group, the machine you’re monitoring must have SNMP<br />
and the Host Resources MIB enabled.<br />
When you select one of these objects, the appropriate object<br />
information is automatically supplied. In some cases, the<br />
settings allow you to supply an additional setting, such as a<br />
Search for String.<br />
If the metric you want to monitor is not in this list, select the<br />
option from the Metric list and click MIB Browser to<br />
find it. In the MIB Browser, select the metric you want to<br />
monitor, verify that it is accessible by clicking Go. When you<br />
exit the MIB Browser, you can save the settings to the Object ID<br />
field.<br />
8. If necessary, type in the Search for String. This is the string<br />
<strong>OneSight</strong> will search for in the OID column specified. In the<br />
case of Disk: Space in Use, the default, /usr, may be<br />
appropriate.<br />
Chapter 5: Configuring Monitors 331
Configuring SNMP Trap Monitors<br />
9. To verify that the monitor will work as configured, click the<br />
Test button. The Monitor Test window provides information<br />
about the success or failure of the test and indicates what may<br />
be causing any problem.<br />
10. If the test succeeds, click OK in the Add Monitor dialog box to<br />
save these basic SNMP monitor settings. You can now add this<br />
monitor to a monitor group. Refer to Adding Monitors to a<br />
Monitor Group in Chapter 4.<br />
Configuring SNMP Trap Monitors<br />
Creating an SNMP (Simple Network Management Protocol) Trap<br />
monitor allows <strong>OneSight</strong> to check for specific trap messages on<br />
network devices, such as routers, or on hosts, such as workstations<br />
or mainframes. A trap is an alarm-triggering event on an agent, such<br />
as a system reboot. You configure the general filtering criteria for a<br />
trap on the General tab, and specify any pattern match alerts against<br />
the trap in the Alerts Editor. When a trap is received, it is parsed for<br />
the filtering criteria specified in the General tab. If it passes the<br />
general criteria, the trap is displayed, otherwise, the trap is<br />
discarded. If alerts search strings are matched, the alert event is<br />
generated.<br />
Before configuring an SNMP Trap monitor, the following<br />
prerequisites must be met:<br />
The computer sending the trap must have an application that can<br />
send traps and be configured to send the appropriate traps.<br />
The computer sending the traps must have the community string<br />
and destination configured in the SNMP Service. These<br />
parameters are located on the Traps tab. The trap destination<br />
should be set to the machine receiving the traps.<br />
In the Add Monitor dialog box, when you click SNMP Trap in the<br />
Monitor Types box, settings to configure an SNMP Trap monitor<br />
appear on these dialog box tabs:<br />
332 <strong>OneSight</strong> <strong>Administrator</strong> <strong>Guide</strong>
Configuring SNMP Trap Monitors<br />
General Tab – Contains the options that you can use to create an<br />
SNMP Trap monitor for your monitor group.<br />
Alerts Tab – Displays the options that you can use to modify an alert<br />
and associate it with an action plan. You can also configure how the<br />
SNMP Trap alert will affect the monitor group’s health. It can result<br />
in a Warning state, a Critical state, or can have no impact on health.<br />
SmartLinks Tab – Contains the options for specifying a link to<br />
associate with a particular monitor or metric.<br />
Attributes Tab – Contains the options for specifying which attributes<br />
are applied to this monitor for Status page sorting.<br />
Monitor Groups Tab – Contains the options that you can use to<br />
specify which monitor groups the monitor is used with. This tab is<br />
available when you open the Add Monitor window by selecting<br />
Monitors from the Configure menu. It is not available when you<br />
open the Add Monitor window from the Monitor Group Editor.<br />
Access Control Tab – Contains the options for specifying which user<br />
groups have read, write, and delete permissions for this monitor.<br />
Down Time Tab – Contains the options for applying downtime to<br />
this monitor.<br />
Each monitor that you create must have a unique name. In the<br />
Monitor Name box, <strong>OneSight</strong> creates a unique name for the current<br />
monitor by combining the name of the monitor type with the name<br />
of the host to which the monitor applies. To change the default<br />
assigned name, type a unique monitor name that helps you to<br />
identify what this monitor does.<br />
To create an SNMP Trap monitor:<br />
1. On the Monitors Page, click Add to open the Add Monitor<br />
dialog box.<br />
Chapter 5: Configuring Monitors 333
Configuring SNMP Trap Monitors<br />
2. The Monitor Types box lists all of the types of monitors that<br />
can be applied to your monitor group. Click SNMP Trap to add a<br />
monitor that monitors for SNMP Trap messages. You’ll use<br />
settings on the General tab to configure an SNMP Trap monitor.<br />
Import/Export – Click this button to display the Import Export<br />
Monitors dialog box for importing or exporting monitors of this<br />
type. Refer to ―Exporting and Importing Monitors,‖ later in this<br />
chapter for more information.<br />
Collection Host – Specifies the name or IP address of the host<br />
with the running <strong>OneSight</strong> Data Collector to which the traps are<br />
being sent.<br />
Mib File – Optionally specifies the name and location of the<br />
Management Information Base (MIB) file for the SNMP device.<br />
The MIB file is provided by the SNMP device manufacturer.<br />
The MIB file allows <strong>OneSight</strong> to import the OIDs by name<br />
rather than number. When you specify a MIB file, the Enterprise<br />
and Trap Type lists will be populated with the OID names<br />
334 <strong>OneSight</strong> <strong>Administrator</strong> <strong>Guide</strong>
Configuring SNMP Trap Monitors<br />
defined in the MIB file. You can select the names in the<br />
Enterprise and/or Trap Type lists to define which SNMP Trap to<br />
monitor.<br />
The <strong>OneSight</strong> Server <strong>Administrator</strong> must copy other SNMP<br />
device manufacturer MIB files to the MIB file directory of the<br />
<strong>OneSight</strong> Server before a filename can be specified in this field<br />
(<strong>OneSight</strong> includes a onesight.mib file). If you get an error when<br />
specifying a MIB file, contact your <strong>OneSight</strong> Server<br />
<strong>Administrator</strong> to verify the SNMP device MIB file is available<br />
on the <strong>OneSight</strong> server.<br />
Note: The MIB file should be both on the <strong>OneSight</strong> Server and<br />
the Data Collector machines. On the <strong>OneSight</strong> server, the MIB<br />
file should be located in the \mibs<br />
directory. On the Data Collector, it should be located in the<br />
\mibs directory. This is<br />
especially important when the <strong>OneSight</strong> Server and Data<br />
Collector are installed on different machines.<br />
List Mibs – Lists the MIB files in the C:\Empirix\<strong>OneSight</strong>\mibs\<br />
directory on the <strong>OneSight</strong> server. Use to enter a MIB<br />
that is not listed.<br />
Get Values – Gets the values for Enterprise and Trap type from<br />
the MIB file entered in the Mib File field.<br />
Upload MIB – Lets you upload a MIB file to the<br />
C:\Empirix\<strong>OneSight</strong>\mibs\ directory on the <strong>OneSight</strong> server.<br />
Browse – Displays the MIB Browser in a separate window. You<br />
can view objects and copy and paste them into the Add Monitor<br />
dialog box.<br />
Community – Specifies the SNMP password of the system. The<br />
default SNMP community string is public.<br />
Enterprise – Specifies the Enterprise criteria to further define<br />
which SNMP Trap to monitor. Enter a specific Enterprise OID<br />
or select the criteria from the list defined in the specified MIB<br />
Chapter 5: Configuring Monitors 335
Configuring SNMP Trap Monitors<br />
file. An alert is triggered if the SNMP Trap meets the selected<br />
criteria.<br />
Trap Type – Specifies the Trap Type criteria to further define<br />
which SNMP Trap to monitor. Select the criteria from the list<br />
defined in the specified MIB file. An alert is triggered if the<br />
SNMP Trap meets the selected criteria.<br />
Note: Filtering can only be done on Enterprise ID and trap type;<br />
it cannot be done based on individual OIDs.<br />
Reset Trap – Specifies the Trap Type criteria that will reset any<br />
existing alerts for this monitor.<br />
Note: You can have the trap reset based on a different OID. This<br />
is useful for systems that have traps that get issued with their<br />
own OID when an issue clears. For example, you could have<br />
two SNMP actions, one of the type <strong>OneSight</strong> Critical and one of<br />
the type <strong>OneSight</strong> Normal. If you set the trap type to <strong>OneSight</strong><br />
Critical and the reset trap to <strong>OneSight</strong> Normal, the trap will<br />
reset when a trap is received that is associated with the<br />
<strong>OneSight</strong> Normal OID.<br />
Char set – This field is used for internationalization. If<br />
necessary, select the character set appropriate for your<br />
language.<br />
NameFormat – Select the name format to use. The selected<br />
name format is used to display the name on the status page and<br />
on emails.<br />
FullName – The entire value is used. For example,<br />
.org.iso.dod.internet.mgmt.mib-2.icmp.icmlnMsgs.<br />
ShortName – Only the value in the last fields is used. For<br />
example, if the long name were as shown in the above<br />
example, the short name would be icmplnMsgs.<br />
Test – When you add or modify a monitor, you can test General<br />
settings to determine if they are set appropriately. After clicking<br />
336 <strong>OneSight</strong> <strong>Administrator</strong> <strong>Guide</strong>
Configuring SNMP Trap Monitors<br />
the Test button, you will see messages in the status window as<br />
the test runs and when the test completes.<br />
3. Each monitor that you add must have a unique name. You can<br />
let <strong>OneSight</strong> create a unique name based on the Object, or you<br />
can type in your own name for the monitor.<br />
4. For the Collection Host, type in the name or IP address of the<br />
SNMP Trap destination host (the host running SNMP<br />
management software).<br />
5. For the MIB file, type in the name to specify the Management<br />
Information Base file for the SNMP device. The MIB file is<br />
provided by the SNMP device manufacturer. The <strong>OneSight</strong><br />
Server <strong>Administrator</strong> must copy other SNMP device<br />
manufacturer MIB files to the MIB file directory of the<br />
<strong>OneSight</strong> Server before a filename can be specified in this field<br />
(<strong>OneSight</strong> includes a onesight.mib file). If you get an error when<br />
specifying a MIB file, contact your <strong>OneSight</strong> Server<br />
<strong>Administrator</strong> to verify the SNMP device MIB file is available<br />
on the <strong>OneSight</strong> server.<br />
6. Enter the community string the SNMP object you want to<br />
monitor.<br />
7. For the Enterprise, enter a specific Enterprise OID or select the<br />
criteria from the list defined in the specified MIB file. An alert<br />
is triggered if the SNMP Trap meets this criteria.<br />
8. For the Trap Type, enter a specific trap type OID or select the<br />
criteria from the list defined in the specified MIB file. An alert<br />
is triggered if the SNMP Trap meets this criteria.<br />
9. To verify that the monitor will work as configured, click the<br />
Test button. The Monitor Test window provides information<br />
about the success or failure of the test and indicates what may<br />
be causing any problem.<br />
Chapter 5: Configuring Monitors 337
Configuring TCP/IP Socket Monitors<br />
10. If the test succeeds, click OK in the Add Monitor dialog box to<br />
save these basic SNMP Trap monitor settings. You can now add<br />
this monitor to a monitor group. Refer to Adding Monitors to a<br />
Monitor Group in Chapter 4.<br />
Configuring TCP/IP Socket Monitors<br />
You can set up a TCP/IP socket monitor to collect data on a TCP/IP<br />
port on a remote system. The monitor connects to the host and port<br />
specified and treats the data it receives in the same way as it would<br />
treat the data in a log file. This is useful, for example, for<br />
monitoring a serial port via a serial to TCP converter or for<br />
monitoring a system that has a logging port.<br />
Note: TCP/IP monitors are shown as Logfile monitors on the status<br />
page.<br />
In the Add Monitor dialog box, when you click TCP/IP Socket in the<br />
Monitor Types box, settings to configure a TCP/IP Socket monitor<br />
appear on these dialog box tabs:<br />
General Tab – Contains the options that you can use to create a<br />
TCP/IP Socket monitor for your monitor group.<br />
Alerts Tab – Displays the options that you can use to define alerts<br />
and associate them with action plans. You can also configure how a<br />
TCP/IP Socket alert will affect the monitor group’s health. It can<br />
result in a Warning state, a Critical state, or can have no impact on<br />
health.<br />
SmartLinks Tab – Contains the options for specifying a link to<br />
associate with a particular monitor or metric.<br />
Attributes Tab – Contains the options for specifying which attributes<br />
are applied to this monitor for Status page sorting.<br />
Monitor Groups Tab – Contains the options that you can use to<br />
specify which monitor groups the monitor is used with. This tab is<br />
338 <strong>OneSight</strong> <strong>Administrator</strong> <strong>Guide</strong>
Configuring TCP/IP Socket Monitors<br />
available when you open the Add Monitor window by selecting<br />
Monitors from the Configure menu. It is not available when you<br />
open the Add Monitor window from the Monitor Group Editor.<br />
Access Control Tab – Contains the options for specifying which user<br />
groups have read, write, and delete permissions for this monitor.<br />
Down Time Tab – Contains the options for applying downtime to<br />
this monitor.<br />
Each monitor that you create must have a unique name. In the<br />
Monitor Name box, <strong>OneSight</strong> creates a unique name for the current<br />
monitor by combining the name of the monitor type with the name<br />
of the host to which the monitor applies. To change the default<br />
assigned name, type a unique monitor name that helps you to<br />
identify what this monitor does.<br />
To create a TCP/IP Socket monitor:<br />
1. On the Monitors Page, click Add to open the Add Monitor<br />
dialog box.<br />
Chapter 5: Configuring Monitors 339
Configuring TCP/IP Socket Monitors<br />
2. The Monitor Types box lists all of the types of monitors that<br />
can be applied to your monitor group. Click TCP/IP Socket to<br />
add a monitor that will collect data from a remote TCP/IP port.<br />
TCP/IP Port – Enter the TCP/IP port that you want <strong>OneSight</strong> to<br />
connect to. Data must be being sent down this port.<br />
Metric Type – Select the type of metric.<br />
Perl Expression – select this option when you want to use a<br />
Perl expression to collect data.<br />
Number of Matching Records – this metric returns the number<br />
of records that matched the entered Perl expression.<br />
Total Records Encountered Since Last Sample – this metric<br />
returns the number of records written since the last sample.<br />
Time Since Last Modified – this metric returns the length of<br />
time since data was sent to the channel.<br />
340 <strong>OneSight</strong> <strong>Administrator</strong> <strong>Guide</strong>
Configuring TCP/IP Socket Monitors<br />
Perl Expression –Specifies a Perl Expression used to collect<br />
numerical performance data from a log file entry. The monitor<br />
checks the last entry whenever the log file changes. This<br />
returned data can then be used within <strong>OneSight</strong>, both for<br />
alerting, using threshold alerts, and reporting.<br />
To check whether the file exists, use the File/directory exits<br />
metric type and leave this field blank.<br />
String Mappings – Displays the String Mappings dialog box for<br />
specifying string mappings.<br />
String Mappings – <strong>OneSight</strong> collects numeric performance<br />
data. If you are measuring a log file response that is a string,<br />
it can be converted to a number for use in <strong>OneSight</strong> by using<br />
the String Mappings field. Simply specify a semicolon<br />
delimited mapping of Strings to Integers. For example,<br />
―false=0;true=1‖; will convert a ―false‖ reading to a 0 value<br />
in <strong>OneSight</strong>, and this will be displayed in <strong>OneSight</strong> Status as<br />
―false=0‖. If you only want to display the string on the<br />
<strong>OneSight</strong> status page, use a colon, rather than a semi-colon to<br />
delimit the values.<br />
If you neglect to provide a mapping for a specific string,<br />
<strong>OneSight</strong> will consider this a Sample Failure, and report the<br />
String that was returned. String Mappings can also be used to<br />
translate a number to a String for display in <strong>OneSight</strong> Status.<br />
This is helpful when numbers represent an objects state.<br />
Note that string matching is case-insensitive and data that has<br />
a colon cannot be used in string mapping.<br />
Record Type – Specifies the operating mode:<br />
Each record is one line – select this option to use one line at a<br />
time operating mode. In this mode each line read from the<br />
file is treated as a single log file entry and is processed<br />
individually.<br />
Chapter 5: Configuring Monitors 341
Configuring TCP/IP Socket Monitors<br />
PERL expression defines record – select this option to use<br />
arbitrary record-based mode. In this mode a Perl expression<br />
is used to determine where each record in the file starts and<br />
ends. The expression is applied to the data as it is read, and<br />
records are picked out as they are found. Entries that exceed<br />
the specified maximum record size are ignored.<br />
If you select Perl expression defines record, the following<br />
additional fields are displayed:<br />
Max Record Length – Enter the maximum record length.<br />
Entries that exceed this length are ignored.<br />
Record Format (PERL) – Enter the Perl expression defining<br />
the record, including the delimiter character.<br />
Unit Measure – Specifies the units to use when displaying the<br />
metric.<br />
Inactivity Sample Count – If the data source detects that the<br />
monitored TCP/IP connection does not receive any new<br />
information for the number of sample counts you enter here, a<br />
sample failure will result.<br />
Sample Continuously – Select to sample continuously. This field<br />
is only available when Metric Type is Perl Expression value.<br />
Sample Every: – Specifies how often samples are<br />
taken for this monitor. Refer to, ―Sample Every Settings,‖ later<br />
in this chapter for a description of these settings.<br />
Alert Collection Mode – Select how you want alerts to be<br />
processed.<br />
Report Alerts as they Occur – If multiple alerts occur on the<br />
same trigger they are all sent. Alerts with the same timestamp<br />
as a previous alert will not be sent.<br />
Report First Alert Encountered for a Trigger – The first alert<br />
that occurs during a sample run for a specific trigger is the<br />
342 <strong>OneSight</strong> <strong>Administrator</strong> <strong>Guide</strong>
Configuring TCP/IP Socket Monitors<br />
only one sent. Subsequent alerts for the same trigger are<br />
ignored.<br />
Report Last Alert Encountered for a Trigger – The last alert<br />
that occurs during a sample run for a specific trigger is the<br />
only one sent. Previous alerts for the same trigger are<br />
ignored.<br />
Report all Alerts for a Trigger as a bundle – Send all alerts that<br />
occur for a specific trigger during the sample run as one alert<br />
message.<br />
Test – When you add or modify a monitor, you can test General<br />
settings to determine if they are set appropriately. After clicking<br />
the Test button, you will see messages in the status window as<br />
the test runs and when the test completes.<br />
3. Each monitor that you add must have a unique name. You can<br />
let <strong>OneSight</strong> create a unique name using the specifications you<br />
supply, or you can type in your own name for the monitor.<br />
4. Enter the Remote Host Name, specifying the name or IP address<br />
of the socket to be monitored.<br />
5. Enter the TCP port to be monitored.<br />
6. Select the Metric Type.<br />
7. Type in a Perl Expression to collect performance data from a<br />
log file entry. If you want to verify that the file exists use the<br />
File/directory exists metric type and leave this field blank.<br />
8. Select the record type.<br />
9. If you selected PERL Expression defines record, enter the Max<br />
Record Length and Record Format.<br />
Chapter 5: Configuring Monitors 343
Configuring URL Monitors<br />
10. On the Alerts tab, add your content string tests using the Pattern<br />
Match alert. If you have specified a Perl Expression to collect<br />
performance data, you can also add threshold alerts.<br />
11. To verify that the monitor will work as configured, click the<br />
Test button. The Monitor Test window provides information<br />
about the success or failure of the test and indicates what may<br />
be causing any problem. Note that the Test button for the<br />
TCP/IP Socket Monitor will simply verify that the file exists.<br />
12. If the test succeeds, click OK in the Add Monitor dialog box to<br />
save these basic TCP/IP Socket monitor settings. You can now<br />
add this monitor to a monitor group. Refer to Adding Monitors<br />
to a Monitor Group in Chapter 4.<br />
Configuring URL Monitors<br />
A URL monitor directs <strong>OneSight</strong> to determine if a URL that is<br />
critical to your web site is functioning as it should. A URL monitor<br />
connects to a specified URL at specified time intervals to confirm<br />
that the URL is quickly available. You can set up as many URL<br />
monitors as you need in order to determine if individual web pages<br />
used by your monitor group are available and functioning correctly.<br />
When you click URL in the Monitor Types box, settings to<br />
configure a URL monitor appear on these dialog box tabs:<br />
General Tab – Contains the options that you can use to create a URL<br />
monitor for your monitor group.<br />
Advanced Tab – Allows you to define settings for cookies and user<br />
agent.<br />
Proxy Tab – Allows you to define settings for proxy server and<br />
authentication.<br />
Alerts Tab – Shows what alerts are currently in effect for the URL<br />
monitor, whether the alerts contribute to an error condition, and<br />
344 <strong>OneSight</strong> <strong>Administrator</strong> <strong>Guide</strong>
Configuring URL Monitors<br />
what action plan will be used when an alert occurs. Options on this<br />
tab allow you to add, modify, or delete alerts for the URL monitor.<br />
Locations Tab – Specifies the Data Collector Location from which<br />
to check the access to a specific URL.<br />
SmartLinks Tab – Contains the options for specifying a link to<br />
associate with a particular monitor or metric.<br />
Attributes Tab – Contains the options for specifying which attributes<br />
are applied to this monitor for Status page sorting.<br />
Monitor Groups Tab – Contains the options that you can use to<br />
specify which monitor groups the monitor is used with. This tab is<br />
available when you open the Add Monitor window by selecting<br />
Monitors from the Configure menu. It is not available when you<br />
open the Add Monitor window from the Monitor Group Editor.<br />
Access Control Tab – Contains the options for specifying which user<br />
groups have read, write, and delete permissions for this monitor.<br />
Down Time Tab – Contains the options for applying downtime to<br />
this monitor.<br />
Each monitor that you create must have a unique name. In the<br />
Monitor Name box, <strong>OneSight</strong> creates a unique name for the current<br />
monitor by combining the name of the monitor type with the name<br />
of the page to which the monitor applies. To change the default<br />
assigned name, type a unique monitor name that helps you to<br />
identify what this monitor does.<br />
To create a URL monitor:<br />
1. On the Monitors Page, click Add to open the Add Monitor<br />
dialog box.<br />
2. The Monitor Types box lists all of the types of monitors that<br />
can be applied to your monitor group. Click URL to add a<br />
Chapter 5: Configuring Monitors 345
Configuring URL Monitors<br />
monitor that checks a URL you provide. Use settings on the<br />
General tab to configure each URL monitor.<br />
Use the options on this tab to specify how the URL monitor will<br />
check the response time for access to a specified URL.<br />
Import/Export – Click this button to display the Import Export<br />
Monitors dialog box for importing or exporting monitors of this<br />
type. Refer to ―Exporting and Importing Monitors,‖ later in this<br />
chapter for more information.<br />
URL Address – Type the URL for the web page you want to<br />
check. The URL must be specified with the full protocol<br />
designation of http or https. For example: http://www.empirix.com.<br />
If you use Get as the HTTP Method (the default), simply include<br />
any additional parameters you want to include as part of the<br />
URL string, for example:<br />
http://search.yahoo.com/bin/search?p=electronics<br />
346 <strong>OneSight</strong> <strong>Administrator</strong> <strong>Guide</strong>
Configuring URL Monitors<br />
Good Content String –This setting is optional. When you check<br />
for the availability of a web page, you can confirm that the page<br />
that was reached is the one you expect. If you use this option<br />
and the specified content is not found, the URL monitor is put<br />
into a URL Unavailable state and an alert is triggered. You can<br />
then configure an action, such as an e-mail, to notify you if this<br />
string is not found on the page by modifying the URL<br />
Unavailable alert on the Alerts tab. See the Adding Alerts to a<br />
Monitor for general information about creating an alert.<br />
Type in a string that is present on the specified web page. The<br />
string can be any HTML string; it does not have to be a string<br />
that is visible when viewed with a browser. The string can also<br />
include a regular expression.<br />
When you pick a string, you will get the best results if the string<br />
is:<br />
Not likely to be overwritten by edits and standard<br />
maintenance updates.<br />
Unique to this particular URL.<br />
Bad Content String – This setting is optional. When you check<br />
for the availability of a web page, you can specify a string, such<br />
as an error message, that would be found if the page that was<br />
reached were not the one you expected. If you use this option,<br />
the URL monitor status will change and a URL Unavailable alert<br />
will be triggered when the content you specify is found. You<br />
can configure an action, such as an e-mail, to notify you if this<br />
string is found on the page.<br />
Type in a string that is not present on the specified web page.<br />
The string can be any HTML string; it does not have to be a<br />
string that is visible when viewed with a browser. The string<br />
can also include a regular expression.<br />
Chapter 5: Configuring Monitors 347
Configuring URL Monitors<br />
When you pick a string, you will get the best results if the string<br />
is:<br />
Typically found on a page that is displayed when a page is<br />
not available (for example, ―not found‖ or ―timeout‖).<br />
Not found on the URL you are monitoring.<br />
Match Content String only when returned HTML is well formatted<br />
– select this option to match good content and bad content only<br />
when the return file is HTML. No matching is done for any<br />
other file type.<br />
Sample Timeout – Specify the number of seconds that should<br />
elapse before the monitor times out while attempting to sample.<br />
This setting is based on the time that elapses after a URL is<br />
located and the page download process begins.<br />
Measurement Details<br />
Retrieve Images – If you want to calculate URL availability<br />
and access time with retrieval of embedded images (such as<br />
.gif and .jpeg files and references within tags) included,<br />
select this check box.<br />
Retrieve Objects – If you want to calculate URL availability<br />
and access time with retrieval of embedded objects (such as<br />
ActiveX objects and Java applets) included, select this check<br />
box. <strong>OneSight</strong> measures the time taken to retrieve data used<br />
by objects, but does not include the time needed to retrieve<br />
any executable file required in order to interpret the data.<br />
Content types other than HTML and images are also<br />
classified as objects.<br />
HTTP Method Settings<br />
Get – The default HTTP method is Get. Include any<br />
additional query strings as part of the URL address.<br />
348 <strong>OneSight</strong> <strong>Administrator</strong> <strong>Guide</strong>
Configuring URL Monitors<br />
Note: Some servers limit the length of URL and query strings<br />
to about 240 characters.<br />
Post – The Post method, usually associated with a form,<br />
allows a much larger amount of information to be associated<br />
with the request. When you select the Post option, you can<br />
add Optional HTTP Post Data Items.<br />
Optional HTTP Post Data Items Settings – If you select Post as<br />
the HTTP Method, you can add a series of Name-Value pairs.<br />
Click Add and type in the Name-Value pairs that should be<br />
included with the URL.<br />
For example, a URL generated after completing a form may<br />
appear as follows:<br />
POST http://www.empirix.com/cgi-bin/guestbook.pl<br />
...(additional headers)<br />
name=Harold&nickname=Harry<br />
To reference this page, add nickname for the Name and Harry<br />
for the Value.<br />
On Failure – Indicates whether to include additional information<br />
in an alert when the monitor fails.<br />
Include Traceroute in alert – Includes a trace route in the alert.<br />
Include Ping in alert – Includes the results of a ping in the<br />
alert. This option is faster than including the trace route in<br />
the alert.<br />
Do Nothing – Does not include any additional information in<br />
the alert.<br />
Sample Every: – Specifies how often samples are<br />
taken for this monitor. Refer to, ―Sample Every Settings,‖ later<br />
in this chapter for a description of these settings.<br />
Chapter 5: Configuring Monitors 349
Configuring URL Monitors<br />
Save object download details – When selected, collects data for<br />
the object timer report.<br />
Save Diagnostic Data – Saves the selected data in the<br />
urldetails.jsp file. This data can also be viewed by clicking the<br />
View URL Details Smartlink on the status details page.<br />
Save HTML from failing runs – Select this option to save<br />
HTML from failing runs.<br />
Save HTML from successful runs – Select this option to save<br />
HTML from successful runs.<br />
Test – When you add or modify a monitor, you can test General<br />
settings to determine if they are set appropriately. After clicking<br />
the Test button, you will see messages in the status window as<br />
the test runs and when the test completes.<br />
3. Each monitor that you add must have a unique name. You can<br />
let <strong>OneSight</strong> create a unique name using the URL specifications<br />
you supply, or you can type in your own name for the monitor.<br />
4. On the General tab, enter the URL address for the web page you<br />
want to check.<br />
5. If you want to check the content on the page, you can configure<br />
a Good Content String, a Bad Content String, or both. These<br />
settings are optional.<br />
In the Good Content String box, enter a string that should be<br />
present on this web page.<br />
In the Bad Content String box, enter a string that should not<br />
be present on this web page<br />
Note: These strings can be any HTML string; they do not have to<br />
be strings that are visible when viewed with a browser.<br />
350 <strong>OneSight</strong> <strong>Administrator</strong> <strong>Guide</strong>
Configuring URL Monitors<br />
6. Under HTML Method, select the HTTP method to use for this<br />
monitor. If you select Get as the HTML Method (the default),<br />
you can add parameters to the URL string in the URL Address<br />
for example:<br />
URL Address: http://search.yahoo.com/bin/search?p=electronics<br />
7. In the Sample Every box, enter the number of seconds, minutes,<br />
or hours to control how often the specified URL is monitored<br />
for availability.<br />
8. Specify whether to save object download details for the Object<br />
Timer Report.<br />
9. To verify that the monitor will work as configured, click the<br />
Test button. The Monitor Test window provides information<br />
about the success or failure of the test and indicates what may<br />
be causing any problem.<br />
10. If the test succeeds, click OK in the Add Monitor dialog box to<br />
save these basic URL monitor settings. You can now add this<br />
monitor to a monitor group. Refer to Adding Monitors to a<br />
Monitor Group in Chapter 4.<br />
Chapter 5: Configuring Monitors 351
Configuring URL Monitors<br />
Specifying Advanced Settings<br />
Use the Advanced tab to specify cookies, proxy server, authentication, and<br />
user agent settings.<br />
Report on – Lets you check the amount of time it takes to download the<br />
file/content or the size of the file. Once you know the file size you can<br />
create an alert to check whether the size is greater than expected.<br />
Download Time – Returns the download time.<br />
Download File Size – Returns the size of the file.<br />
Perl Expression – Specifies the Perl Expression to use to retrieve<br />
the file size or match a string from a url.<br />
352 <strong>OneSight</strong> <strong>Administrator</strong> <strong>Guide</strong>
Configuring URL Monitors<br />
String Mappings – Use this button to display the String Mappings<br />
dialog box for entering a string that should be returned for the<br />
query you specified.<br />
<strong>OneSight</strong> collects numeric performance data. If you are<br />
measuring a string representing a string datatype, it can be<br />
converted to a number for use in <strong>OneSight</strong> by using the String<br />
Mappings field. Specify a semicolon delimited mapping of<br />
strings to integers. For example, ―false=0;true=1‖ converts a false<br />
reading to a zero value in <strong>OneSight</strong>. If you only want to display<br />
the string on the <strong>OneSight</strong> status page, use a colon, rather than a<br />
semi-colon to delimit the values.<br />
Note that data that has a colon cannot be used in string mapping.<br />
Cookies – <strong>OneSight</strong> can control how cookies are used as part of this<br />
monitor.<br />
No Cookies – Select this option if you want the URL test to<br />
prevent the use of cookies when accessing the page.<br />
Support Cookies – Select this option if you want to allow the URL<br />
monitor to support cookies as part of the URL request. A fresh<br />
cookie is retrieved each time the test is run.<br />
Use the Following Cookies Value – Type in a cookie value for the<br />
page you are monitoring. If you supply a particular value,<br />
remember that the cookie is saved and can become out of date.<br />
Refresh cookie requests are ignored.<br />
Host Header Specification<br />
Specify an HTTP Host Header – Select this option if you want to<br />
define an HTTP Host Header. When selected, the monitor uses<br />
the IP Address specified in the URL Address and the header<br />
specified in the HTTP Host Header field. When cleared, the<br />
monitor uses the host specified in the URL Address field. Use this<br />
option if you have a single IP that hosts multiple web sites.<br />
Chapter 5: Configuring Monitors 353
Configuring URL Monitors<br />
HTTP Host Header – Specify the value to look for in the ―Host:‖<br />
field in the HTTP Get Request. For example, if you host web sites<br />
www.mywebsite.com and www.myotherwebsite.com using IP<br />
address 255.255.001.001, specify http://255.255.001.001 as the<br />
URL Address and www.mywebsite.com or<br />
www.myotherwebsite.com as the HTTP Host Header value.<br />
User Agent – You can specify a particular user agent when you monitor a<br />
URL. When you configure a User Agent, the browser and operating<br />
system you specify is added to the header of the URL request. This allows<br />
you to test pages designed for a specific browser URL or confirm that a<br />
page designed for multiple browsers works appropriately for each of them.<br />
If you select a browser from the list, <strong>OneSight</strong> displays (in parentheses)<br />
the user agent string that will be inserted in the header of the URL<br />
request.<br />
You can also specify a custom string. Select and type in the<br />
browser and operating system specification you want to include in the<br />
header of the URL request.<br />
Retries – Sets the upper limit for the number of times a URL request is<br />
retried due to any failure. For example, if Retries is set to 3, the URL<br />
request will be sent up to four times (the initial try plus three retries).<br />
After the fourth try, if no response is received, the URL check is treated as<br />
a sample failure.<br />
Test – When you add or modify a monitor, you can test General and<br />
Advanced settings to determine if they are set appropriately. After<br />
clicking the Test button, you will see messages in the status window as the<br />
test runs and when the test completes.<br />
To add an HTTP parameter to a URL:<br />
1. In the Add HTTP Parameter dialog box, type in the name of the<br />
parameter you want to include with the Get or Post operation.<br />
354 <strong>OneSight</strong> <strong>Administrator</strong> <strong>Guide</strong>
Configuring URL Monitors<br />
2. Type in the value for the parameter. For example, if you wanted<br />
to reference a page that was reached with the string<br />
http://search.yahoo.com/bin/search?p=electronics, you would add p<br />
for the Name and electronics for the Value.<br />
Specifying Proxy Settings<br />
Use the Proxy tab to specify proxy server and authentication settings.<br />
Authentication Settings – Fill in User Name and Password information<br />
to monitor URLs with HTTP Basic Authentication restrictions.<br />
User Name – If the URL specified requires a name and password<br />
for access, enter the name in this field.<br />
Password – If the URL specified requires a name and password<br />
for access, enter the password in this field.<br />
Chapter 5: Configuring Monitors 355
Configuring <strong>OneSight</strong> Virtual Agent Monitors<br />
Proxy Server Settings – If your network makes use of a proxy server, you<br />
can specify this information here. Check Use a proxy server and add the<br />
information below.<br />
If you find that a <strong>OneSight</strong> URL monitor fails to reach a URL when your<br />
browser successfully connects to the same URL, check your proxy server<br />
settings in your browser. For example, in Internet Explorer, select<br />
Internet Options from the Tools menu and then click LAN settings on<br />
the Connections tab. If proxy server settings are configured for your<br />
browser, they may also need to be configured for the URL monitor.<br />
Use a proxy server – When selected, <strong>OneSight</strong> uses the specified<br />
proxy server for this monitor.<br />
Proxy Host – The name or IP address of the proxy server.<br />
Port – The port of the proxy server.<br />
Proxy User Name – The proxy server login user name.<br />
Password – The proxy server login password.<br />
Configuring <strong>OneSight</strong> Virtual Agent Monitors<br />
You can set up <strong>OneSight</strong> Virtual Agent monitors to run an<br />
executable program from the command line of the system. You<br />
specify a Perl expression to return metrics from the command.<br />
<strong>OneSight</strong> Virtual Agent is an easy way to execute operating system<br />
or custom programs on a host and return specific metrics. The<br />
<strong>OneSight</strong> Virtual Agent monitor executes at specified time<br />
intervals.<br />
At specified time intervals, the <strong>OneSight</strong> Virtual Agent monitor<br />
executes the specified command. The monitor sets an alert if unable<br />
to execute the command.<br />
Note: If you are using SSH private key files or using SSH with a user<br />
name and password, you must download the OpenSSH ganymed-<br />
356 <strong>OneSight</strong> <strong>Administrator</strong> <strong>Guide</strong>
Configuring <strong>OneSight</strong> Virtual Agent Monitors<br />
ssh2-build.jar file from the Cleondris web site at<br />
http://www.cleondris.ch/opensource/ssh2/. Once downloaded, copy the<br />
file to the C:\Empirix\DataCollector\webapps\ROOT\WEB-INF\lib<br />
directory then restart the data collector to load the .jar file.<br />
If you are using SSH private key files or using SSH with a user name<br />
and password and the PasswordAuthentication setting in the<br />
sshd_config file is set to no on the Unix server, <strong>OneSight</strong> will fail.<br />
See http://www.cleondris.ch/opensource/ssh2/FAQ.html#passwordauth for<br />
more information.<br />
In the Add Monitor dialog box, when you click <strong>OneSight</strong> Virtual<br />
Agent in the Monitor Types box, settings to configure a <strong>OneSight</strong><br />
Virtual Agent monitor appear on these dialog box tabs:<br />
General Tab – Contains the options that you can use to create a<br />
<strong>OneSight</strong> Virtual Agent monitor for your monitor group.<br />
Alerts Tab – Displays the options that you can use to define alerts<br />
and associate them with action plans. You can also configure how a<br />
<strong>OneSight</strong> Virtual Agent alert will affect the monitor group’s health.<br />
It can result in a Warning state, a Critical state, or can have no<br />
impact on health.<br />
Locations Tab – Specifies the Data Collector Location from which<br />
the <strong>OneSight</strong> Virtual Agent monitor executes the command.<br />
SmartLinks Tab – Contains the options for specifying a link to<br />
associate with a particular monitor or metric.<br />
Attributes Tab – Contains the options for specifying which attributes<br />
are applied to this monitor for Status page sorting.<br />
Monitor Groups Tab – Contains the options that you can use to<br />
specify which monitor groups the monitor is used with. This tab is<br />
available when you open the Add Monitor window by selecting<br />
Monitors from the Configure menu. It is not available when you<br />
open the Add Monitor window from the Monitor Group Editor.<br />
Chapter 5: Configuring Monitors 357
Configuring <strong>OneSight</strong> Virtual Agent Monitors<br />
Access Control Tab – Contains the options for specifying which user<br />
groups have read, write, and delete permissions for this monitor.<br />
Down Time Tab – Contains the options for applying downtime to<br />
this monitor.<br />
Each monitor that you create must have a unique name. In the<br />
Monitor Name box, <strong>OneSight</strong> creates a unique name for the current<br />
monitor by combining the name of the monitor type with the name<br />
of the host to which the monitor applies. To change the default<br />
assigned name, type a unique monitor name that helps you to<br />
identify what this monitor does.<br />
To create a <strong>OneSight</strong> Virtual Agent monitor:<br />
1. On the Monitors Page, click Add to open the Add Monitor<br />
dialog box.<br />
358 <strong>OneSight</strong> <strong>Administrator</strong> <strong>Guide</strong>
Configuring <strong>OneSight</strong> Virtual Agent Monitors<br />
2. The Monitor Types box lists all of the types of monitors that<br />
can be applied to your monitor group. Click <strong>OneSight</strong> Virtual<br />
Agent to add a monitor that confirms that a host is responding.<br />
Use settings on the General tab to configure each <strong>OneSight</strong><br />
Virtual Agent monitor.<br />
Use the options on this tab to specify how the <strong>OneSight</strong> Virtual<br />
Agent monitor will attempt to execute the command.<br />
Import/Export – Click this button to display the Import Export<br />
Monitors dialog box for importing or exporting monitors of this<br />
type. Refer to ―Exporting and Importing Monitors,‖ later in this<br />
chapter for more information.<br />
Description – Specifies a description of the <strong>OneSight</strong> Virtual<br />
Agent monitor.<br />
Host Name – Specifies the name or IP address of the host on<br />
which to execute the command.<br />
Chapter 5: Configuring Monitors 359
Configuring <strong>OneSight</strong> Virtual Agent Monitors<br />
Operating System – Select the operating system being used on<br />
the host machine.<br />
Charset – Specifies the character set to use for the Virtual<br />
Agent. Select a character set from the list.<br />
ISO-8859-1 – Latin alphabet for Western European languages<br />
such as Basque, Catalan, Danish, Dutch, English, Faeroese,<br />
Finnish, French, German, Icelandic, Irish, Italian, Norwegian,<br />
Portuguese, Rhaeto-Romanic, Scottish, Spanish, Swedish,<br />
Albanian, Afrikaans, and Swahili.<br />
ISO-8859-13 – Baltic Rim languages.<br />
ISO-8859-15 – Latin alphabet for Western European<br />
languages.<br />
ISO-8859-2 – Central and Eastern European languages that<br />
use a Roman alphabet, including Polish, Czech, Slovak,<br />
Slovenian, and Hungarian.<br />
ISO-8859-4 – Latin alphabet for Estonian, Latvian,<br />
Lithuanian, Greenlandic, and Sami.<br />
ISO-8859-5 – Most Slavic languages that use a Cyrillic<br />
alphabet including Belarusian, Bulgarian, Macedonian,<br />
Russian, Serbian, and Ukranian.<br />
ISO-8859-7 – Greek.<br />
ISO-8859-9 – Latin alphabet for Western European languages,<br />
similar to ISO 8859-1 with the Icelandic letters replaced with<br />
Turkish letters. It is also used for Kurdish.<br />
K018-R – Cyrillic<br />
US-ASCII – United States.<br />
UTF-16 – Unicode 16 bit.<br />
360 <strong>OneSight</strong> <strong>Administrator</strong> <strong>Guide</strong>
Configuring <strong>OneSight</strong> Virtual Agent Monitors<br />
UTF-16BE – Unicode big-endian.<br />
UTF-16LE – Unicode little-endian.<br />
UTF-8 – Unicode 8 bit mostly used for HTML.<br />
Windows 1250 – Microsoft Windows Code Page for Central<br />
European Latin alphabet languages.<br />
Windows 1251 – Microsoft Windows Code Page for Russian<br />
and other Cyrillic languages.<br />
Windows 1252 – Microsoft Windows Code Page for Western<br />
European languages.<br />
Windows 1253 – Microsoft Windows Code Page for Greek.<br />
Windows 1254 – Microsoft Windows Code Page for Turkish.<br />
Windows 1257 – Microsoft Windows Code Page for Baltic.<br />
Cp500 – EBCDIC 500 VI.<br />
Metric – Specifies the metric to measure. If you select a<br />
predefined metric for one of the operating systems, the<br />
Command and Perl Expression are automatically entered. If you<br />
select Custom Setting, you enter the Command and Perl<br />
Expression manually.<br />
Command – Specifies the command to execute on the host<br />
machine. If you select Custom Setting for the Metric, enter the<br />
path, filename, and command line arguments for the executable<br />
program.<br />
If your application requires two levels of telnet/SSH session,<br />
you can set up your monitor using a shell script that makes use<br />
of the SSH or RSH commands or you can use a state machine as<br />
described in “Configuring State Machines”.<br />
Chapter 5: Configuring Monitors 361
Configuring <strong>OneSight</strong> Virtual Agent Monitors<br />
For example, if <strong>OneSight</strong> can connect to machine1, but the<br />
command requires data from machine2, then either set up a<br />
script or an SSH/RSH command to run the second connection.<br />
The following example uses SSH directly:<br />
host field: machine1<br />
command: /usr/local/bin/ssh –1 machine2<br />
<br />
Perl Expression – Specifies a Perl expression to use to report the<br />
data returned from the executable program. See Using Regular<br />
Expressions for Pattern Matching for more information about<br />
specifying Perl expressions.<br />
Process remote server response as a single block – When<br />
selected, all output is treated as a single block of data. The<br />
default is to treat output as one line at a time.<br />
Unit Measure – Specifies the unit of measurement: none,<br />
percentage, bytes, hours, minutes or seconds.<br />
Connection Method – Specifies the protocol to use to execute<br />
the command. Telnet and SSH are not currently supported for<br />
Windows. You can use the Local protocol to monitor a remote<br />
machine if you have a Data Collector installed on that machine.<br />
Port – Specifies the port to use to execute the command.<br />
User Name – Specify a user name to log into an account on the<br />
host system.<br />
Password – Specify the password required to log into the User<br />
Name account on the system or if you are using a private key<br />
file, enter the password to use to unlock the key file if it is<br />
password protected.<br />
Prompt – Specify the command line prompt for the host<br />
machine. If you do not specify a command line prompt,<br />
<strong>OneSight</strong> will attempt to infer the prompt by parsing the screen<br />
output.<br />
362 <strong>OneSight</strong> <strong>Administrator</strong> <strong>Guide</strong>
Configuring <strong>OneSight</strong> Virtual Agent Monitors<br />
Private key file – Enter the name of the private key file if it is<br />
located in the <strong>OneSight</strong> installation directory or enter the full<br />
path to the private key file if it is located elsewhere.<br />
Note: The private key file must match the server side public<br />
key. The format must be OpenSSH. The file can be generated<br />
using ssh-keygen or by exporting an OpenSSH key from<br />
PuTTYgen.<br />
Login Procedure – Select the state machine containing the XML<br />
for logging in. This is useful, for example, when you are<br />
logging into one machine and then logging in to another<br />
machine. Refer to “Configuring State Machines,” at the end of<br />
this section for more information.<br />
Browse – Opens the Virtual Agent State Machines dialog box<br />
for editing state machine configurations.<br />
Command Procedure – Select the state machine containing the<br />
XML for running a complex command. This is useful, for<br />
example, when you want to run a different command depending<br />
on the output of a previous command. Refer to “Configuring<br />
State Machines,” at the end of this section for more<br />
information.<br />
Browse – Opens the Virtual Agent State Machines dialog box<br />
for editing state machine configurations.<br />
Sample Every: – Specifies how often samples are<br />
taken for this monitor. Refer to, ―Sample Every Settings,‖ later<br />
in this chapter for a description of these settings.<br />
String Mappings – Displays the String Mappings dialog box.<br />
<strong>OneSight</strong> collects numeric performance data. If you are<br />
measuring a response from a <strong>OneSight</strong> Virtual Agent that is<br />
represented a string, it can be converted to a number for use in<br />
<strong>OneSight</strong> by using the String Mappings field. Simply specify a<br />
semicolon delimited mapping of Strings to Integers. For<br />
Chapter 5: Configuring Monitors 363
Configuring <strong>OneSight</strong> Virtual Agent Monitors<br />
example, "false=0;true=1" will convert a "false" reading to a 0<br />
value in <strong>OneSight</strong>, and this will be displayed in <strong>OneSight</strong> Status<br />
as "false=0". If you wish to just display the string in <strong>OneSight</strong><br />
Status, use a colon, rather than a semicolon, to delimit your<br />
values.<br />
If you neglect to provide a mapping for a specific string,<br />
<strong>OneSight</strong> will consider this a Sample Failure, and report the<br />
String that was returned.<br />
String Mappings can also be used to translate a number to a<br />
String for display in <strong>OneSight</strong> Status. This is helpful when<br />
numbers represent an objects state.<br />
Note that string matching is case-insensitive and data that has a<br />
colon cannot be used in string mapping.<br />
Test – When you add or modify a monitor, you can test General<br />
and Advanced settings to determine if they are set<br />
appropriately. After clicking the Test button, you will see<br />
messages in the status window as the test runs and when the test<br />
completes.<br />
3. Each monitor that you add must have a unique name. You can<br />
let <strong>OneSight</strong> create a unique name using the <strong>OneSight</strong> Virtual<br />
Agent specifications you supply, or you can type in your own<br />
name for the monitor.<br />
4. On the General tab, type in the host name for the server you<br />
want to monitor. This value specifies the name or IP address of<br />
the host on which to execute the command.<br />
5. Enter the user name and password required to access the host<br />
machine.<br />
6. Select the operating system in use on the host machine.<br />
7. Select the metric to monitor on the host machine. If you select a<br />
predefined metric for one of the operating systems, the<br />
364 <strong>OneSight</strong> <strong>Administrator</strong> <strong>Guide</strong>
Configuring <strong>OneSight</strong> Virtual Agent Monitors<br />
Command and Perl Expression are automatically entered. If you<br />
select Custom Setting, enter the Command and Pearl<br />
Expression manually.<br />
8. Specify how often to execute the command in the Sample Every<br />
field.<br />
9. Select the protocol to use to execute the command on the host<br />
machine.<br />
10. Specify the port to use to execute the command on the host<br />
machine.<br />
11. To verify that the monitor will work as configured, click the<br />
Test button. The Monitor Test window provides information<br />
about the success or failure of the test and indicates what may<br />
be causing any problem.<br />
12. If the test succeeds, click OK in the Add Monitor dialog box to<br />
save these basic <strong>OneSight</strong> Virtual Agent monitor settings. You<br />
can now add this monitor to a monitor group. Refer to Adding<br />
Monitors to a Monitor Group in Chapter 4.<br />
Configuring State Machines<br />
The Configure State Machines page lists the state machines<br />
available for use in Virtual Agent Monitoring. State Machines are<br />
used when additional commands must be issued prior to gathering<br />
<strong>OneSight</strong> monitoring data. For example, an additional login may be<br />
required to tunnel in to another machine, or you may need to run a<br />
script on a system where a shell script or batch file cannot be<br />
installed.<br />
State machines appear within the Virtual Agent monitoring UI as<br />
either a Login Procedure or Command Procedure drop down list. A<br />
state machine can be shared across multiple Virtual Agent monitors.<br />
Chapter 5: Configuring Monitors 365
Configuring <strong>OneSight</strong> Virtual Agent Monitors<br />
To configure a state machine:<br />
1. Click the Configure menu.<br />
2. Click Monitors.<br />
3. Select a Virtual Agent monitor or create a new one.<br />
4. Click Browse next to either the Login Procedure or Command<br />
Procedure field.<br />
Add – Displays the Add Virtual Agent State Machine dialog<br />
box for adding a new state machine.<br />
Modify – Displays the Modify Virtual Agent State Machine<br />
dialog box for changing the selected state machine.<br />
Clone – Creates a copy of the selected state machine.<br />
Remove – Removes the selected state machine.<br />
Used by – Displays a list of monitors using this state machine.<br />
Name – The Name column identifies the state machine.<br />
User Group – displays the user group to which this state<br />
machine belongs.<br />
366 <strong>OneSight</strong> <strong>Administrator</strong> <strong>Guide</strong>
Configuring <strong>OneSight</strong> Virtual Agent Monitors<br />
5. Click Add.<br />
General Tab<br />
Name – Enter the name of the state machine. this name appears<br />
in the State Machine drop-down list, so it should be a brief (40<br />
characters or less) description of the state machine.<br />
Virtual Agent State Machine Content – This section is used for<br />
the state machine XML contents as described below.<br />
Access Control Tab<br />
User Group – Displays the user group names.<br />
Owner – The user group for this state machine. A state machine<br />
can be directly owned by a single user group.<br />
Global Read – Gives read access to this user group and all of its<br />
sub user groups.<br />
Read – Gives read permission to the user group.<br />
Write – Gives write permission to the user group.<br />
Delete – Gives delete permission to the user group.<br />
Chapter 5: Configuring Monitors 367
Configuring <strong>OneSight</strong> Virtual Agent Monitors<br />
6. Enter the XML as described below.<br />
7. Click OK.<br />
The State Machine<br />
The state machine lets you define a set of control branch points, or<br />
states. These states are named by you. <strong>OneSight</strong> provides the<br />
following pre-defined states to which you can add transitions:<br />
START – This is the initial state for the virtual agent. It waits in<br />
this state until it receives its first input, generally a login prompt.<br />
END – This state has no outbound transitions. If another state<br />
transitions to the END state, then the state machine is ended, and<br />
the virtual agent sends commands and receives unprocessed<br />
responses.<br />
Transitions – Each state has a set of rules or transitions associated<br />
with it. These transitions define what the agent will do given a<br />
specific response or prompt from the remote system. A transition is<br />
defined by a triple . This<br />
means that if the data received from the remote system matches the<br />
specified input pattern, then send the output string, and proceed to<br />
the state specified by next state. If two transitions have overlapping<br />
regular expressions, then the state machine picks the first transition<br />
that matches the input data.<br />
Input pattern – The input pattern is a perl style regular expression. If<br />
the expression is matched, the transition is executed. If more than<br />
one transition’s input pattern matches the same input, the result is<br />
non-deterministic, that is only one transition will trigger, not both.<br />
Output string – The output string is a string send via the telnet/ssh<br />
channel to the remote system upon matching a transition. The<br />
%username% and %password% substitution variables can be used to<br />
fill in the user name and password fields.<br />
368 <strong>OneSight</strong> <strong>Administrator</strong> <strong>Guide</strong>
Configuring <strong>OneSight</strong> Virtual Agent Monitors<br />
Next state – The next state is the name of the state that should be<br />
transitioned to once the output string has been transmitted. If the<br />
next state is END then the state machine terminates.<br />
Special Transition – Each state can have a single timeout transition<br />
associated with it. If the time specified by the timeout elapses<br />
before any acceptable data has been received, the state machine<br />
transitions to the timeout state. In most cases, the timeout state is<br />
END. A default timeout is used for any state that does not have a<br />
timeout transition.<br />
XML Format<br />
<br />
A state machine can contain any number of state objects. It can<br />
have the following attributes:<br />
Name = [string] – the name of the state.<br />
Timeout = [integer] – the time in msec for state timeout<br />
(optional).<br />
<br />
Indicates that a block of state transitions are to follow. There can be<br />
only one transitions tag per state.<br />
<br />
Specifies an individual transition. It can have the following<br />
attributes:<br />
PerlExpression = [String] – The Perl expression that defines<br />
the pattern match under which this transition will be active.<br />
NewState = [String] – The name of the next state to go to if<br />
this transition is satisfied.<br />
Chapter 5: Configuring Monitors 369
Configuring <strong>OneSight</strong> Virtual Agent Monitors<br />
Example<br />
OutputString = [String] – The string to be sent to remote side<br />
before the transition to the next state.<br />
<br />
<br />
<br />
<br />
<br />
<br />
<br />
<br />
<br />
<br />
<br />
<br />
<br />
Configuring <strong>OneSight</strong> Voice Quality - Basic Profile Monitors<br />
<br />
<br />
<br />
<br />
<br />
<br />
<br />
<br />
<br />
<br />
<br />
<br />
<br />
<br />
Configuring <strong>OneSight</strong> Voice Quality - Basic<br />
Profile Monitors<br />
You can set up a <strong>OneSight</strong> Voice Quality - Basic Profile monitor to<br />
collect voice quality metrics. The originate and answer VQ Probes<br />
must be installed and connected to <strong>OneSight</strong>. Refer to the VQ Probe<br />
documentation for information about installing the VQ Probe, and<br />
“Chapter 16” of this guide for information on configuring the VQ<br />
Probe in <strong>OneSight</strong>.<br />
Chapter 5: Configuring Monitors 371
Configuring <strong>OneSight</strong> Voice Quality - Basic Profile Monitors<br />
Note: If you modify a monitor when a call is in progress, the call in<br />
progress may be terminated when the modification is applied. This<br />
applies to all modifications, including changes to the sample<br />
frequency.<br />
In the Add Monitor dialog box, when you click <strong>OneSight</strong> Voice<br />
Quality - Basic in the Monitor Types box, settings to configure a<br />
<strong>OneSight</strong> Voice Quality monitor appear on these dialog box tabs:<br />
General Tab – Contains the options that you can use to define the<br />
system identification and authentication settings for a <strong>OneSight</strong><br />
Voice Quality - Basic Profile monitor for your monitor group.<br />
Attributes Tab – Contains the options for specifying which attributes<br />
are applied to this monitor for Status page sorting.<br />
Monitor Groups Tab – Contains the options that you can use to<br />
specify which monitor groups the monitor is used with. This tab is<br />
available when you open the Add Monitor window by selecting<br />
Monitors from the Configure menu. It is not available when you<br />
open the Add Monitor window from the Monitor Group Editor.<br />
Access Control Tab – Contains the options for specifying which user<br />
groups have read, write, and delete permissions for this monitor.<br />
Down Time Tab – Contains the options for applying downtime to<br />
this monitor.<br />
Each monitor that you create must have a unique name. In the<br />
Monitor Name box, <strong>OneSight</strong> creates a unique name for the current<br />
monitor by combining the name of the monitor type with the name<br />
of the host and the <strong>OneSight</strong> Voice Quality - Basic Profile metric.<br />
To change the default assigned name, type a unique monitor name<br />
that helps you to identify what this monitor does.<br />
372 <strong>OneSight</strong> <strong>Administrator</strong> <strong>Guide</strong>
Configuring <strong>OneSight</strong> Voice Quality - Basic Profile Monitors<br />
To create a <strong>OneSight</strong> Voice Quality - Basic Profile monitor:<br />
1. On the Monitors Page, click Add to open the Add Monitor<br />
dialog box.<br />
2. The Monitor Types box lists all of the types of monitors that<br />
can be applied to your monitor group. Click <strong>OneSight</strong> Voice<br />
Quality - Basic.<br />
Use the options on this tab to configure the monitor. The dial<br />
numbers listed in the drop downs are those that were configured<br />
using the VQ Probe configuration page. The VQ Probe<br />
configuration page can be accessed by clicking the Edit Config<br />
buttons.<br />
Originate Probe – Select the VQ Probe that will place the call.<br />
Edit Config – Displays the VQ Probe configuration dialog box<br />
for editing the selected probe.<br />
Chapter 5: Configuring Monitors 373
Configuring <strong>OneSight</strong> Voice Quality - Basic Profile Monitors<br />
Extension Usage – Displays the list of extensions assigned to<br />
this probe and indicates whether they are in use or not. If they<br />
are in use, the dialog box displays which monitor is using the<br />
extension and whether it is being used as an originate or answer<br />
extension.<br />
Originate Extension – Select the phone number corresponding to<br />
the VQ Probe channel that will place the call. Once an<br />
extension has been used as an originate extension, it cannot be<br />
used as an answer extension for any Voice Quality Basic<br />
monitors. It can; however, be used as an originate extension for<br />
other Voice Quality Basic monitors. Only extensions that are<br />
available for use as originate extensions are displayed in the<br />
list.<br />
Answer Probe – Select the VQ Probe that will answer the call. If<br />
you are using an alternative dial number, you can also select<br />
from the top of the list to let the answering number<br />
determine which probe answers the call.<br />
Edit Config – Displays the VQ Probe configuration dialog box<br />
for editing the selected probe.<br />
Extension Usage – Displays the list of extensions assigned to<br />
this probe and indicates whether they are in use or not. If they<br />
are in use, the dialog box displays which monitor is using the<br />
extension and whether it is being used as an originate or answer<br />
extension.<br />
Answer Extension – Select the phone number of the Answer<br />
Probe. If you are not using an alternative dial number, this is the<br />
number that the Originate Probe will dial. If you are using an<br />
alternative dial number, it is the number dialed by the Originate<br />
Probe. Only extensions that are available for use as answer<br />
extensions are displayed in the list. If you have selected <br />
in the Answer Probe field, no numbers will be available for<br />
selection.<br />
374 <strong>OneSight</strong> <strong>Administrator</strong> <strong>Guide</strong>
Configuring <strong>OneSight</strong> Voice Quality - Basic Profile Monitors<br />
Once an extension has been used as an answer extension, it<br />
cannot be used as an originate extension for any Voice Quality<br />
Basic monitors. It can; however, be used as an answer<br />
extension for other Voice Quality Basic monitors.<br />
Alternate Dial Number – Select this check box if an alternative<br />
dial number is being used to call agents. When checked, <br />
is added to the top of the Answer Probe dropdown list. Refer to<br />
“Chapter 16” for a description of the possible configurations.<br />
– Select the dial number to use.<br />
Edit Dial Numbers – Displays the VQ Configuration For Dial<br />
Numbers dialog box and imports the list.<br />
Sample Every: Advanced– Specifies how often<br />
samples are taken for this monitor. Refer to, ―Sample Every<br />
Settings,‖ later in this chapter for a description of these settings.<br />
Note: The sample frequency for Voice Quality Basic monitors<br />
cannot be less than five minutes.<br />
Sample as soon as possible – When you are using the x@y<br />
format, causes the monitor to sample as soon as it can. For<br />
example, if you specified 40@5 and the monitor was started at<br />
12:10, the first sample would normally be at 1:05. If this<br />
checkbox is selected, the first sample will be at 12:45.<br />
3. Each monitor that you add must have a unique name. You can<br />
let <strong>OneSight</strong> create a unique name using the <strong>OneSight</strong> Voice<br />
Quality specifications you supply, or you can type in your own<br />
name for the monitor.<br />
4. Select the originate VQ Probe and its extension.<br />
5. Select the Alter. Dial Number check box if you are using an<br />
alternative dial number and select the number to use. You can<br />
configure and import the list of dial numbers by clicking the<br />
Edit Dial Numbers button.<br />
Chapter 5: Configuring Monitors 375
Configuring <strong>OneSight</strong> Voice Quality - Advanced Profile Monitors<br />
6. Select the answer VQ Probe and its extension.<br />
7. Select the CallMaster script to use or click Import to import a<br />
script.<br />
8. Enter how often to sample this monitor.<br />
9. To verify that the monitor will work as configured, click the<br />
Test button. The Monitor Test window provides information<br />
about the success or failure of the test and indicates what may<br />
be causing any problem.<br />
Note: System monitor output is not displayed when a G5 or<br />
FX/TDM system originates the call.<br />
10. If the test succeeds, click OK in the Add Monitor dialog box to<br />
save these basic <strong>OneSight</strong> Voice Quality - Basic Profile<br />
monitor settings. You can now add this monitor to a monitor<br />
group. Refer to Adding Monitors to a Monitor Group in<br />
Chapter 4.<br />
Configuring <strong>OneSight</strong> Voice Quality - Advanced<br />
Profile Monitors<br />
The <strong>OneSight</strong> Voice Quality - Advanced Profile Monitor lets you<br />
collect script metrics, such as IVR Response Time steps, and<br />
combine them with Voice Quality metrics when a VQ Probe Icon is<br />
included in the CallMaster script. A VQ Probe icon can be added at<br />
the end of an existing <strong>OneSight</strong> Voice Transaction script or you can<br />
add additional telephony icons to the VQ Probe Originate Call<br />
sample project.<br />
If you are modifying the sample project and if you are navigating<br />
through an IVR, you can enter the IVR data in the Navigate IVR<br />
diagram. Refer to the Hammer CallMaster documentation for more<br />
information about creating scripts.<br />
376 <strong>OneSight</strong> <strong>Administrator</strong> <strong>Guide</strong>
Configuring <strong>OneSight</strong> Voice Quality - Advanced Profile Monitors<br />
If you have your own CallMaster server, you can create a <strong>OneSight</strong><br />
Voice Quality - Advanced Profile monitor in <strong>OneSight</strong> to verify the<br />
performance of your telephony-based voice transaction systems.<br />
The originate and answer VQ Probes must be installed and<br />
connected to <strong>OneSight</strong>. Refer to the VQ Probe documentation for<br />
information about installing the VQ Probe, and “Chapter 16” of<br />
this guide for information on configuring the VQ Probe in<br />
<strong>OneSight</strong>.<br />
Note: The Hammer CallMaster server and the proxy server must be<br />
version 5.4 or later.<br />
The <strong>OneSight</strong> Voice Quality - Advanced Profile monitor lets you<br />
select which steps you want to test in the script.<br />
The <strong>OneSight</strong> Voice Quality - Advanced Profile monitor retrieves<br />
data for the monitors you have configured within your <strong>OneSight</strong><br />
Voice Engine.<br />
In the Add Monitor dialog box, when you click <strong>OneSight</strong> Voice<br />
Quality - Advanced Profile in the Monitor Types box, settings to<br />
configure a <strong>OneSight</strong> Voice Quality - Advanced Profile monitor<br />
appear on these dialog box tabs:<br />
General Tab – Contains the options that you can use to create a<br />
<strong>OneSight</strong> Voice Quality - Advanced Profile monitor for your call<br />
center.<br />
Alerts Tab – Shows what action plan will be used when an alert<br />
occurs. Options on this tab allow you to set up or modify an action<br />
plan that responds to alerts generated by the current <strong>OneSight</strong><br />
Voice Quality - Advanced Profile monitor. You can also configure<br />
how an alert will affect the monitor group’s health. It can result in a<br />
Warning state, a Critical state, or can have no impact on health.<br />
Locations Tab – Specifies the Data Collector Location from which<br />
the CallMaster script will run.<br />
Chapter 5: Configuring Monitors 377
Configuring <strong>OneSight</strong> Voice Quality - Advanced Profile Monitors<br />
Attributes Tab – Contains the options for specifying which attributes<br />
are applied to this monitor for Status page sorting.<br />
Monitor Groups Tab – Contains the options that you can use to<br />
specify which monitor groups the monitor is used with. This tab is<br />
available when you open the Add Monitor window by selecting<br />
Monitors from the Configure menu. It is not available when you<br />
open the Add Monitor window from the Monitor Group Editor.<br />
Access Control Tab – Contains the options for specifying which user<br />
groups have read, write, and delete permissions for this monitor.<br />
Down Time Tab – Contains the options for applying downtime to<br />
this monitor.<br />
Monitor Name – Each monitor that you create must have a unique<br />
name. In the Monitor Name box, <strong>OneSight</strong> creates a unique name<br />
for the current monitor by combining the name of the monitor type<br />
with the name of the host to which the monitor applies. To change<br />
the default assigned name, type a unique monitor name that helps<br />
you to identify what this monitor does.<br />
Profile – Lists the profiles that are available to apply to this monitor.<br />
Multiple profiles may be listed if you have upgraded from a<br />
previous version of <strong>OneSight</strong>.<br />
Modify – Displays the <strong>OneSight</strong> Profile Editor that lets you add and<br />
remove metrics, and configure alerts, smartlinks, and attributes for<br />
this profile.<br />
Note: When you modify alerts for <strong>OneSight</strong> Voice Quality -<br />
Advanced Profile monitors, you must select Override profile in the<br />
Alert Editor to make the fields available. Any changes that you<br />
make will apply to this monitor only, not to the profile itself.<br />
To create a <strong>OneSight</strong> Voice Quality - Advanced Profile monitor:<br />
378 <strong>OneSight</strong> <strong>Administrator</strong> <strong>Guide</strong>
Configuring <strong>OneSight</strong> Voice Quality - Advanced Profile Monitors<br />
1. On the Monitors Page, click Add to open the Add Monitor<br />
dialog box.<br />
2. The Monitor Types box lists all of the types of monitors that<br />
can be applied to your monitor group. Click <strong>OneSight</strong> Voice<br />
Quality - Advanced to add a monitor that checks the availability<br />
and responsiveness of a selected monitor from the <strong>OneSight</strong><br />
Voice Transaction service. You will use settings on the General<br />
tab to configure a <strong>OneSight</strong> Voice Quality - Advanced Profile<br />
monitor.<br />
Script – Displays the script being used.<br />
Import – Displays the Import CallMaster script dialog box for<br />
selecting the script you want to use.<br />
Note: If you are using the phonebook on a Hammer G5, and you<br />
update the phonebook, the new numbers will not take effect<br />
Chapter 5: Configuring Monitors 379
Configuring <strong>OneSight</strong> Voice Quality - Advanced Profile Monitors<br />
until you click OK on the VQ Probes configuration page in<br />
<strong>OneSight</strong>.<br />
Edit Steps – Displays the Script Steps dialog box for selecting<br />
the units to use to evaluate the script steps.<br />
Parameters – Displays the Input Parameter dialog box for<br />
entering an input parameter. For example, if you have a script<br />
that needs to place a call, you can enter one or more numbers in<br />
the input parameter list. This button is only available when the<br />
script requires input parameters.<br />
Voice Resource – Displays the Voice Resource Editor dialog<br />
box for specifying the CallMaster servers and channels to use<br />
as voice resources.<br />
Scenario Name – Specifies the name of the scenario.<br />
Retries – Specifies the number of times to retry the script if the<br />
script fails.<br />
Sample Every: – Specifies how often samples are<br />
taken for this monitor. Refer to, ―Sample Every Settings,‖ later<br />
in this chapter for a description of these settings.<br />
Sample as soon as possible – When you are using the x@y<br />
format, causes the monitor to sample as soon as it can. For<br />
example, if you specified 40@5 and the monitor was started at<br />
12:10, the first sample would normally be at 1:05. If this<br />
checkbox is selected, the first sample will be at 12:45.<br />
3. Each monitor that you add must have a unique name. You can<br />
let <strong>OneSight</strong> create a unique name using the <strong>OneSight</strong> Voice<br />
Transaction specifications you supply, or you can type in your<br />
own name for the monitor.<br />
4. Click the Import button to display the Import CallMaster script<br />
dialog box.<br />
380 <strong>OneSight</strong> <strong>Administrator</strong> <strong>Guide</strong>
Configuring <strong>OneSight</strong> Voice Quality - Advanced Profile Monitors<br />
Script – Enter the script path or click Browse.<br />
Browse – Displays the Choose File dialog box for selecting a<br />
script.<br />
5. Select the script and click OK.<br />
This dialog box lets you select the script steps you want to test<br />
and select the units to use to evaluate the script steps.<br />
Check All – Selects all of the script steps.<br />
Uncheck All – Deselects all of the script steps.<br />
– Click the check box in front of the steps that you<br />
want to test.<br />
– Select the units to use to evaluate the steps.<br />
6. Select the steps that you want to test and click OK.<br />
Chapter 5: Configuring Monitors 381
Configuring <strong>OneSight</strong> Voice Quality - Advanced Profile Monitors<br />
7. If the script requires input parameters, the number of<br />
parameters required is shown in the Parameters field. Click<br />
Input Parameter to display the Input Parameter Editor.<br />
This dialog box lets you configure parameters particular to this<br />
script. The columns displayed are based on the script’s<br />
requirements.<br />
Add – Displays the Input Parameter Editor for entering<br />
parameters that pertain to this script.<br />
Modify – Displays the Input Parameter Editor for modifying the<br />
selected parameter set.<br />
Remove – Deletes the selected parameter set.<br />
Add from CSV file – Displays the Upload Input Parameter dialog<br />
box for adding parameters from a Comma Separated Value file.<br />
The file must be set up so that the first line of the file contains<br />
the column names, the second line contains the type of data,<br />
and the third line contains the default values. The input<br />
parameter data should start on the fourth line and each line<br />
should only contain one set of input parameter data. Data<br />
should be surrounded by double quotes.<br />
Parameters – Displays the configured parameters.<br />
8. The Input Parameter Editor shows the input parameters that it<br />
needs. In the example above, the script needs a phone number<br />
and digit. Click Add to add a parameter.<br />
382 <strong>OneSight</strong> <strong>Administrator</strong> <strong>Guide</strong>
Configuring <strong>OneSight</strong> Voice Quality - Advanced Profile Monitors<br />
Or click Add from CSV file to upload the parameters from a<br />
Comma Separated Value file. The file must be set up so that the<br />
first line of the file contains the column names, the second line<br />
contains the type of data, and the third line contains the default<br />
values. The input parameter data should start on the fourth line<br />
and each line should only contain one set of input parameter<br />
data. Data should be surrounded by double quotes.<br />
9. Enter the parameters or select the file and click OK.<br />
10. You can add multiple parameter sets. When you are finished<br />
adding parameters, click OK.<br />
Chapter 5: Configuring Monitors 383
Configuring <strong>OneSight</strong> Voice Quality - Advanced Profile Monitors<br />
11. Click Voice Resource to display the Voice Resource Editor for<br />
selecting servers and channels to use as voice resources.<br />
Add – Displays the CallMaster System Editor for adding a<br />
CallMaster server and for configuring voice groups for the<br />
server.<br />
Modify – Displays the Edit CallMaster System dialog box for<br />
editing the selected system.<br />
Remove – Deletes the selected system.<br />
CallMaster Server Name – Displays the configured CallMaster<br />
system names.<br />
Port – Displays the CallMaster system port being used.<br />
Available Voice Group – Displays the voice groups that are<br />
available for the selected system.<br />
Selected Voice Group – Displays the voice groups selected for<br />
testing.<br />
384 <strong>OneSight</strong> <strong>Administrator</strong> <strong>Guide</strong>
Configuring <strong>OneSight</strong> Voice Quality - Advanced Profile Monitors<br />
12. Click Add.<br />
CallMaster Server Name – Enter the CallMaster server name.<br />
Port – Enter the port to use.<br />
About CallMaster – Displays the minimum required CallMaster<br />
version and the current version and build numbers.<br />
Add – Displays the Voice Resource Editor for configuring a voice<br />
group.<br />
Modify – Displays the Voice Resource Editor for modifying the<br />
selected voice group.<br />
Remove – Deletes the selected voice group.<br />
13. Enter the CallMaster server name and its port that you want to<br />
use.<br />
Chapter 5: Configuring Monitors 385
Configuring <strong>OneSight</strong> Voice Quality - Advanced Profile Monitors<br />
14. Click Add to add a voice group or click OK to return to the<br />
Voice Resource Editor. If you click Add the following dialog<br />
box is displayed.<br />
This dialog box lets you configure voice groups.<br />
Voice Group – Enter the name of the voice group.<br />
Channels – Select the channels that you want to include in the<br />
voice group.<br />
15. Select the channels you want to use and click OK.<br />
16. In the Voice Resource Editor select the system and voice<br />
groups that you want to use and click OK.<br />
17. To verify that the monitor will work as configured, click the<br />
Test button. The Monitor Test window provides information<br />
386 <strong>OneSight</strong> <strong>Administrator</strong> <strong>Guide</strong>
Configuring WMI Monitors<br />
about the success or failure of the test and indicates what may<br />
be causing any problem.<br />
18. If the test succeeds, click OK in the Add Monitor dialog box to<br />
save these basic <strong>OneSight</strong> Voice Quality - Advanced Profile<br />
monitor settings. You can now add this monitor to a monitor<br />
group. Refer to Adding Monitors to a Monitor Group in<br />
Chapter 4.<br />
Configuring WMI Monitors<br />
You can set up a Windows Management Instrumentation (WMI)<br />
monitor to provide in-depth information about the configuration,<br />
status, and operational aspects of a Windows operating system.<br />
WMI is similar to Perfmon, however, it offers more information<br />
about the machine being monitored.<br />
Note: The WMI monitor requires a Remote Agent or Network Data<br />
Collector that has access to the machine being monitored.<br />
In the Add Monitor dialog box, when you click WMI in the Monitor<br />
Types box, settings to configure a <strong>OneSight</strong> WMI monitor appear<br />
on these dialog box tabs:<br />
System Tab – Contains the options that you can use to define the<br />
system identification and authentication settings for a WMI monitor<br />
for your monitor group.<br />
Object Tab – Specifies the object configuration for a specific WMI<br />
Metric.<br />
Alerts Tab – Displays the options that you can use to define alerts<br />
and associate them with action plans. You can also configure how a<br />
WMI alert will affect the monitor group’s health. It can result in a<br />
Warning state, a Critical state, or can have no impact on health.<br />
Locations Tab – Specifies the Data Collector Location from which<br />
the WMI monitor checks a specific metric.<br />
Chapter 5: Configuring Monitors 387
Configuring WMI Monitors<br />
SmartLinks Tab – Contains the options for specifying a link to<br />
associate with a particular monitor or metric.<br />
Attributes Tab – Contains the options for specifying which attributes<br />
are applied to this monitor for Status page sorting.<br />
Monitor Groups Tab – Contains the options that you can use to<br />
specify which monitor groups the monitor is used with. This tab is<br />
available when you open the Add Monitor window by selecting<br />
Monitors from the Configure menu. It is not available when you<br />
open the Add Monitor window from the Monitor Group Editor.<br />
Access Control Tab – Contains the options for specifying which user<br />
groups have read, write, and delete permissions for this monitor.<br />
Down Time Tab – Contains the options for applying downtime to<br />
this monitor.<br />
Each monitor that you create must have a unique name. In the<br />
Monitor Name box, <strong>OneSight</strong> creates a unique name for the current<br />
monitor by combining the name of the monitor type with the name<br />
of the host and the WMI metric. To change the default assigned<br />
name, type a unique monitor name that helps you to identify what<br />
this monitor does.<br />
To create a WMI monitor:<br />
1. On the Monitors Page, click Add to open the Add Monitor dialog<br />
box.<br />
388 <strong>OneSight</strong> <strong>Administrator</strong> <strong>Guide</strong>
Configuring WMI Monitors<br />
2. The Monitor Types box lists all of the types of monitors that<br />
can be applied to your monitor group. Click WMI to add a<br />
monitor that will measure the performance of a specific WMI<br />
metric on a single machine.<br />
Use the options on this tab to specify the Windows machine to<br />
be monitored.<br />
Import/Export – Click this button to display the Import Export<br />
Monitors dialog box for importing or exporting monitors of this<br />
type. Refer to ―Exporting and Importing Monitors,‖ later in this<br />
chapter for more information.<br />
System Identification – Configure these settings to specify the<br />
Windows machine that will report the WMI metric.<br />
DNS Name – Specifies the DNS name of the computer.<br />
NetBIOS name – Specifies the NetBIOS name, or Windows<br />
computer name, for this machine.<br />
Chapter 5: Configuring Monitors 389
Configuring WMI Monitors<br />
Authentication – Configure these settings when a <strong>OneSight</strong> Data<br />
Collector or Remote Agent is not running on the system being<br />
monitored.<br />
User Name – Specifies the logon name that will provide<br />
access to the monitored machine. The user name and<br />
password that you specify must have administrative<br />
privileges on the monitored machine.<br />
Password – Specifies the password associated with the user<br />
name you supply. The user name and password that you<br />
specify must have administrative privileges on the monitored<br />
machine.<br />
Domain – Specifies the domain or machine name of the user<br />
name account.<br />
Test – When you add or modify a monitor, you can test System<br />
settings to determine if they are set appropriately. After clicking<br />
the Test button, you will see messages in the status window as<br />
the test runs and when the test completes.<br />
3. Each monitor that you add must have a unique name. You can<br />
let <strong>OneSight</strong> create a unique name using the WMI specifications<br />
you supply, or you can type in your own name for the monitor.<br />
390 <strong>OneSight</strong> <strong>Administrator</strong> <strong>Guide</strong>
Configuring WMI Monitors<br />
4. On the System tab, type in the DNS name, NetBIOS name, user<br />
name, password, and domain of the machine you want to<br />
monitor. If you have a <strong>OneSight</strong> Data Collector or Remote<br />
Agent installed on the machine you want to monitor, the<br />
authentication information (Username, Password, and Domain)<br />
is not required. Click the Object tab.<br />
Use the options on this tab to specify the WMI metric to be<br />
monitored.<br />
Use these settings to designate which WMI metric you want to<br />
check. To complete this information, click Discover WMI Metrics<br />
to find available metrics. WMI discovery is iterative. The first<br />
time you click Discover WMI Metrics, the top-level properties<br />
and their child classes are discovered. Select what you want to<br />
monitor and click Discover WMI Metrics again. Repeat this<br />
Chapter 5: Configuring Monitors 391
Configuring WMI Monitors<br />
process until you have discovered the metric you want to<br />
monitor.<br />
Namespace – Specifies the name space, for example: root\cimv2<br />
(the default). Data in the WMI repository is organized by<br />
schemas, which are loaded into ―namespaces.‖ A namespace<br />
provides a domain (or container) for a schema and for the<br />
instances of the classes in that schema.<br />
Select – Specifies the name of the metric, for example:<br />
FreeSpace.<br />
From – Specifies the class name, for example:<br />
Win32_LogicalDisk.<br />
Where – Specifies the key name and value, for example:<br />
Name=”C:\”.<br />
Perl Expression – Enter a Perl Expression for parsing the results<br />
when the results either contain non-numeric data or you only<br />
want part of a numeric result. Refer to “Using Regular<br />
Expressions for Pattern Matching,” later in this chapter for<br />
more information.<br />
Scale – Type the multiplier you want applied to the data that’s<br />
collected.<br />
Setting Scale to 1 means the data will be reported as it is. If the<br />
metric measurement is expressed in kilobytes, setting Scale to<br />
1024 will translate it to bytes. If the metric measurement is<br />
expressed in milliseconds, setting Scale to .001 will translate it<br />
to seconds.<br />
Translation Type – Translation Type controls how a metric’s<br />
data is displayed on the Alerts page and in Reports.<br />
No Translation – <strong>OneSight</strong> will present the data as it is<br />
provided by the metric’s data source.<br />
392 <strong>OneSight</strong> <strong>Administrator</strong> <strong>Guide</strong>
Configuring WMI Monitors<br />
Rate (minutes) – <strong>OneSight</strong> will present the data as a number,<br />
per minute. For example, if the time interval between two<br />
samples was 10 minutes, and 50 errors were found, the Rate<br />
(minutes) would be five (5) errors per minute.<br />
Note: Rate (minutes) translates data sources that return their<br />
values as an endlessly increasing counter. If the data source<br />
does not return data this way, use No Translation.<br />
Unit Measure – To define a Unit Measure, click the arrow to<br />
select a unit measure (%, bytes, hours, minutes, seconds). You<br />
can also type in a unit measure such as messages/minute. This<br />
measure is a display string. It does not perform any data<br />
translation.<br />
Sample Every: – Specifies how often samples are<br />
taken for this monitor. Refer to, ―Sample Every Settings,‖ later<br />
in this chapter for a description of these settings.<br />
Discover WMI Metrics – Finds the available metrics and<br />
populates the result tree. WMI discovery is iterative. The first<br />
time you click Discover WMI Metrics, the top-level properties<br />
and their child classes are discovered. Select what you want to<br />
monitor and click Discover WMI Metrics again. Repeat this<br />
process until you have discovered the metric you want to<br />
monitor.<br />
Note: Discovery may take several minutes.<br />
String Mappings – Displays the String Mappings dialog box for<br />
specifying string mappings.<br />
String Mappings – <strong>OneSight</strong> collects numeric performance<br />
data. If you are measuring a WMI object representing a String<br />
datatype, it can be converted to a number for use in <strong>OneSight</strong><br />
by using the String Mappings field. Simply specify a<br />
semicolon delimited mapping of Strings to Integers. For<br />
example, ―false=0;true=1‖; will convert a ―false‖ reading to<br />
a 0 value in <strong>OneSight</strong>, and this will be displayed in <strong>OneSight</strong><br />
Chapter 5: Configuring Monitors 393
Configuring WMI Monitors<br />
Status as ―false=0‖. If you only want to display the string on<br />
the <strong>OneSight</strong> status page, use a colon, rather than a semicolon<br />
to delimit the values.<br />
If you neglect to provide a mapping for a specific string,<br />
<strong>OneSight</strong> will consider this a Sample Failure, and report the<br />
String that was returned. String Mappings can also be used to<br />
translate a number to a String for display in <strong>OneSight</strong> Status.<br />
This is helpful when numbers represent an objects state.<br />
Note that string matching is case-insensitive and data that has<br />
a colon cannot be used in string mapping.<br />
5. On the Object tab, use the settings to designate which WMI<br />
metric you want to check. To complete this information, click<br />
Discover WMI Metrics to discover the available metrics and<br />
populate the result tree. WMI discovery is iterative. The first<br />
time you click Discover WMI Metrics, the top-level properties<br />
and their child classes are discovered. Select what you want to<br />
monitor and click Discover WMI Metrics again. Repeat this<br />
process until you have discovered the metric you want to<br />
monitor.<br />
6. Enter a Perl Expression if needed. Refer to “Using Regular<br />
Expressions for Pattern Matching,” later in this chapter for<br />
more information.<br />
7. Modify the sampling parameter and string mappings as needed.<br />
8. To verify that the monitor will work as configured, click the<br />
Test button. The Monitor Test window provides information<br />
about the success or failure of the test and indicates what may<br />
be causing any problem.<br />
9. If the test succeeds, click OK in the Add Monitor dialog box to<br />
save these basic WMI monitor settings. You can now add this<br />
monitor to a monitor group. Refer to Adding Monitors to a<br />
Monitor Group in Chapter 4.<br />
394 <strong>OneSight</strong> <strong>Administrator</strong> <strong>Guide</strong>
Sample Every Settings<br />
Sample Every Settings<br />
Sample Every: – Specifies how often samples are<br />
taken for this monitor. Select the unit of time to use for the<br />
sampling interval: seconds, minutes, or hours. You can specify<br />
sample intervals to occur regularly, hourly, or daily.<br />
To Sample Interval Value Example<br />
Regularly integer 3 sample very three<br />
units<br />
Hourly<br />
Daily GMT<br />
@<br />
@<br />
@<br />
@<br />
60@24 sample every<br />
hour at minute 24<br />
3@ sample every<br />
three hours at any<br />
minute<br />
1@12:15:34 sample<br />
once a day at<br />
12:15:34<br />
@12:15:34 sample<br />
once a day at<br />
12:15:34<br />
To sample at regular intervals, specify a simple integer value<br />
and select the appropriate units. For example, to sample every 5<br />
minutes, enter 5 and select minutes. <strong>OneSight</strong> selects a random<br />
time to take the first sample that is shortly after configuration or<br />
startup, and from then on samples every 5 minutes.<br />
To sample at a specific time every hour, specify the value as<br />
@. For example, to sample every hour at<br />
quarter past the hour, enter 1@15.<br />
Chapter 5: Configuring Monitors 395
Sample Every Settings<br />
To sample at a specific time every day, specify the value as<br />
24@. For example, to sample once a day at<br />
quarter past eleven (local time on the server machine), enter<br />
24@23:15:00. The first sample occurs at the time specified.<br />
To allow the different states to specify longer times, the<br />
individual states can specify a specific minute within an hour<br />
and a specific time within a day by using the extended syntax of<br />
@. The general form is<br />
[@[(|]. The presence of<br />
the @ symbol in the state specification causes the units in the<br />
select dropdown to be ignored and the frequency number is<br />
assumed to be hours.<br />
For example:<br />
4@ – Sample every 4 hours (any minute)<br />
3@24 – Sample every 3 hours at minute 24<br />
72@12:15:34 – Sample every 72 hours(or 3 days) at<br />
12:15:34<br />
For a daily interval, you can use the format 24@hh;mm:ss. The<br />
interval is 24 hours and the hh specifies the number of hours<br />
after midnight Greenwich time.<br />
You can also specify different sampling intervals based on the<br />
sample’s state using the following syntax: <br />
or ; or<br />
;;. Separate each state interval<br />
by a semi-colon. Each state interval must share the same unites.<br />
For example, 30;20;15 minutes samples every 30 minutes when<br />
in a good state, every 20 minutes in a warning state, and every<br />
15 minutes in a critical state. If two states are the same one can<br />
be omitted. For example, 30;;15 minutes samples every 30<br />
minutes in good and warning states, and every 15 minutes in a<br />
critical state. The format 30;20 minutes samples every 30<br />
396 <strong>OneSight</strong> <strong>Administrator</strong> <strong>Guide</strong>
Sample Every Settings<br />
minutes in a good state, and every 20 minutes in the warning<br />
and critical states. A single interval value applies to all three<br />
states.<br />
Advanced Sample Frequency Settings<br />
Select the unit of time to use for the sampling interval; seconds,<br />
minutes, hours or days. To sample at regular intervals, specify a<br />
simple integer value in the Sample Every text field and select the<br />
appropriate units. For example, to sample every 5 minutes, enter 5<br />
and select minutes.<br />
Good State, Warning State, Critical State – The advanced dialog has<br />
three state options: Good State, Warning State, Critical State. Each<br />
of the three states have their own frequency. If one of the state<br />
specification is missing, then is uses the state frequency<br />
specification for the prior state:<br />
Warning State unchecked: use the Good State frequency for<br />
Warning State<br />
Warning State checked but Critical State unchecked: use the<br />
Warning State frequency for Critical State<br />
both Warning State and Critical State unchecked: use the Good<br />
State frequency for Warning State and Critical State<br />
No Specific Minute – Select hours as the unit. Sample every specific<br />
hours(any minute) for this monitor. For example, to sample every 5<br />
hours at any minute, enter 5 in the Sample Every text field, select<br />
hours as the units and check No Specify Minute radio.<br />
At Minute – Select hours as the unit. Sample every specific hours at<br />
specific minute for this monitor. For example, to sample every 5<br />
hours at quarter past the hours, enter 5 in the Sample Every text<br />
field and select hours as the units, check At Minute radio and enter<br />
15 in the text filed besides At Minute radio.<br />
Chapter 5: Configuring Monitors 397
Exporting and Importing Monitors<br />
No Specific Time – Select days as the unit. Sample every specific<br />
days(any time) for this monitor. For example, to sample every 5<br />
days at any time, enter 5 in the Sample Every text field, select days<br />
as the units and check No Specify Time radio.<br />
At Time – Select days as the unit. Sample every specific days at<br />
specific time(hh:mm:ss) for this monitor. For example, to sample<br />
every 2 days at 12:15:34, enter 2 in the Sample Every text field and<br />
select days as the units, check At Time radio and in turn enter 12,<br />
15, 34 in the text fields besides At Time radio.<br />
Exporting and Importing Monitors<br />
You can export and import data from the General tab for most<br />
dedicated monitors via a comma-separated value (.CSV) file. This<br />
lets you:<br />
Input monitor configurations in a CSV file and create the<br />
monitors by importing the file.<br />
Export monitor configurations to a CSV file and copy them to<br />
another system.<br />
The first row of the CSV file is used for the column names. These<br />
column names correspond to the field names on the General tab.<br />
They will vary based on the type of monitor. For example, the CSV<br />
file for a Ping monitor would look like the following picture when<br />
opened in Microsoft Excel:<br />
Only one type of monitor can be exported or imported at one time.<br />
To obtain the file names for a particular monitor type, export a<br />
monitor of that type. You can then edit the file in a text editor or in<br />
398 <strong>OneSight</strong> <strong>Administrator</strong> <strong>Guide</strong>
Exporting and Importing Monitors<br />
Exporting Monitors<br />
Microsoft Excel. If you are deleting a row in the file, delete the entire<br />
row. Make sure to save the file as CSV.<br />
The following monitor types can be imported or exported: Database,<br />
DNS, Event Log, FTP, JMX, Logfile, Directory, Mail, <strong>OneSight</strong> Probe,<br />
<strong>OneSight</strong> Virtual Agent, Perfmon, Ping, Port, Process, Service, SNMP,<br />
SNMP Trap, TCP/IP Socket, URl, and WMI.<br />
Note: If you have exported monitors with file names that begin with<br />
a dash (―-―), Microsoft Excel assumes that they are formulas and<br />
displays them in the format ―#NAME?‖. If you modify the CSV file<br />
and save it, the monitor names are saved as ―#NAME?‖ formatted<br />
as text. To avoid losing the original file names, format all of the<br />
monitor name cells as text before modifying and saving the file.<br />
To export monitors:<br />
1. Click the Import/Export button on the General tab of a The<br />
Import Export Monitors dialog box is displayed.<br />
The type of monitor that you are importing is displayed under<br />
the Choose action for this monitor type Prompt. This dialog box<br />
has the following options:<br />
Choose action for this monitor type – Select whether you want to<br />
import or export monitors.<br />
Chapter 5: Configuring Monitors 399
Exporting and Importing Monitors<br />
Importing Monitors<br />
Import from a File – Select this option to import monitors.<br />
Browse – Enter the file to import or click<br />
Browse to navigate to it. It must be a CSV file.<br />
Export to a File – Select this option to export all monitors of the<br />
displayed type.<br />
Import – Imports the selected file.<br />
Export – Exports the selected monitor types.<br />
2. Select Export to a File.<br />
3. Click Export. The File Download dialog box is displayed.<br />
4. Click Save. The File save dialog box is displayed when the<br />
export is finished.<br />
5. Enter the file name to use.<br />
To import monitors from a CSV file:<br />
1. Click the Import/Export button on the General tab of a monitor<br />
of the type that you are importing. The Import Export Monitors<br />
dialog box is displayed.<br />
400 <strong>OneSight</strong> <strong>Administrator</strong> <strong>Guide</strong>
Configuring a Profile Monitor<br />
The type of monitor that you are importing is displayed under<br />
the Choose action for this monitor type Prompt. This dialog box<br />
has the following options:<br />
Choose action for this monitor type – Select whether you want to<br />
import or export monitors.<br />
Import from a File – Select this option to import monitors.<br />
Browse – Enter the file to import or click<br />
Browse to navigate to it. It must be a CSV file.<br />
Export to a File – Select this option to export all monitors of the<br />
displayed type.<br />
Import – Imports the selected file.<br />
Export – Exports the selected monitor types.<br />
2. Select Import from a File.<br />
3. Enter the name of the file or click Browse to display the Choose<br />
file dialog box for selecting the file.<br />
4. Click Import. When importing is finished, the Import Export<br />
Monitors dialog box is displayed show the results of the import.<br />
Configuring a Profile Monitor<br />
When you want to monitor a web component such as an IIS server,<br />
an Oracle database, NT operating system, or UNIX operating<br />
system, <strong>OneSight</strong> provides a ―profile,‖ that is, a default set of<br />
performance criteria so you can monitor performance of various<br />
critical functions carried out by that component. The list of profile<br />
monitors can include default profiles shipped with <strong>OneSight</strong> as well<br />
as any other profiles you create yourself.<br />
Chapter 5: Configuring Monitors 401
Configuring a Profile Monitor<br />
To create a monitor for a web component such as an Oracle<br />
database, you choose the Oracle profile monitor and apply it to a<br />
specific system on which an Oracle database is maintained. When<br />
you configure a profile monitor, you direct <strong>OneSight</strong> to monitor the<br />
specified type of web component on the specified computer.<br />
When you create a profile monitor the Monitor Creation Wizard<br />
requests the required discovery information to successfully apply<br />
the profile.<br />
In addition to creating one monitor at a time, you can apply a<br />
profile to multiple systems to create several monitors at once. When<br />
you do this, discovery information is not requested. The profile is<br />
applied to the systems regardless of the configuration of the<br />
systems. For this reason, it is recommended that you apply a profile<br />
to multiple systems immediately following multiple system<br />
discovery. Refer to Chapter 7 for information on multiple system<br />
discovery.<br />
What You Need to Know About Your System<br />
To set up a profile monitor, system-specific information must be<br />
entered for each machine that uses the profile. As you create a<br />
profile monitor, you will need to identify the systems and describe<br />
their properties, including the following:<br />
Machine identification information. For example, to monitor an<br />
NT operating system on a specific machine, you will need to<br />
supply an IP address or network name.<br />
Identification of components on a machine. For example, you<br />
must identify each disk on a machine that has multiple disks if<br />
you want to monitor disk space on all of them.<br />
The appropriate access information for the monitored system. For<br />
example, Perfmon user name and password information must be<br />
provided to allow access to the monitored systems.<br />
402 <strong>OneSight</strong> <strong>Administrator</strong> <strong>Guide</strong>
Configuring a Profile Monitor<br />
For database monitoring, appropriate database configuration for<br />
the <strong>OneSight</strong> server. For example, to monitor an Oracle database<br />
using the JDBC-ODBC Bridge for Oracle, you must provide the<br />
connect string, the name of the database, and user name and<br />
password information. You must also install the Oracle client on<br />
the <strong>OneSight</strong> server if it is not already present.<br />
Note: <strong>OneSight</strong> provides system profile information for each profile<br />
monitor, but system-specific information must be entered for each<br />
machine. For example, if you are monitoring an Oracle database, it<br />
must be added to the system. As you create a system monitor, you<br />
will need to identify the systems and describe their properties.<br />
To create a profile monitor:<br />
1. In the Monitors Page, on the Monitors tab, click Add.<br />
Chapter 5: Configuring Monitors 403
Configuring a Profile Monitor<br />
2. In the Add Monitor dialog box, the Monitor Types box lists all<br />
of the types of monitors that can be applied to your monitor<br />
group. Click a profile monitor, such as Oracle or Microsoft<br />
Windows NT, 2000. (These are listed alphabetically in a group<br />
following the list of dedicated monitors and have a specific<br />
icon: .)<br />
Use options in the Add Monitor dialog box to view the metrics<br />
and data sources configured for this profile. The right side of<br />
the Add Monitor dialog box describes this profile, lists its<br />
metrics and the data sources used by these metrics.<br />
Profile Manager – Opens the Profile Manager, where you control<br />
which profiles are available for creating profile monitors. You<br />
can modify existing profiles, and you can create your own<br />
404 <strong>OneSight</strong> <strong>Administrator</strong> <strong>Guide</strong>
Configuring a Profile Monitor<br />
profiles, either from scratch or by cloning an existing profile<br />
and modifying it.<br />
Profile – Displays the type of profile selected.<br />
Description – Describes what the profile does.<br />
Data Sources – Lists the data sources used by the metrics in the<br />
metric list for this profile.<br />
Metrics – Lists the metrics in this profile.<br />
3. Select the profile you want to use and click Next to start the<br />
Monitor Creation Wizard for selecting a system that you want<br />
to monitor with this profile’s metrics. Refer to “Applying a<br />
Profile to Multiple Systems” if you are applying the profile to<br />
more than one system.<br />
Chapter 5: Configuring Monitors 405
Configuring a Profile Monitor<br />
New System – Select this option to add a system that is not in<br />
the Existing System list.<br />
Name – Enter the name or IP address of the system.<br />
Location – Select the location to use.<br />
Existing System – Select this option to use an existing system.<br />
Show Systems – Lets you filter the list of systems that are<br />
displayed.<br />
Systems – Lists the existing systems.<br />
IP Address – Displays the system’s IP address.<br />
Discovered – Indicates whether components have been<br />
discovered for this system.<br />
4. To add a profile monitor for a particular machine, the machine<br />
must appear in the Existing System list. For example, to create<br />
a monitor for a web component such as an Oracle database,<br />
select a specific machine on which an Oracle database is<br />
maintained. Click the system you want to monitor with that<br />
profile’s metrics<br />
If the system that you want to monitor is not in the Existing<br />
System list, you must add it:<br />
Click New System.<br />
Type the System Name that identifies this machine. This<br />
name must be in the DNS table for your network.<br />
406 <strong>OneSight</strong> <strong>Administrator</strong> <strong>Guide</strong>
Configuring a Profile Monitor<br />
5. Click Next.<br />
If system components have previously been discovered, this<br />
dialog box lists all of the components relevant to this profile.<br />
Discover – Click this button to discover components on the<br />
selected system.<br />
Check All – Selects all components for monitoring.<br />
Uncheck All – Deselects all components for monitoring.<br />
6. If components have not been discovered for this system click<br />
Discover.<br />
If you click Discover, the Setup Discovery Dialog box may be<br />
displayed asking for information needed to access the system.<br />
The information requested depends on the type of data source<br />
being used.<br />
Chapter 5: Configuring Monitors 407
Configuring a Profile Monitor<br />
Setup Discovery for SNMP – SNMP finds interfaces by using RFC<br />
1213 (MIB II). To use SNMP to find processes and hardware,<br />
the system must support the Host Resources MIB.<br />
Community – Specify the SNMP community string used for<br />
the machine you want SNMP to examine. For many devices,<br />
the default community string is public.<br />
Timeout seconds – Specifies the amount of time (in seconds)<br />
to wait for an SNMP reply. If Timeout Retries is greater than<br />
0 and a reply is not received, a retry attempt is made. For<br />
each subsequent retry, the timeout value is doubled. For<br />
example, if Timeout Seconds is 5 and Timeout Retries is 2,<br />
the first request attempt will occur after 5 seconds, the<br />
second attempt will occur after 10 seconds, and the third<br />
attempt will occur after 20 seconds. In this example, the total<br />
timeout period equals 35 seconds. If there is no response<br />
after this time, a Sample Failure is triggered.<br />
If Timeout Retries is 0, a Sample Failure is triggered when a<br />
reply is not received in this amount of time.<br />
Timeout retries – Sets the upper limit for the number of times<br />
an SNMP request is retried. For example, if Timeout Retries<br />
is set to 3, the SNMP request will be sent up to four times (the<br />
initial try plus three retries).<br />
Port – Specifies the port number used on this system by the<br />
SNMP agent. Typically, this is port 161.<br />
Version – Specifies the SNMP version.<br />
Setup Discovery for Virtual Agent<br />
Connection Method – Select the connection method to use for<br />
the Virtual Agent.<br />
408 <strong>OneSight</strong> <strong>Administrator</strong> <strong>Guide</strong>
Configuring a Profile Monitor<br />
Prompt – Specify the command line prompt for the host<br />
machine. If you do not specify a command line prompt,<br />
<strong>OneSight</strong> will attempt to infer the prompt by parsing the<br />
screen output.<br />
Charset – Specifies the character set to use. Select a character<br />
set from the list.<br />
ISO-8859-1 – Latin alphabet for Western European<br />
languages such as Basque, Catalan, Danish, Dutch,<br />
English, Faeroese, Finnish, French, German, Icelandic,<br />
Irish, Italian, Norwegian, Portuguese, Rhaeto-Romanic,<br />
Scottish, Spanish, Swedish, Albanian, Afrikaans, and<br />
Swahili.<br />
ISO-8859-13 – Baltic Rim languages.<br />
ISO-8859-15 – Latin alphabet for Western European<br />
languages.<br />
ISO-8859-2 – Central and Eastern European languages that<br />
use a Roman alphabet, including Polish, Czech, Slovak,<br />
Slovenian, and Hungarian.<br />
ISO-8859-4 – Latin alphabet for Estonian, Latvian,<br />
Lithuanian, Greenlandic, and Sami.<br />
ISO-8859-5 – Most Slavic languages that use a Cyrillic<br />
alphabet including Belarusian, Bulgarian, Macedonian,<br />
Russian, Serbian, and Ukranian.<br />
ISO-8859-7 – Greek.<br />
ISO-8859-9 – Latin alphabet for Western European<br />
languages, similar to ISO 8859-1 with the Icelandic<br />
letters replaced with Turkish letters. It is also used for<br />
Kurdish.<br />
Chapter 5: Configuring Monitors 409
Configuring a Profile Monitor<br />
K018-R – Cyrillic<br />
US-ASCII – United States.<br />
UTF-16 – Unicode 16 bit.<br />
UTF-16BE – Unicode big-endian.<br />
UTF-16LE – Unicode little-endian.<br />
UTF-8 – Unicode 8 bit mostly used for HTML.<br />
Windows 1250 – Microsoft Windows Code Page for<br />
Central European Latin alphabet languages.<br />
Windows 1251 – Microsoft Windows Code Page for<br />
Russian and other Cyrillic languages.<br />
Windows 1252 – Microsoft Windows Code Page for<br />
Western European languages.<br />
Windows 1253 – Microsoft Windows Code Page for<br />
Greek.<br />
Windows 1254 – Microsoft Windows Code Page for<br />
Turkish.<br />
Windows 1257 – Microsoft Windows Code Page for<br />
Baltic.<br />
Cp500 – EBCDIC 500 VI.<br />
Port – Specify the port to use for connecting.<br />
Operating System – Specify the type of operating system.<br />
User Name – Specify a user name to log into an account on<br />
the host system.<br />
410 <strong>OneSight</strong> <strong>Administrator</strong> <strong>Guide</strong>
Configuring a Profile Monitor<br />
Password – Specify the password required to log into the<br />
User Name account on the system.<br />
Login Timeout (ms) – Specify the number of milliseconds to<br />
wait before timing out when logging in.<br />
Discovery Timeout (ms) – Specify the number of milliseconds<br />
to wait before timing out when doing discovery.<br />
Debug Mode – Specify whether to use debug mode.<br />
Setup Discovery Windows NT<br />
User name – Enter the user name for a system account that<br />
has rights to read the NT Windows Registry.<br />
Domain – Specify the domain name of the Windows NT<br />
machine.<br />
Password – Specify the password required by the system<br />
when logging in with the user name specified in the User<br />
Name box.<br />
Setup Discovery for Database<br />
Driver – Select a driver type from the list: jTDS JDBC Driver<br />
for Microsoft SQL Server, Inet Sprinta JDBC driver for<br />
Microsoft SQL Server, Oracle Thin JDBC driver, Sun<br />
JDBC:ODBC Bridge, DataDirect JDBC Driver for Microsoft<br />
SQL Server, or Custom. You must have the appropriate driver<br />
installed on the <strong>OneSight</strong> Server to discover database<br />
components.<br />
Driver String – This information will vary depending on the<br />
type of database that you are monitoring. If you selected any<br />
option other than Custom, the appropriate string is<br />
automatically displayed. For example, this is the string for<br />
the Oracle Thin JDBC driver:<br />
Chapter 5: Configuring Monitors 411
Configuring a Profile Monitor<br />
oracle.jdbc.driver.OracleDriver<br />
If you selected a Custom driver type, you can type in the<br />
Driver String yourself.<br />
Instance – Specify the SQL server instance.<br />
Port – <strong>OneSight</strong> displays the default port for the driver you<br />
selected. For example, the default port for an Oracle Thin<br />
JDBC driver is 1521. Modify the port number if necessary.<br />
This is not required for a JDBC:ODBC or Custom driver<br />
setting.<br />
User name – If a user name and password are required for<br />
access to the database, enter the user name here. The user<br />
must have system administrator privileges.<br />
Password – If a user name and password are required for<br />
access to the database, enter the password here.<br />
Enter the information and click OK.<br />
If no additional information is required, the Discovery Status<br />
dialog box is displayed.<br />
Click Close to exit the Discovery Status dialog box.<br />
7. Select the components you want to monitor and click Finish to<br />
create the monitor.<br />
8. If one or more of the profile metrics cannot be applied, the<br />
Monitor Editor opens to show you the profile metrics that are<br />
not configured. This icon indicates that the metric could not be<br />
applied to the system component it is meant to monitor:<br />
The Metrics list shows all of the metrics that this profile uses to<br />
monitor a system. When you select one of the profile metrics,<br />
the System Components list shows the system components that<br />
the metric will monitor.<br />
412 <strong>OneSight</strong> <strong>Administrator</strong> <strong>Guide</strong>
Configuring a Profile Monitor<br />
If you select an unapplied metric, the System Components list<br />
indicates that you have not configured this type of component<br />
as part of your system definition.<br />
9. To add the missing components to your system definition, click<br />
the System Editor button.<br />
In the Components box, click a missing component and then<br />
click Add, which opens the Add System Component dialog<br />
box.<br />
In the Add System Component dialog box in the Add New<br />
Component section, the Type list defaults to the kind of<br />
component you are adding. In the Component box, specify a<br />
meaningful name that allows you to identify the specific<br />
component you are adding. Then click OK to return to the<br />
Add Missing Components dialog box.<br />
The newly added component appears in the Components list.<br />
Select this component and click Add Data Source to configure<br />
the data sources that <strong>OneSight</strong> metrics can use to obtain<br />
information about this system component.<br />
For information about the Properties tabs used for each type of<br />
component, see Chapter 7.<br />
10. Repeat step 9 to add information about each of the system<br />
components that is missing. Then click OK to return to the<br />
Monitor Editor.<br />
11. You can now add this monitor to a monitor group. Refer to<br />
Adding Monitors to a Monitor Group in Chapter 4.<br />
Applying a Profile to Multiple Systems<br />
When applying a profile to multiple systems, discovery information<br />
is not requested as it is when you apply a profile to only one system.<br />
Chapter 5: Configuring Monitors 413
Configuring a Profile Monitor<br />
The profile is applied to the systems regardless of the system<br />
configurations.<br />
To apply a profile to multiple systems:<br />
1. In the Monitors Page, on the Monitors tab, click Add.<br />
2. In the Add Monitor dialog box, the Monitor Types box lists all<br />
of the types of monitors that can be applied to your monitor<br />
group. Click a profile monitor, such as Oracle or Microsoft<br />
Windows NT, 2000. (These are listed alphabetically in a group<br />
following the list of dedicated monitors and have a specific<br />
icon: .)<br />
414 <strong>OneSight</strong> <strong>Administrator</strong> <strong>Guide</strong>
Using Regular Expressions for Pattern Matching<br />
3. Select the profile you want to use and click Next.<br />
4. Using the shift key, Shift-Click on the systems to which you<br />
want to apply this profile and click Finish to create the<br />
monitors.<br />
Using Regular Expressions for Pattern Matching<br />
You can use Perl-style regular expressions to match for content in the<br />
following areas of <strong>OneSight</strong>:<br />
When defining good string absence and bad string presence for<br />
the URL monitor.<br />
Database and Log File query pattern matching in the Alert Editor.<br />
Chapter 5: Configuring Monitors 415
Using Regular Expressions for Pattern Matching<br />
When collecting metric performance data from a log file using<br />
the Log File Monitor.<br />
When collecting metric performance data from a command line<br />
program using the <strong>OneSight</strong> Virtual Agent Monitor.<br />
For example, you can use /mytext \d\d/ to match any appearance of the text<br />
―mytext‖ followed by two digits. Entries that start and end with a slash<br />
(―/‖), plus a few optional modifiers, are recognized as regular expressions.<br />
Modifiers after the ending slash affect the kind of matching performed.<br />
You can combine modifiers, for example, ―/pattern/ic‖.<br />
/my string/s – Treats input as a single line containing newline<br />
characters, and performs a match on this input.<br />
/my string/x – Enables the use of regular expression extensions<br />
in Perl.<br />
Defining Expressions for Good Strings and Bad Strings<br />
You can specify expressions for good string absence and bad string<br />
presence alerts for the URL monitor. Using expressions for these strings<br />
will give you more flexibility in defining the strings while producing<br />
meaningful information when an alert is displayed on the status page or in<br />
an e-mail notification. For example, add this bad string search for a URL<br />
monitor:<br />
/Server down:*\n/<br />
The bad string search that locates ―Server down:‖ will include this string<br />
and all other text displayed before the newline: (*\n). The Alert that is<br />
displayed on the <strong>OneSight</strong> status page will include the entire line.<br />
Defining Expressions for Metric Performance Data<br />
Using the Log File Monitor<br />
Some applications publish performance data to a text log file. Using the<br />
Log File Monitor, you can specify Perl expressions to collect<br />
416 <strong>OneSight</strong> <strong>Administrator</strong> <strong>Guide</strong>
Using Regular Expressions for Pattern Matching<br />
performance data from a log file entry. This data can then be used within<br />
<strong>OneSight</strong>, both for alerting, using threshold alerts, and reporting. When<br />
specifying a Perl Expression to gather performance data, parentheses are<br />
used within the expression to delimit the numeric data to return.<br />
Log File Entry Modifier Results<br />
There are 100 bytes free /([0-9]+) bytes free/ 100<br />
3/05/01 11:03 AM 5.21 seconds /M (.*) seconds/ 5.21<br />
Defining Expressions for Metric Performance Data<br />
using the <strong>OneSight</strong> Virtual Agent Monitor<br />
Perl expressions are used to parse the output of a command line program<br />
and return the desired metrics using the <strong>OneSight</strong> Virtual Agent<br />
Monitor. This data can then be used within <strong>OneSight</strong>, both for alerting,<br />
using threshold alerts, and reporting. When specifying a Perl Expression<br />
to gather performance data, parentheses are used within the expression to<br />
delimit the numeric data to return.<br />
Command Expression Results<br />
echo 5 ^\w+\W+([0-9]+) 5<br />
vmstat 1 2 / (?:\S+\s+){4,4}([0-9]+)/ Any value in the Free<br />
Memory column of the<br />
vmstat program output<br />
(e.g. 661552.0). Note that<br />
the <strong>OneSight</strong> Virtual<br />
Agent returns the value<br />
on the last line of the<br />
program output that<br />
matches the expression.<br />
Chapter 5: Configuring Monitors 417
Using Regular Expressions for Pattern Matching<br />
df -k<br />
/^[^F](?:\S+\s+){4,4}([0-<br />
9]+)%\s+(\S+)/<br />
Any percentage value in<br />
the Capacity column of<br />
the Filesystem data<br />
returned by the df<br />
program output (e.g.<br />
3.0%).<br />
The <strong>OneSight</strong> Virtual Agent monitor includes several pre-defined<br />
OS/Program/Perl expression definitions for common metrics accessible<br />
using command line programs available with several versions of UNIX.<br />
You can also define custom settings in the Virtual Agent.<br />
The perl expressions are evaluated as follows:<br />
Subpattern<br />
^<br />
Description<br />
Beginning of the line.<br />
( ) The part of the expression to return.<br />
\S Match a non-whitespace character.<br />
\s Match a whitespace character.<br />
(?:\S+\s+)<br />
Represents a column in the program output.<br />
Matches one or more non-whitespace character and<br />
one or more whitespace character.<br />
{4,4} Match at least 4 times but not more than 4 times<br />
(min,max).<br />
[0-9]+ Match one or more occurrences of anything between<br />
0 and 9.<br />
More information about using Perl expressions is available at<br />
www.perl.com.<br />
418 <strong>OneSight</strong> <strong>Administrator</strong> <strong>Guide</strong>
Adding Alerts to a Monitor<br />
Adding Alerts to a Monitor<br />
One or more alerts are configured for each <strong>OneSight</strong> monitor. An<br />
alert does three things:<br />
Defines a problem condition such as an exceeded threshold or a<br />
sample failure, that the monitor should detect.<br />
Specifies what <strong>OneSight</strong> should do if the problem occurs. When<br />
the monitor detects this problem condition, the alert can either<br />
trigger an action plan, change a monitor’s health status, or do<br />
both.<br />
Ranks the seriousness of the problem. (Critical, Warning, or<br />
Informational).<br />
If you are configuring a:<br />
Dedicated monitor – the alert that triggers a response can be due<br />
to a crossed threshold or a sample failure, or it can be scriptbased<br />
(such as the presence of an undesirable text string on a web<br />
page).<br />
Profile metric – the alert that triggers a response can be a crossed<br />
threshold, a sample failure, or a pattern match.<br />
The exact options available to you in the Alert Editor depend on the<br />
type of dedicated monitor you are configuring or on the data source<br />
used by the profile metric you are configuring.<br />
Note: For profile metrics, the system action plan overrides the<br />
profile’s alert plan when a system action plan has been configured.<br />
Refer to Chapter 7.<br />
Configuring Monitors Alerts Tab<br />
Use the Alerts tab to define alerts and associate them with action plans.<br />
The Alerts tab shows the alerts that are currently in effect for the monitor<br />
Chapter 5: Configuring Monitors 419
Adding Alerts to a Monitor<br />
and whether they are associated with an action plan. Options on this tab<br />
allow you to add, clone, modify, or remove alerts for the monitor.<br />
Note: For Transaction monitors such as Oracle Test for Web<br />
Application, Oracle OpenScript, and <strong>OneSight</strong> Voice Transaction<br />
monitors, alerts cannot be added, cloned, modified, or deleted until<br />
the monitor has been saved.<br />
You can also configure how a monitor alert will affect the monitor group’s<br />
health. It can result in a Warning state, a Critical state, or can have no<br />
impact on health.<br />
420 <strong>OneSight</strong> <strong>Administrator</strong> <strong>Guide</strong>
Adding Alerts to a Monitor<br />
Note: DNS, Mail, and Service monitors only allow modification of<br />
the default alerts. New alerts cannot be added for these monitors.<br />
The default alert, Sample Failure, changes the status of the monitor on<br />
the <strong>OneSight</strong> Console to Critical, as indicated by the red diamond. It does<br />
not, however, trigger any other behavior (the default Respond By option<br />
is ). If you want to be notified when the status has<br />
changed, click Modify to associate the alert with an action plan such as<br />
sending you an e-mail.<br />
Status – Indicates how the monitor status on the <strong>OneSight</strong> Console will<br />
change when this alert occurs.<br />
Applies to Critical State<br />
Chapter 5: Configuring Monitors 421
Setting Up an Alert to Trigger an Action Plan<br />
Applies to Warning State<br />
Alert Description – Identifies the type of alert that can occur. The default<br />
alert is Sample Failure. You can also add performance threshold alerts.<br />
Respond by – Identifies the action plan that will go into effect whenever<br />
an alert occurs. By default, no action plan is configured. To associate an<br />
action plan with an alert, click Modify and select an action plan from (or<br />
add a new one to) the Respond By list.<br />
Add – Click Add to open the Alert Editor. You can add threshold-based<br />
alerts to the monitor and associate them with action plans.<br />
Modify – Click Modify to open the Alert Editor. You can add or select an<br />
action plan, or change the effect of the alert on a monitor’s health—for<br />
example, from Critical (red) to Warning (yellow).<br />
Remove – Select an alert and then click Remove to delete a defined alert<br />
for this monitor. The default alert, however, cannot be removed.<br />
Setting Up an Alert to Trigger an Action Plan<br />
The way you open the Alert Editor depends on the type of monitor<br />
that you are working with: dedicated or profile.<br />
To open the Alert Editor for a dedicated monitor:<br />
1. Click the Configure menu.<br />
2. Click Monitor Groups.<br />
3. In the Monitor Groups list, click the name of the monitor group<br />
you want to work with and click Modify.<br />
4. On the Monitors tab, select a dedicated monitor and then click<br />
Modify.<br />
422 <strong>OneSight</strong> <strong>Administrator</strong> <strong>Guide</strong>
Setting Up an Alert to Trigger an Action Plan<br />
5. Click the Alerts tab.<br />
6. To modify an existing alert, select it and then click Modify. The<br />
Alert Editor opens. To add a new alert, click Add. The Alert<br />
Editor opens.<br />
To open the Alert Editor for a profile monitor:<br />
Chapter 5: Configuring Monitors 423
Setting Up an Alert to Trigger an Action Plan<br />
1. Click the Configure menu.<br />
2. Click Monitor Groups.<br />
3. In the Monitor Groups list, click the name of the monitor group<br />
you want to work with and click Modify.<br />
4. On the Monitors tab, select a profile monitor and then click<br />
Modify.<br />
5. In the Monitor Editor, click the Profile Editor button.<br />
424 <strong>OneSight</strong> <strong>Administrator</strong> <strong>Guide</strong>
Setting Up an Alert to Trigger an Action Plan<br />
6. In the Profile Editor, select the metric you want to create an<br />
alert for under Metrics and click the Add button on the right, in<br />
the Alerts group box. If you are modifying a metric’s existing<br />
alert, highlight the metric, then the alert, and click Modify. The<br />
Alert Editor opens.<br />
The Alert Editor<br />
Use the Alert Editor to configure alerts for a <strong>OneSight</strong> dedicated<br />
monitor or for a profile metric. Alerts define problem conditions the<br />
monitor or metric should detect and specify what <strong>OneSight</strong> should<br />
do if a problem occurs. The options available to you in the Alert<br />
Editor depend on the type of dedicated monitor you are configuring<br />
or on the data source used by the profile metric you are configuring.<br />
General Tab Main Settings<br />
Override profile – This field is displayed for <strong>OneSight</strong> Voice<br />
Transaction Profile monitors, <strong>OneSight</strong> Voice Watch Profile<br />
monitors, <strong>OneSight</strong> Voice Quality – Advanced monitors, and<br />
Empirix e-TEST Transaction monitors. Select this option to change<br />
alerts for this monitor. The profile itself will not be affected.<br />
Chapter 5: Configuring Monitors 425
Setting Up an Alert to Trigger an Action Plan<br />
Description – Enter a unique description for this alert. This text<br />
appears on the Status page and the Alerts page if an alert occurs.<br />
This description is also included in e-mail messages.<br />
Respond if – Specifies performance criteria<br />
for the monitored component. If the monitor detects the condition<br />
defined here, an alert occurs that can trigger a response.<br />
Notify Once – The response is triggered only once while the<br />
measured condition is true, regardless of how long the<br />
measurement stays above the threshold. When the measurement<br />
drops below the defined threshold (based on Threshold and Trigger<br />
Response if Samples Out of Samples Crossed Threshold<br />
settings) the alert is retired. Health is reset to good and any action<br />
plan that is in effect is terminated.<br />
Notify Repeatedly – The response is triggered when the measured<br />
condition is true. The response will continue to be triggered at<br />
every sample interval for as long as the condition is true. Use the<br />
Trigger Response if Samples Out of Samples Crossed<br />
Threshold settings to avoid triggering responses during acceptable<br />
spikes.<br />
The settings available in the Respond If list depend on the profile<br />
metric or dedicated monitor that you are configuring. Use the<br />
settings to choose under which condition <strong>OneSight</strong> should trigger a<br />
response:<br />
Greater Than Threshold – The response triggered by this setting<br />
can be an action plan (selected under Respond By), a health reset<br />
(selected under Apply To), or both. The following graphics show<br />
notify once followed by notify repeatedly.<br />
426 <strong>OneSight</strong> <strong>Administrator</strong> <strong>Guide</strong>
Setting Up an Alert to Trigger an Action Plan<br />
If an action plan is selected in the Respond By list, it is first<br />
triggered if the metric or monitor measurement is greater than the<br />
Threshold value. Use the Trigger Response if Samples Out of <br />
Samples Crossed Threshold settings to avoid triggering responses<br />
during acceptable spikes.<br />
If Warning State or Critical State is selected in the Apply To list,<br />
the monitor’s health will change to warning (yellow) or critical<br />
(red) when the measurement is greater than the Threshold value<br />
(based on Threshold and Trigger Response if Samples Out of <br />
Samples Crossed Threshold settings).<br />
Less Than Threshold – The response triggered by this setting can<br />
be an action plan (selected in the Respond By list), a health reset<br />
(selected in the Apply To list), or both. The following graphics<br />
show notify once followed by notify repeatedly.<br />
Chapter 5: Configuring Monitors 427
Setting Up an Alert to Trigger an Action Plan<br />
If an action plan is selected in the Respond By list, it is first<br />
triggered if the metric or monitor measurement is less than the<br />
Threshold value. Use the Trigger Response if Samples Out of<br />
Samples Crossed Threshold settings to avoid triggering<br />
responses during ―acceptable spikes.‖<br />
If Warning State or Error State is selected in the Apply To list, the<br />
monitor’s health will change to warning (yellow) or critical (red)<br />
the first time the measurement is less than the Threshold value.<br />
This value is based on settings for both Threshold and Trigger<br />
Response if Samples Out of Samples Crossed Threshold).<br />
Not Equal To – The response triggered by this setting can be an<br />
action plan (selected in the Respond By list), a health reset<br />
(selected in the Apply To list), or both.<br />
If an action plan is selected in the Respond By list, it is first<br />
triggered if the metric or monitor measurement is not equal to the<br />
Threshold value. Use the Trigger Response if Samples Out of<br />
Samples Crossed Threshold settings to avoid triggering<br />
responses during ―acceptable spikes.‖<br />
If Warning State or Error State is selected in the Apply To list, the<br />
monitor’s health will change to warning (yellow) or critical (red)<br />
the first time the measurement is not equal to the Threshold<br />
value. This value is based on settings for both Threshold and<br />
Trigger Response if Samples Out of Samples Crossed<br />
Threshold).<br />
428 <strong>OneSight</strong> <strong>Administrator</strong> <strong>Guide</strong>
Setting Up an Alert to Trigger an Action Plan<br />
Equal Threshold – The response triggered by this setting can be<br />
an action plan (selected in the Respond By list), a health reset<br />
(selected in the Apply To list), or both. The following graphics<br />
show notify once followed by notify repeatedly.<br />
If an action plan is selected in the Respond By list, it is first<br />
triggered if the metric or monitor measurement is equal to the<br />
Threshold value. Use the Trigger Response if Samples Out of<br />
Samples Crossed Threshold settings to avoid triggering<br />
responses during ―acceptable spikes.‖<br />
If Warning State or Error State is selected in the Apply To list, the<br />
monitor’s health will change to warning (yellow) or critical (red)<br />
the first time the measurement is equal to the Threshold value.<br />
This value is based on settings for both Threshold and Trigger<br />
Response if Samples Out of Samples Crossed Threshold).<br />
Chapter 5: Configuring Monitors 429
Setting Up an Alert to Trigger an Action Plan<br />
Threshold Range – This option lets you enter a range for the alert.<br />
This eliminates more than one alert being sent when both<br />
warning and critical thresholds are broken in the same sample<br />
period.<br />
Report Sample Failure – By default, every profile metric and<br />
dedicated monitor has an alert with this Respond If setting. The<br />
response triggered by this setting can be an action plan (selected<br />
in the Respond By list), a health reset (selected in the Apply To<br />
list), or both. You cannot create new Report Sample Failure<br />
alerts; you can only modify them.<br />
Acquisition Failure – By default, every profile metric and<br />
dedicated monitor has an alert with this Respond If setting. By<br />
default, these are considered warning states. The response<br />
triggered by this setting can be an action plan (selected in the<br />
Respond By list), a health reset (selected in the Apply To list), or<br />
both. You cannot create new Acquisition Failure alerts; you can<br />
only modify them.<br />
An acquisition failure is caused by problems that are not related<br />
to the target of the monitor and do not count against your<br />
Availability Report. Acquisition failures caused by the failure to<br />
find a framework will not generate a good state response plan.<br />
These failures are caused by an incorrectly configured monitor<br />
and are fixed by reconfiguring the monitor. Acquisition failures<br />
created by the agent will generate a good state response plan.<br />
430 <strong>OneSight</strong> <strong>Administrator</strong> <strong>Guide</strong>
Setting Up an Alert to Trigger an Action Plan<br />
Redirection – This setting only applies to the URL monitor. The<br />
response triggered by this setting can be an action plan (selected<br />
in the Respond By list), a health reset (selected in the Apply To<br />
list), or both.<br />
The response is triggered if the web server detects that a page<br />
redirection has occurred.<br />
Missing Image – This setting only applies to the URL monitor.<br />
The response is triggered is a web page has a link to an image<br />
that cannot be found.<br />
Pattern Match – This setting applies to profile metrics using Log<br />
File as their data source, and to the Log File, Event Log, and<br />
string-based Probe dedicated monitors. The response is triggered<br />
if the string entered under Search String is matched. When you<br />
select this response type, you can configure specific Pattern<br />
Match configuration options.<br />
The response triggered by this setting can be an action plan<br />
(selected in the Respond By list), a health reset (selected in the<br />
Apply To list), or both.<br />
NT Event Log Match – This setting only applies to profile metrics<br />
using NT Event Log as their data source. When you select this<br />
response type, you can configure specific NT Event Log Match<br />
configuration options.<br />
The response triggered by this setting can be an action plan<br />
(selected in the Respond By list), a health reset (selected in the<br />
Apply To list), or both.<br />
The response is triggered if the NT Event Source, NT Event ID,<br />
and NT Event Type listed under NT Event Log Settings is found<br />
in the Windows NT Event Log.<br />
All of the Event Log criteria that you specify have to be matched<br />
for an alert to be triggered. For example, if you set up an NT<br />
Chapter 5: Configuring Monitors 431
Setting Up an Alert to Trigger an Action Plan<br />
Event Source and NT Event ID (and NT Event Type is All NT<br />
Events), then both NT Event Source and NT Event ID have to<br />
match. If you set up an NT Event Source, NT Event ID and NT<br />
Event Type other than All NT Events, then all specifications have<br />
to match.<br />
This alert also applies to Windows 2000 systems.<br />
SNMP Trap – This setting only applies to an SNMP Trap dedicated<br />
monitor. When you select this response type, you can configure<br />
specific SNMP Trap match configuration options.<br />
The response triggered by this setting can be an action plan<br />
(selected in the Respond By list), a health reset (selected in the<br />
Apply To list), or both. The response is triggered if the SNMP Trap<br />
meets the basic Enterprise and Trap Type filter criteria in the<br />
General tab of the SNMP Trap monitor.<br />
All of the SNMP Trap criteria that you specify have to be<br />
matched for an alert to be triggered. For example, if you set up<br />
Enterprise and Trap Type filter criteria, then the trap message<br />
must meet both the Enterprise and the Type criteria. If you set up<br />
an SNMP Trap Search string, then the trap must meet the General<br />
filter criteria and the Search string criteria.<br />
e-TEST Transaction Failure – This setting applies to e-TEST<br />
Transaction monitors. An alert is triggered based on your entries<br />
and selections in the following fields:<br />
Test Name Filter – Specify a Perl-like expression that the test<br />
name must match for an alert to occur. For example, if the<br />
filter is /.*Succeeded.*/ then an alert fires for the test<br />
name ―LoginSucceeded‖ but not for test ―MyTM.‖ This test<br />
does not apply to unnamed tests such as navigation failure or<br />
timeout. These tests will trigger an alert even if a test name<br />
is specified.<br />
432 <strong>OneSight</strong> <strong>Administrator</strong> <strong>Guide</strong>
Setting Up an Alert to Trigger an Action Plan<br />
Note: If the Test Name Filters are left blank the alert occurs no<br />
matter on which test the underlying failure occurs.<br />
Failure Types – Select the type of failures for which you<br />
want to receive an alert.<br />
Influences Availability – Indicates if this alert condition<br />
affects whether the monitor is available.<br />
Voice Transaction Failure – This setting applies to Voice<br />
Transaction monitors, Voice Watch Transaction monitors, and the<br />
script steps in Voice Quality - Advanced profile monitors. This alert<br />
responds to failures that the <strong>OneSight</strong> Voice Engine receives from<br />
the CallMaster Server and that <strong>OneSight</strong> Voice Watch receives<br />
from the Voice Watch Server. This alert supports pattern matching<br />
using a Perl expression, allowing you to associate an action plan<br />
with a particular error message as described in the “Sample Failure<br />
and Crossed Threshold Settings” section below.<br />
Voice Transaction Warning – This setting applies to Voice<br />
Transaction monitors, Voice Watch Transaction monitors, and the<br />
script steps in Voice Quality - Advanced profile monitors. An alert<br />
is triggered if any step in the script returns a warning.<br />
Critical Voice Quality Score – This setting applies to the MOS and<br />
PESQ score metrics in the <strong>OneSight</strong> Voice Quality Basic and<br />
Advanced monitors. An alert is triggered when the score exceeds<br />
the threshold settings.<br />
Low Voice Quality Score – This setting applies to the MOS and<br />
PESQ score metrics in the <strong>OneSight</strong> Voice Quality Basic and<br />
Advanced monitors. An alert is triggered when the score exceeds<br />
the threshold settings.<br />
Respond by – Select how you want to respond if the alert condition<br />
occurs by selecting an action plan from the list box. Options<br />
displayed in this list box represent previously configured plans. To<br />
create a new plan for this alert, click . If you don’t<br />
Chapter 5: Configuring Monitors 433
Setting Up an Alert to Trigger an Action Plan<br />
want an action plan to be triggered in response to an alert, select<br />
.<br />
Apply to – Select what the monitor’s health should be when a<br />
sample cannot be gathered, when a threshold is crossed, when a<br />
web page is redirected, or when a string match occurs. For example,<br />
if you select Greater Than Threshold (Notify Once) in the Respond If<br />
list, Warning State in the Apply To list, and the threshold value is<br />
exceeded, a Warning state will result and the monitor health icon<br />
will turn yellow on the Console Status page. If the performance<br />
measurement drops back down below the threshold, the monitor’s<br />
state will be reset to good (green).<br />
Respond by (When Alert Is No Longer in Effect) – You can configure<br />
an action plan to notify you when an alert condition is no longer in<br />
effect. This option allows you to receive an e-mail, for example, if a<br />
previously reported problem has been corrected. Whenever an alert<br />
associated with a sample failure or an alert for a ―notify once‖<br />
threshold returns to a good state after triggering an alert, any<br />
current alert is retired and a good state alert is triggered.<br />
Select how you want to respond if the alert condition occurs by<br />
selecting an Action Plan from the list box. Options displayed in this<br />
list box represent previously configured plans. To create a new plan<br />
for this alert, click . If you do not want an action<br />
plan to be triggered in response to an alert, select .<br />
If the alert is configured to avoid alerting on acceptable spikes<br />
(Trigger Response if of Samples...), this response regarding<br />
the return to a good condition occurs only after the of <br />
response has been triggered.<br />
Scope – These options are used to determine when an alert should<br />
occur when more than one location is being used.<br />
Alert when locations in alert state – One response plan will be<br />
triggered when the Nth location has this alert trigger. The<br />
434 <strong>OneSight</strong> <strong>Administrator</strong> <strong>Guide</strong>
Setting Up an Alert to Trigger an Action Plan<br />
response plan will be retired when N minus one or fewer<br />
locations have this alert triggered. Agents will alert.<br />
Alert when percent locations in alert state – One response plan<br />
will be triggered when the N percentage of locations has this alert<br />
trigger. The response plan will be retired when less than N<br />
percent of locations have this alert triggered. Agents will alert.<br />
Alert aggregate locations in alert state – One response plan<br />
will be fired when the aggregated value exceeds the specified<br />
threshold. This option can only be applied to a threshold alert.<br />
Agents will not alert.<br />
Respond by – You can configure an action plan to notify you when<br />
an alert condition is no longer in effect, that is, when the monitored<br />
component returns to a good state. Select an action plan or select<br />
add action plan to display the Action Plan Editor for adding a new<br />
action plan.<br />
Time Interval – Select the time interval for which alerts will be<br />
triggered.<br />
Sample Failure and Crossed Threshold settings<br />
Threshold – Enter the value over which <strong>OneSight</strong> should trigger a<br />
response.<br />
Note: Values over eight digits will be displayed in scientific<br />
notation if you exit the dialog box and re-enter it. For example,<br />
10,000,000 is displayed as 1.0E7. To make this not occur, change<br />
the UI.Alerts.FormatThreshold property in the<br />
OSServer.properties file to true.<br />
Trigger Response if Samples Out of Samples...<br />
You can avoid triggering alerts when a single ―spike‖ of poor<br />
performance occurs. Use of to bypass acceptable spikes for<br />
alerts configured to notify repeatedly or for sample failures.<br />
Chapter 5: Configuring Monitors 435
Setting Up an Alert to Trigger an Action Plan<br />
For threshold settings, use the Trigger Response if Samples Out of<br />
Samples Crossed Threshold.<br />
For a sample failure, use the Trigger Response if Samples Out of<br />
Samples Failed.<br />
For , enter the number of sample counts that must fail or cross a<br />
threshold before <strong>OneSight</strong> triggers a response. For , enter a total<br />
number (a count) of samples. The value of must be a number<br />
less than or equal to .<br />
The failures that contribute to this count can be interspersed with<br />
successful samples. For example, if 3 of 5 samples must fail to<br />
trigger an alert, a failure for the first, third, and fifth samples and<br />
successful measurements for the second and fourth samples will<br />
generate an alert.<br />
Sampling intervals, or the rates at which information is being<br />
gathered, are set in the Add Monitor dialog box for dedicated<br />
monitors, and in the Metric Editor (Agents tab) for profile metrics.<br />
Example 1 – The alert has the following settings:<br />
Respond If: Greater Than Threshold (Notify Once)<br />
Threshold: 25<br />
Trigger Response if 3 Samples<br />
Out of 4 Samples Crossed Threshold<br />
436 <strong>OneSight</strong> <strong>Administrator</strong> <strong>Guide</strong>
Setting Up an Alert to Trigger an Action Plan<br />
The following timeline shows how alerts are generated and retired<br />
as samples are taken:<br />
Sample Value Action Reason<br />
1st 20 none 3 samples > 25<br />
required to trigger alert<br />
2nd 30 none 3 samples > 25<br />
required to trigger alert<br />
3rd 30 none 3 samples > 25 required<br />
to trigger alert<br />
4th 20 none 3 samples > 25<br />
required to trigger alert<br />
5th 31 Alert: set health to<br />
Warning and/or<br />
start an action<br />
plan 3 of 4 are<br />
over 25<br />
6th 31 No new alert:<br />
health remains<br />
Warning; existing<br />
action plan<br />
continues<br />
processing if not<br />
completed already<br />
7th 21 Retire alert: set<br />
health to Good<br />
and retire the<br />
existing action<br />
plan<br />
Health already in<br />
Warning state, Action<br />
plan already in effect<br />
Only 2 of last 4<br />
samples are > 25<br />
Chapter 5: Configuring Monitors 437
Setting Up an Alert to Trigger an Action Plan<br />
Example 2 – The alert has the following settings:<br />
Respond If: Greater Than Threshold (Notify Repeatedly)<br />
Threshold: 25<br />
Trigger Response if 3 Samples<br />
Out of 4 Samples Crossed Threshold<br />
The following timeline shows how alerts are generated and retired<br />
as samples are taken:<br />
Sample Value Action Reason<br />
1st 20 none 3 samples > 25<br />
required to trigger alert<br />
2nd 30 none 3 samples > 25<br />
required to trigger alert<br />
3rd 30 none 3 samples > 25<br />
required to trigger alert<br />
4th 20 none 3 samples > 25<br />
required to trigger alert<br />
5th 31 Alert: may trigger<br />
an action plan<br />
6th 31 Alert: may trigger<br />
an action plan<br />
3 of 4 samples are >25<br />
3 of 4 sample are > 25,<br />
alert type is Notify<br />
Repeatedly<br />
7th 21 none Only 2 of 4 last<br />
samples are > 25<br />
438 <strong>OneSight</strong> <strong>Administrator</strong> <strong>Guide</strong>
Setting Up an Alert to Trigger an Action Plan<br />
Alert Message Filter – This setting applies to Voice Transaction<br />
Failure and e-TEST Transaction Failure alerts. It lets you use a Perl<br />
expression to associate an action plan with particular error<br />
messages. For example, if the filter is ―/.*Timed out.*/‖ then an<br />
alert fires for the alert message ―-14:Times out when waiting for<br />
energy,‖ but not for the message ―-10: Application under test is not<br />
responding to the seized line.‖<br />
If this field is left blank, the alert fires regardless of the error<br />
message that is received.<br />
Notes Tab Settings<br />
The Notes tab lets you enter general information about this alert.<br />
Notes will be displayed on the Status and Alerts pages. In addition,<br />
they are used when running Intellisearch against monitors. Alerts<br />
with similar notes will be correlated.<br />
Notes for this alert – Enter any information relevant to this alert.<br />
Alert Editor Log Profile Metrics<br />
Use the Alert Editor to configure alerts for log file and NT Event Log<br />
metrics within a profile.<br />
Logfile Settings<br />
These options are available when you select Pattern Match in the Alert<br />
Editor. These apply to a profile that uses a log file as well as the Log File<br />
dedicated monitor.<br />
When you configure logfile settings for a profile monitor, the data source<br />
for this metric is Log File. These settings apply to events logged in the<br />
file specified in the Log File Data Source Configuration dialog box.<br />
Search String – Enter the string which, if found in the log file, will<br />
trigger a response. Enter the string value exactly as it would appear in the<br />
log file.<br />
Chapter 5: Configuring Monitors 439
Setting Up an Alert to Trigger an Action Plan<br />
Reset Sample Count – Determines how many sampling intervals need to<br />
occur after the above string is detected in the log file before an alert is<br />
retired. When the alert retires, the monitor or metric health is reset to<br />
Good (green) and any action plan associated with the alert is immediately<br />
terminated. If Reset Sample Count is set to 0, the Pattern Match alert will<br />
never trigger a response.<br />
NT Event Log Settings<br />
These options are available when you select NT Event Log Match in the<br />
Alert Editor Respond If group box. The data source for this metric is NT<br />
Event Log.<br />
NT Event Log Settings refer to events logged in the Windows NT Event<br />
Viewer (see Displaying the Windows NT Event Viewer for steps on<br />
how to access the Event Viewer). If the values you enter in the settings<br />
described below appear in the Windows NT Event Viewer, a response will<br />
be triggered. You can use the following three settings independently or<br />
together (recommended).<br />
Trigger Response if NT Source is – This setting refers to the Source<br />
column in the Windows NT Event Viewer. If, for example, you enter<br />
SNMP under Trigger Response if NT Source Is, a response will be<br />
triggered if SNMP event is logged in Event Viewer that has SNMP as its<br />
source (SNMP will be in the event’s Source column). Separate multiple<br />
sources with a comma.<br />
Trigger Response if NT Event ID is – This setting refers to the Event<br />
column in the Windows NT Event Viewer. If, for example, you enter<br />
1001 under Trigger Response if NT Event ID Is, a response will be<br />
triggered if an event is logged in Event Viewer that has 1001 as its event<br />
ID (1001 will be listed in the event’s Event (ID) column). You can enter<br />
one ID, multiple IDs separated by commas, or a range of IDs. For<br />
example, “1” or “1,2” or “1,2,7-10”<br />
Trigger Response if Category is – This setting refers to the Category<br />
column in the Windows NT Event Viewer. If, for example, you enter<br />
General under Trigger Response if Category Is, a response will be<br />
triggered if an event is logged in Event Viewer that has General as its<br />
440 <strong>OneSight</strong> <strong>Administrator</strong> <strong>Guide</strong>
Setting Up an Alert to Trigger an Action Plan<br />
Category (General will be listed in the event’s Category column). You can<br />
enter a list of strings or a list of number ranges separated by commas.<br />
Trigger Response if Username is – This setting refers to the Name<br />
column in the Windows NT Event Viewer. If, for example, you enter<br />
Security under Trigger Response if Username Is, a response will be<br />
triggered if an event is logged in Event Viewer that has Security as its<br />
Category (Security will be listed in the event’s Name column). You can<br />
enter a list of strings separated by commas.<br />
NT Event Type – This setting refers to the symbols to the far left of events<br />
listed in the Windows NT Event Viewer. The symbols refer to event<br />
types. If you’re not sure which event type a symbol refers to, do the<br />
following in the Windows NT Event Viewer: highlight the event, click<br />
Detail on the View menu, and look under Type in the Event Detail dialog<br />
box.<br />
Reset Sample Count – Determines how many sampling intervals need to<br />
occur after the above conditions are met before an alert is retired. When<br />
the alert retires, the monitor or metric health is reset to Good (green) and<br />
any action plan associated with the alert is immediately terminated. If<br />
Reset Sample Count is set to 0, the NT Event Log Match alert will never<br />
trigger a response.<br />
Search String – Specifies a pattern that is validated against the<br />
description of the event. This string can be a full Perl regular expression<br />
(however, it does not return a result). See Using Regular Expressions<br />
for Pattern Matching in Chapter 5 for more information about<br />
specifying Perl expressions.<br />
Trigger Response for event that does NOT match the string – Triggers<br />
an alert for all errors except those that match the search string.<br />
SNMP Trap Settings<br />
These options are available when you select SNMP Trap in the Alert<br />
Editor Respond If group box. The data source for this metric is SNMP<br />
Trap.<br />
Chapter 5: Configuring Monitors 441
Setting Up an Alert to Trigger an Action Plan<br />
SNMP Trap Search – Specifies the text substring pattern to match before<br />
triggering an alert. This field is case-sensitive. If blank, all traps that meet<br />
the basic Enterprise and Trap Type filter criteria in the General tab of the<br />
SNMP Trap monitor trigger the alert. Enter any substring to further<br />
define the alert criteria.<br />
To alert on any trap originating from a particular IP address, enter the IP<br />
address.<br />
SNMP Trap Reset String – Specifies the string that indicates the alert<br />
condition no longer exists and the monitor can return to a Good state.<br />
Enter this field when the device sending the traps sends an ―all clear‖ type<br />
trap when the condition no longer exists. In this case, the Reset time<br />
should be set to its maximum value of 9999 (7 days) to ensure that the<br />
monitor does not return to a good state prematurely.<br />
If the device sends traps at a specified interval as long as the condition<br />
exists, and the absence of such traps indicates that the problem no longer<br />
exists, leave this field blank.<br />
Reset time (minutes) – Specifies how long to wait before returning to a<br />
Good state after an SNMP Trap message triggers an alert. If no additional<br />
SNMP Trap alerts occur for the length of the Reset time, <strong>OneSight</strong><br />
returns the SNMP Trap monitor to a Good state.<br />
Setting the reset time to zero causes the trap to reset after zero minutes<br />
have passed, which means the trap alert will never be set.<br />
Note: If you specify both the SNMP Trap Reset String and the Reset<br />
time, whichever occurs first will reset the trap’s state. If you want to<br />
reset only by string, it is recommended that you set the reset time to<br />
9999.<br />
Example SNMP Trap Message<br />
Trap Received:<br />
Enterprise: oneSightTraps<br />
Trap Event Name: oneSightCritical<br />
Object ID:<br />
.iso.org.dod.internet.private.enterprises.empirix.oneSig<br />
442 <strong>OneSight</strong> <strong>Administrator</strong> <strong>Guide</strong>
Setting Up an Alert to Trigger an Action Plan<br />
ht.oneSightEventData.eventDescription.0<br />
GT 2 on http://www.empirix.com<br />
Object ID:<br />
.iso.org.dod.internet.private.enterprises.empirix.oneSig<br />
ht.oneSightEventData.extEventDescription.0<br />
GT 2: Value was 2.823 seconds, threshold is 2 seconds<br />
(10/15/01 3:24 PM)<br />
Event: GT 2<br />
...<br />
Triggering an E-mail Action Plan<br />
To set up an alert to trigger an e-mail action plan:<br />
1. If you have not already created your monitor, create one now.<br />
2. Make sure you have already set up an e-mail action plan that<br />
will let you know when your monitor has a problem.<br />
3. Click the Configure menu, click Monitor Groups, then click<br />
Modify.<br />
4. Click the Monitor you want to associate with an e-mail alert,<br />
then click Modify.<br />
5. On the Alerts tab, you will see at least one preconfigured alert<br />
that notifies you if monitoring cannot be performed. By default,<br />
a failure to monitor changes the status of the monitor on the<br />
Status page to Red (Critical). However, if you want to be<br />
notified about this failure, you must associate the alert with an<br />
action plan.<br />
6. Select the default alert named for the state you associate with<br />
monitor failure (for example, URL Unavailable), and click<br />
Modify.<br />
7. In the Alert Editor, the Respond By option controls what action<br />
is triggered when an alert condition occurs. By default, there is<br />
no action plan associated with this alert condition, so you will<br />
see Respond by .<br />
Chapter 5: Configuring Monitors 443
Setting Up an Alert to Trigger an Action Plan<br />
Click the arrow next to the Respond By option and select an<br />
action plan you have configured with e-mail notification, then<br />
click OK.<br />
8. Click OK to update your monitor’s settings.<br />
Note: The amount of time it takes for the monitor to escalate the<br />
status to a Critical condition depends on factors such as how often<br />
the monitor tries to take a data sample. If you want to quickly<br />
confirm that your e-mail action plan is working, you may want to<br />
temporarily modify your monitor so that it will not sample<br />
successfully (for example, specify an incorrect URL or IP address)<br />
and then set it to sample at a very frequent rate.<br />
Creating a Threshold-based Alert<br />
If you want to know when web component performance either goes above<br />
or goes below an acceptable measurement, you can set up an alert that<br />
monitors a performance threshold. When the monitor detects that the<br />
threshold has been crossed, it triggers the alert.<br />
To create a threshold-based alert:<br />
1. If you have not already created your monitor, create one now.<br />
2. Click the Configure menu, click Monitor Groups, then click<br />
Modify.<br />
3. Click the monitor you want to configure, then click Modify.<br />
4. Click the Alerts tab, and then click Add to open the Alert Editor.<br />
5. In the Description box, type information that helps you to<br />
identify what this alert is measuring. For example, Slow Page<br />
Response Time.<br />
6. In the Respond If box, select the threshold condition that you<br />
want the monitor to respond to:<br />
444 <strong>OneSight</strong> <strong>Administrator</strong> <strong>Guide</strong>
Setting Up an Alert to Trigger an Action Plan<br />
Greater Than Threshold (Notify Once) – This alert will be<br />
produced the first time the measurement is greater than the<br />
Threshold value. The response is triggered only once while<br />
the measured condition is true. When the measurement drops<br />
below the defined thresholds the alert is retired.<br />
Less Than Threshold (Notify Once) – This alert will be<br />
produced the first time the measurement is less than the<br />
Threshold value. The response is triggered only once while<br />
the measured condition is true. When the measurement rises<br />
above the defined thresholds the alert is retired.<br />
Equal Threshold (Notify Once) – This alert will be produced<br />
the first time the measurement is equal to the Threshold<br />
value. The response is triggered only once while the<br />
measured condition is true. When the measurement rises<br />
above or drops below the defined threshold, the alert is<br />
retired.<br />
Greater Than Threshold (Notify Repeatedly) – The response is<br />
triggered if the measurement is greater than the Threshold<br />
value. The response will continue to be triggered at every<br />
sample interval for as long as the measurement stays above<br />
the threshold.<br />
Less Than Threshold (Notify Repeatedly) – The response is<br />
triggered if the measurement is less than the Threshold value.<br />
The response will continue to be triggered at every sample<br />
interval for as long as the measurement stays below the<br />
threshold.<br />
Equal Threshold (Notify Repeatedly) – This alert will be<br />
produced the first time the measurement is equal to the<br />
Threshold value. The response will continue to be triggered<br />
at every sample interval for as long as the measurement stays<br />
equal to the threshold.<br />
Chapter 5: Configuring Monitors 445
Setting Up an Alert to Trigger an Action Plan<br />
7. When you select a Threshold alert, the Alert Editor dialog box<br />
includes a Threshold Settings group box. Threshold settings<br />
affect when a response is triggered.<br />
Setting the Threshold – If you chose Greater Than Threshold,<br />
enter a value that represents the maximum measurement that<br />
you find acceptable. If you chose Less Than Threshold, enter a<br />
value that represents the minimum measurement that you find<br />
acceptable. For example, for a URL monitor, if you consider<br />
any response time that is 15 seconds or less to be acceptable, set<br />
Respond If to Greater Than Threshold and use 15 seconds as the<br />
threshold.<br />
Avoiding Alerts from “Spikes” – You can use the Trigger<br />
Response if Samples Out of Samples Crossed Threshold<br />
settings to avoid triggering responses during acceptable spikes.<br />
For , enter the number of samples that must be ―bad‖ before<br />
<strong>OneSight</strong> triggers a response. For , enter a total number (a<br />
count) of samples. The value of must be a number less than<br />
or equal to .<br />
8. If you want the alert to trigger an action plan when the<br />
threshold is crossed, click the arrow next to the Respond By<br />
option and select an action plan. Otherwise, accept the default:<br />
Respond by .<br />
9. If you want the alert to change the health status of the monitor<br />
when the threshold is crossed, click the arrow next to the Apply<br />
To option and select the health state you want the alert to<br />
trigger. Otherwise, accept the default: Apply to Nothing.<br />
10. Click OK to close the Alert Editor. Click OK again to save your<br />
changes to the monitor and return to the Monitor Group Editor.<br />
Then click OK to update the monitor group.<br />
446 <strong>OneSight</strong> <strong>Administrator</strong> <strong>Guide</strong>
Editing a Response to an Alert – Dedicated Monitor<br />
Editing a Response to an Alert – Dedicated<br />
Monitor<br />
By default, most of the dedicated monitors provided with <strong>OneSight</strong><br />
are linked to at least one response. If you need to modify a response<br />
or create a new one, you will need to do two things in the Alert<br />
Editor:<br />
Define an alert: What must happen for the response to be<br />
triggered?<br />
Define a response: What should happen if a sample failure is<br />
received or a threshold is crossed?<br />
To define an alert for a dedicated monitor:<br />
1. In the Add Monitor dialog box or the Monitor Configuration<br />
dialog box, click the Alerts tab.<br />
2. If you are adding a new alert, click Add. If you are modifying an<br />
existing alert, select it and click Modify.<br />
3. The Alert Editor opens. Enter a description of the alert in the<br />
Description box.<br />
4. Select a Respond If setting. See the Respond If setting<br />
descriptions for information.<br />
5. Enter a value in the Threshold box. The value you enter should<br />
reflect what’s being measured and at what point you want<br />
<strong>OneSight</strong> to trigger a response. See Threshold Settings for more<br />
information.<br />
6. (Optional) Use the Trigger Response if Samples Out of <br />
Samples Crossed Threshold or Samples Failed settings to avoid<br />
triggering responses during acceptable spikes.<br />
Chapter 5: Configuring Monitors 447
Editing a Response to an Alert – Dedicated Monitor<br />
For , enter the number of sample counts that must be ―bad‖<br />
before <strong>OneSight</strong> triggers a response. For , enter a total<br />
number (a count) of samples. The value of must be a<br />
number less than or equal to .<br />
7. Click OK to exit the Alert Editor and return to the Add Monitor<br />
dialog box. The alert you defined appears in the Alerts list.<br />
To define a response for a dedicated monitor:<br />
1. In the Add Monitor dialog box or the Monitor Configuration<br />
dialog box, click the Alerts tab.<br />
2. If you are adding a new alert, click Add, define the alert<br />
condition and then proceed with the steps listed below. If you<br />
are modifying an existing alert, select it and click Modify.<br />
3. In the Respond By list, select an action plan or click to create one.<br />
4. In the Apply To list, if available, select how the alert should<br />
affect the monitor’s health. For example, if the Sample Failure<br />
occurs, decide if the monitor should be set to a Warning state<br />
(the monitor will turn yellow on the Status page), a Critical<br />
state (the monitor status will turn red), or Nothing (no change in<br />
monitor status).<br />
Note: The Apply To setting is not available if Respond If is set to<br />
Greater Than Threshold (Notify Repeatedly) or Less Than<br />
Threshold (Notify Repeatedly).<br />
448 <strong>OneSight</strong> <strong>Administrator</strong> <strong>Guide</strong>
Editing a Response to an Alert – Profile Metric<br />
Editing a Response to an Alert – Profile Metric<br />
By default, most of the profile metrics provided with <strong>OneSight</strong> are<br />
linked to at least one response. If you need to modify a response or<br />
create a new one, you will need to do two things in the Alert Editor:<br />
Define an alert: What must occur for the response to be<br />
triggered?<br />
Define a response: What should happen if the alert condition<br />
occurs?<br />
To define an alert for a profile metric:<br />
1. In the Profile Editor, highlight the metric you want to create an<br />
alert for under Metrics and click the Add button on the right, in<br />
the Alerts group box. If you are modifying a metric’s existing<br />
alert, highlight the metric, then the alert, and click Modify.<br />
2. The Alert Editor opens. Enter a description of the alert in the<br />
Description box.<br />
3. Select a Respond if setting. See the Respond if setting<br />
descriptions for more information.<br />
4. The options available in the lower half of the Alert Editor<br />
change depending on the type of alert you are configuring. Do<br />
one of the following:<br />
Threshold Settings – enter a value in the Threshold box. The<br />
value you enter should reflect what’s being measured and at<br />
what point you want <strong>OneSight</strong> to trigger a response. See<br />
Threshold Settings for more information.<br />
Logfile Settings – enter the string that, if found in the log file,<br />
will trigger a response.<br />
Chapter 5: Configuring Monitors 449
Editing a Response to an Alert – Profile Metric<br />
NT Event Log Settings – enter values that, if they are found in<br />
the machine’s Windows NT Event Viewer, will trigger a<br />
response. See NT Event Log Settings for more information.<br />
5. (Optional) If defining a threshold-based alert, use the Trigger<br />
Response if Samples Out of Samples Crossed Threshold<br />
settings to avoid triggering responses during acceptable spikes.<br />
Trigger Response if Samples<br />
Out of Samples Cross Threshold<br />
For , enter the number of sample counts that must be ―bad‖<br />
before <strong>OneSight</strong> triggers a response. For , enter a total<br />
number (a count) of samples. To find out how often a metric is<br />
sampling a web component, see the Sampling Interval setting in<br />
the Metric Editor (Data Sources tab). The value of must be<br />
a number less than or equal to .<br />
Note: If you do not enter values for these settings, <strong>OneSight</strong> will<br />
trigger the response (if any) based on the value entered in the<br />
Threshold box.<br />
6. Click OK to close the Alert Editor and return to the Profile<br />
Editor. To close the Profile Editor, click OK.<br />
To define a response for a profile metric:<br />
1. In the Profile Editor, highlight the metric you want to create a<br />
response for under Metrics.<br />
2. If you are adding a new alert, click the Add button on the right,<br />
in the Alerts group box, define the alert condition and then<br />
proceed with the steps listed below. If you are modifying an<br />
existing alert, select it in the Alerts group box and click Modify.<br />
3. In the Respond by list, select an action plan or click to create one.<br />
450 <strong>OneSight</strong> <strong>Administrator</strong> <strong>Guide</strong>
Displaying the Windows Event Viewer<br />
4. In the Apply to list, select what a crossed threshold or sample<br />
failure should mean in terms of the monitor’s health. For<br />
example, if the threshold is exceeded, decide if that should<br />
cause a Warning State (monitor will turn yellow on the Status<br />
page), Critical State (monitor will turn red), or Nothing.<br />
Note: The Apply to setting is not available if Respond if is set to<br />
Greater Than Threshold (Notify Repeatedly) or Less Than<br />
Threshold (Notify Repeatedly).<br />
Displaying the Windows Event Viewer<br />
To display the Windows Event Viewer:<br />
1. Click the Start button.<br />
2. Point to Programs, then Administrative Tools (Common). In<br />
Windows 2000 and 2003, point to Programs, then<br />
Administrative Tools.<br />
3. Click Event Viewer. The Windows Event Viewer opens.<br />
Chapter 5: Configuring Monitors 451
Configuring the Location From Which the Monitor Will Sample<br />
Configuring the Location From Which the<br />
Monitor Will Sample<br />
The Locations tab displays the Data Collector Locations from<br />
which the monitor checks your web site performance. One or more<br />
locations can be used. Refer to, ―Modifying the Location of<br />
Multiple Monitors,‖ later in this chapter for instructions on adding,<br />
changing, or deleting locations for several monitors at once.<br />
Note: Event Log and Perfmon monitors that do not have<br />
authentication configured will monitor using a local agent, if there<br />
is one, regardless of whether a location has been specified.<br />
Use all locations – Select this option to use all locations.<br />
Location – Specifies the Data Collector Locations from which the<br />
monitor checks performance. Locations that are available to the<br />
user group are listed. Select the locations for this monitor from the<br />
list.<br />
452 <strong>OneSight</strong> <strong>Administrator</strong> <strong>Guide</strong>
Adding a SmartLink to a Monitor<br />
Network – Specifies the network to which this location belongs.<br />
This information can be used for filtering reports.<br />
Region – Specifies the region to which this location belongs. This<br />
information can be used for filtering reports.<br />
Specify collection host – For Oracle Test for Web Applications<br />
Transaction monitors, specifies the name or IP address of the<br />
Remote Agent where the OATS Visual Script is running.<br />
Adding a SmartLink to a Monitor<br />
The SmartLinks tab lets you associate URLs with a particular<br />
monitor or metric. The URLs are available on the popup menu on<br />
the Status Details Page.<br />
URL – Displays the URLs currently associated with this monitor.<br />
Chapter 5: Configuring Monitors 453
Adding a SmartLink to a Monitor<br />
New Browser – Displays whether the URL should be displayed in a<br />
new browser window.<br />
Rollover Menu Text – Displays the text that will be displayed when<br />
you roll the mouse over the link on the Status Details page.<br />
Notes for this metric – Enter details about this metric in text or using<br />
HTML that can be found between the tags. These notes can<br />
be viewed by clicking on View notes for this metric on the popup<br />
menu on the Status Details page.<br />
Add – Displays the Smartlink Editor for adding a new URL.<br />
Modify – Displays the Smartlink Editor for modifying the selected<br />
URL.<br />
Remove – Deletes the selected URL.<br />
Click Add to add to display the Smartlink Editor dialog box.<br />
URL – Enter the URL that you want to associate with this monitor or<br />
metric. The URL can include specific substitution variables.<br />
Rollover Menu Text – Enter the text that you want to display when<br />
the mouse is rolled over the link on the Status Details page.<br />
454 <strong>OneSight</strong> <strong>Administrator</strong> <strong>Guide</strong>
Adding a SmartLink to a Monitor<br />
Open in New Browser Window – Select this option to open a new<br />
browser window when the link is clicked in the Status Details page.<br />
Substitution Variables – The following substitution variables are<br />
supported:<br />
Note: Depending on the context in which the variables are used,<br />
they may not get resolved. For example, %systemname% may not<br />
resolve when at a monitor group level since there may be any<br />
number of system names.<br />
%DateShort% – The locale-specific date that the metric was last<br />
measured in the format mm/dd/yy. For example, 4/4/01.<br />
%DateLong% – The locale-specific date that the metric was last<br />
measured, in long format. For example, Wednesday, April 4,<br />
2001.<br />
%TimeShort% – The locale-specific time that the metric was last<br />
measured, in short format. For example, 1:52 PM.<br />
%TimeLong% – The locale-specific time that the metric was last<br />
measured, in long format including the time zone. For example,<br />
1:52:16 PM PDT.<br />
%Value% – the numeric value of the metric. For example, 11.701<br />
seconds.<br />
%MonitorGroup% – The name of the Monitor Group that contains<br />
the metric. For example, Business Partner Extranet. If multiple<br />
Monitor Groups use this metric, the result is a comma delimited<br />
list.<br />
%SystemName% – The name of the system that the metric is<br />
applied against. For example, JBK_P3. For URL monitors, the<br />
system name is the URL that you are monitoring. For example,<br />
http://www.empirix.com. This lets you use %SystemName% as<br />
your SmartLink for a URL monitor.<br />
Chapter 5: Configuring Monitors 455
Adding a SmartLink to a Monitor<br />
%Monitor% – The name of the monitor that the metric is within.<br />
For example, URL (http://www.empirix.com).<br />
%Component% – The name of the component that the metric is<br />
applied against. For example, Disk C:.<br />
%Metric% – The name of the metric. For example, Disk: % Space<br />
Available.<br />
Note: For SNMP dedicated monitors, ―SNMP‖ is displayed.<br />
%Entity% – The monitored entity ID.<br />
%Item% – The metric item ID.<br />
%Location% – The location of the Data Collector.<br />
%_property% – Allows access to any monitor property. Substitute<br />
the word property for the actual property name. For example,<br />
some <strong>OneSight</strong> Voice Transaction and Voice Watch properties<br />
are:<br />
%_HIMServerName% – Returns the <strong>OneSight</strong> Voice<br />
Transaction server name.<br />
%_HIMPath% – Returns the path to the <strong>OneSight</strong> Admin and<br />
Detail .asp pages included with the <strong>OneSight</strong> Voice<br />
Transaction installation.<br />
%_HIMSID% – Returns the scenario ID.<br />
%_HIMSCID% – Returns the script ID.<br />
%_CPServerName% – Returns the Voice Watch server name.<br />
%_CPUserName% – Returns the User ID of the Voice Watch<br />
service account.<br />
456 <strong>OneSight</strong> <strong>Administrator</strong> <strong>Guide</strong>
Configure Monitor Attributes Tab<br />
%_CPPassword% – Returns the password of the Voice<br />
Watch service account.<br />
%SmartSearch[:#OfEntries[CWG][:StringSizeLimit]]% – Generates<br />
a report listing monitors and their current alert state. #OfEntries<br />
is the maximum number of entries. CWG is an optional<br />
specification indicating whether to include monitors in critical,<br />
warning, or good states. StringSizeLimit is the maximum<br />
number of characters to return. For example, if you wanted to<br />
return a total of fifteen items that are in a critical or warning state<br />
with a string size less than 2500 use the following:<br />
%SmartSearch:15WC:2500%.<br />
Configure Monitor Attributes Tab<br />
The Attributes tab displays the attributes applied to the current<br />
monitor, monitor group, profile, or system and lets you change the<br />
attributes that are applied. To apply attributes to more than one<br />
monitor, monitor group, profile, or system, use the Assignment tab<br />
on the Attributes page.<br />
Chapter 5: Configuring Monitors 457
Configure Monitor Attributes Tab<br />
Attributes are used in <strong>OneSight</strong> to sort the monitors, monitor<br />
groups, profiles, and systems on the status page. You can assign<br />
custom attribute values to specific monitors and use the Group by<br />
selection on the status page to show only those monitors, monitor<br />
groups, profiles, or systems assigned to a specific attribute set.<br />
All Attributes – Shows the name of all of the configured attributes<br />
and their values. Click on the plus sign to expand the tree view.<br />
Selected Attributes – Shows the list of attribute values applied to<br />
this monitor, monitor group, profile, or system. Use the Add and<br />
Remove arrow buttons to customize the list of attribute values<br />
applied to the monitor, monitor group, profile, or system.<br />
458 <strong>OneSight</strong> <strong>Administrator</strong> <strong>Guide</strong>
Configure Monitor Attributes Tab<br />
Attribute Editor – Displays the Attribute dialog box for managing<br />
attributes.<br />
Attribute Sets – The Attribute Sets list shows the names of the<br />
custom attribute sets that have been defined in <strong>OneSight</strong>. The<br />
names added to this list will appear in the Group by select list on the<br />
<strong>OneSight</strong> status page. When you group the status page by an<br />
Attribute Set, the <strong>OneSight</strong> status lists only the monitors, monitor<br />
groups, systems, and profiles that are configured with an Attribute<br />
Value from that Attribute Set.<br />
In addition to custom Attribute Set names, the following names can<br />
also appear in the Group by list on the status page:<br />
<br />
Action Plan<br />
Location<br />
Monitor Type<br />
Profile<br />
System<br />
Chapter 5: Configuring Monitors 459
Configure Monitor Attributes Tab<br />
These Attribute Sets are added automatically by <strong>OneSight</strong> when<br />
monitors are configured and are not editable in the Attributes<br />
configuration.<br />
Add – Opens a dialog box for defining a new Attribute Set name.<br />
Modify – Opens a dialog box for changing the selected attribute set.<br />
Remove– Deletes the currently selected Attribute Set from the list.<br />
A dialog box appears asking to confirm the deletion. Removing an<br />
Attribute Set also deletes the associated Attribute values. The<br />
Attribute Set name is removed from the Group by list on the status<br />
page. The attribute values are also removed from the monitor group,<br />
monitor, system, and profile configurations.<br />
Used by – Displays a list of monitor groups, monitors, profiles,<br />
systems, and saved status groupings that are using this attribute set.<br />
Attribute Value Name – Shows the list of Attribute Value names for<br />
the currently selected Attribute Set. Attribute Values can be<br />
assigned to monitor groups, monitors, systems, and profiles.<br />
Add– Opens a dialog box for defining a new Attribute Value name.<br />
Remove– Deletes the currently selected Attribute Value name from<br />
the Attribute Set. A dialog box appears asking to confirm the<br />
deletion. Removing an Attribute Value also deletes the value from<br />
the monitor group, monitor, system, and profile configurations.<br />
Used by – Displays a list of monitor groups, monitors, profiles, and<br />
systems that are using this attribute value.<br />
460 <strong>OneSight</strong> <strong>Administrator</strong> <strong>Guide</strong>
Configure Monitor Groups Tab<br />
Configure Monitor Groups Tab<br />
The monitor groups tab lets you specify which monitor group(s) the<br />
monitor is used with.<br />
Available monitor groups – Lists all monitor groups configured in<br />
<strong>OneSight</strong> with the user group to which they belong in parenthesis.<br />
Select a monitor group in this list and click >> to add the monitor<br />
group to the Selected monitor groups list. Select a monitor group in<br />
the Selected monitor groups list and click
Access Control Tab<br />
Access Control Tab<br />
The Access Control tab lets you specify which user groups can<br />
read, write, or delete this monitor.<br />
This tab has the following options:<br />
User Group – Displays the user group names.<br />
Owner – The user group for this monitor. A monitor can be directly<br />
owned by a single user group.<br />
Global Read – Gives read access to this user group and all of its sub<br />
user groups.<br />
Read – Gives read permission to the user group.<br />
Write – Gives write permission to the user group.<br />
462 <strong>OneSight</strong> <strong>Administrator</strong> <strong>Guide</strong>
Applying Downtime to a Monitor<br />
Delete – Gives delete permission to the user group.<br />
Applying Downtime to a Monitor<br />
The Down Time tab lets you apply downtime to a monitor.<br />
Available Downtimes – Lists the downtimes that are available and<br />
that have not been applied to this monitor.<br />
Selected Downtimes – Lists the downtimes that have been applied to<br />
this monitor group.<br />
–Moves the selected downtime into the Selected<br />
Downtimes list.<br />
– Moves the selected downtime into the Available<br />
Downtimes list.<br />
Downtime Editor – Displays the Downtime Editor for creating and<br />
applying downtimes. Refer to ―Chapter 9‖ for more information on<br />
the Downtime Editor.<br />
Chapter 5: Configuring Monitors 463
Modifying Monitors<br />
Modifying Monitors<br />
Dedicated Monitors<br />
Profile Monitors<br />
To modify a dedicated monitor:<br />
You can modify any monitor by clicking the Modify button on the<br />
Status Page or the Status details page.<br />
On the main Status page, click the Modify button to open the<br />
Configure Monitor Groups page.<br />
If you have opened the Status Details page by clicking a specific<br />
monitor group on the Status page, click the Modify button next to<br />
any monitor to open the Monitor Configuration dialog box.<br />
Use the options below to modify the behavior of a specific profile<br />
monitor. Your changes will apply only to the particular profile<br />
monitor that you choose to modify. If you want to make global<br />
changes to the characteristics of a profile, changes that will apply to<br />
every monitor group monitor that is based on that profile, use the<br />
Profile Editor.<br />
On the main Status page, click the Modify button to open the<br />
Configure Monitor Groups page.<br />
If you have opened the Status Details page by clicking a specific<br />
monitor group on the Status page, click the Modify button next to<br />
any monitor to open the Monitor Configuration dialog box.<br />
The Metrics list shows all of the metrics that the monitor can use to<br />
monitor your monitor group.<br />
This icon indicates that the metric is operational.<br />
464 <strong>OneSight</strong> <strong>Administrator</strong> <strong>Guide</strong>
Modifying Monitors<br />
When you select an operational metric, the System Components list<br />
identifies the names of the components that the metric is<br />
monitoring. Use the check box next to the component name to<br />
specify whether the profile metric applies or not to that system<br />
component. Clear the check box if you don’t want the profile metric<br />
to monitor this component.<br />
This icon indicates that the metric could not be applied to the<br />
system component it is meant to monitor.<br />
Click the System Editor button, then click one of the icons that<br />
indicates a component has not been adequately identified for<br />
monitoring purposes. Select the type of component that you want to<br />
monitor and add the missing information.<br />
In the Monitor Editor, you can make these types of modifications:<br />
You can specify whether an operational profile metric should<br />
apply or not to a specific system component.<br />
You can identify non-operational profile metrics and add the<br />
system component information required to make these metrics<br />
work properly.<br />
You can edit the profile used to create the monitor. Click the<br />
Profile Editor button to open the Profile Editor, where you can<br />
add or change metric definitions and configure alerts for the<br />
metrics.<br />
Note: Changes to a profile are global. The change affects all<br />
monitors that use that profile.<br />
Managing Non-operational Profile Metrics<br />
Use the procedure below to modify the behavior of a specific<br />
profile monitor. Your changes will apply only to the particular<br />
profile monitor that you choose to modify. If you want to make<br />
global changes to the characteristics of a profile, changes that will<br />
Chapter 5: Configuring Monitors 465
Modifying Monitors<br />
apply to every monitor group monitor that is based on that profile,<br />
use the Profile Editor.<br />
1. Click the Configure menu.<br />
2. Click Monitor Groups to open the Configure Monitor Groups<br />
page.<br />
3. In the Monitor Groups list, click the name of the monitor group<br />
you want to work with and click Modify. The Monitor Group<br />
Editor opens.<br />
4. In the Name column on the Monitors tab, click the monitor that<br />
you want to modify and click Modify to open the Monitor<br />
Editor.<br />
5. In the Monitor Editor, the Metrics list shows all of the metrics<br />
that the monitor can use to monitor your monitor group.<br />
This icon indicates that the metric could not be applied to the<br />
system component it is meant to monitor because you have not<br />
added this type of component to your system definition.<br />
6. To add the missing components to your system definition, click<br />
the System Editor button. The Add Missing Components dialog<br />
box lists the system components that you need to add in order to<br />
apply all the profile’s metrics successfully. For details, see Add<br />
Missing Components.<br />
Enabling/Disabling Monitoring of a System Component<br />
Use the following procedure to modify the behavior of a specific profile<br />
monitor. Your changes will apply only to the particular profile monitor<br />
that you choose to modify. If you want to make global changes to the<br />
characteristics of a profile, changes that will apply to every monitor group<br />
monitor that is based on that profile, use the Profile Editor.<br />
1. Click the Configure menu.<br />
466 <strong>OneSight</strong> <strong>Administrator</strong> <strong>Guide</strong>
Testing a Dedicated Monitor<br />
2. Click Monitor Groups to open the Configure Monitor Groups<br />
page.<br />
3. In the Monitor Groups list, click the name of the monitor group<br />
you want to work with and click Modify. The Monitor Group<br />
Editor opens.<br />
4. In the Name column, select the monitor that you want to modify<br />
and click Modify to open the Monitor Editor.<br />
5. In the Monitor Editor, the Metrics list shows all of the metrics<br />
that the profile monitor can use to monitor your monitor group.<br />
This icon indicates that the metric is operational.<br />
Select the operational metric that you want to enable or disable.<br />
6. The System Components list shows components that the metric<br />
is monitoring.<br />
Use the check box next to the component name to specify whether the<br />
profile metric should monitor that system component.<br />
For example, suppose the profile has a Disk metric for % Space Free.<br />
When you click that metric in the Metrics list, the System Components<br />
list will show each of the disks that the metric is monitoring. If you do not<br />
want to monitor one of the disks, clear the check box for that disk in the<br />
System Components list.<br />
Testing a Dedicated Monitor<br />
When you add or modify a dedicated monitor, click the Test button<br />
to confirm that the settings you have configured are appropriate.<br />
When you click the Test button, <strong>OneSight</strong> confirms the validity of<br />
the initial settings required to initiate the monitoring process. The<br />
Test button does not exercise all settings for the monitor. The<br />
results of the test are not saved in the <strong>OneSight</strong> database, and do not<br />
change the status of the monitor on the <strong>OneSight</strong> status page. The<br />
Chapter 5: Configuring Monitors 467
Testing a Dedicated Monitor<br />
following table indicates for each monitor, whether the monitor is<br />
sampled or if it is not sampled, what is tested when the Test button<br />
is clicked.<br />
Monitor Type<br />
DNS<br />
Event Log<br />
FTP<br />
Gomez GPN<br />
JMX<br />
LDAP<br />
Log File Perl Expression<br />
Log File Number of Matching<br />
Records<br />
Log File File/Directory<br />
Existence<br />
Log File File/Directory Size<br />
Log File Total Records Since<br />
Last Sample<br />
Log File time Since Last<br />
Modified<br />
Sampled or What is Tested<br />
Sampled<br />
Checks for connectivity and the<br />
ability to open the event log file.<br />
Sampled<br />
Returns the response time of the<br />
selected Gomez GPN monitor.<br />
Sampled<br />
Sampled<br />
Checks whether the file can be<br />
opened.<br />
Checks whether the file can be<br />
opened.<br />
Sampled<br />
Sampled<br />
Checks whether the file can be<br />
opened.<br />
Sampled<br />
468 <strong>OneSight</strong> <strong>Administrator</strong> <strong>Guide</strong>
Testing a Dedicated Monitor<br />
Log File Directory<br />
Log File TCP<br />
Mail<br />
<strong>OneSight</strong> Compound Metric<br />
<strong>OneSight</strong> Probe<br />
<strong>OneSight</strong> Virtual Agent<br />
<strong>OneSight</strong> Voice Quality<br />
<strong>OneSight</strong> Voice Transaction<br />
Profile<br />
<strong>OneSight</strong> Voice Watch<br />
Perfmon<br />
Ping<br />
Port<br />
Process<br />
Service<br />
Checks whether the directory<br />
can be opened.<br />
Checks connectivity.<br />
Sampled<br />
Sampled<br />
Sampled<br />
Sampled<br />
Sampled. Note that system<br />
monitor debug output is only<br />
displayed for G5 systems. It is<br />
not displayed for FX/TDM<br />
systems.<br />
Checks the availability of the<br />
URL.<br />
Checks the availability of the<br />
URL.<br />
Sampled<br />
Sampled<br />
Sampled<br />
Sampled<br />
Sampled<br />
Chapter 5: Configuring Monitors 469
Testing a Dedicated Monitor<br />
SNMP<br />
SNMP Trap<br />
URL<br />
WMI<br />
Sampled<br />
Checks connectivity to the port.<br />
Sampled<br />
Sampled<br />
The status window provides a series of messages on the success or<br />
failure of each of the steps required to test the monitor. If the test<br />
does not complete, you can click Cancel to stop the test.<br />
For example, when you click Test for an FTP monitor, information<br />
similar to the following is displayed when the test is successful:<br />
Test Starting<br />
12:38:33 PDT Trying to connect to on port<br />
21<br />
12:38:33 PDT Connected. Logging in as <br />
12:38:33 PDT Logged in. Receiving file <br />
12:38:33 PDT Successfully received file from<br />
FTP server <br />
12:38:33 PDT Test complete<br />
Test complete<br />
When you click Test for an FTP monitor, information similar to the<br />
following is displayed when the test is unsuccessful because the file<br />
was not found:<br />
Test Starting<br />
12:38:33 PDT Trying to connect to on port<br />
21<br />
12:38:33 PDT Connected. Logging in as <br />
12:38:33 PDT Logged in. Receiving file <br />
12:38:33 PDT Error. 550 : The system cannot<br />
find the file specified.<br />
12:38:33 PDT Test complete<br />
Test complete<br />
470 <strong>OneSight</strong> <strong>Administrator</strong> <strong>Guide</strong>
Enabling/Disabling a Monitor<br />
To test a dedicated monitor:<br />
1. Open the Monitor Group Editor.<br />
2. Click the Monitors tab.<br />
3. In the Monitors list, select the monitor that you want test and<br />
click Modify.<br />
4. In the Monitor Editor, click the General tab.<br />
5. To verify that the monitor will work as configured, click the<br />
Test button. The Monitor Test window provides information<br />
about the success or failure of the test and indicates what may<br />
be causing any problem.<br />
6. If the test fails, make changes to the monitor configuration<br />
based on the information in the Monitor Test window.<br />
Enabling/Disabling a Monitor<br />
To enable or disable a monitor:<br />
1. Open the Monitor Group Editor.<br />
2. Click the Monitors tab.<br />
3. In the Monitors list, the check box that appears next to each<br />
monitor’s name determines whether or not that monitor is<br />
enabled.<br />
To disable a monitor, clear the check box adjacent to that<br />
monitor’s name.<br />
To re-enable a monitor, select the check box adjacent to that<br />
monitor’s name.<br />
Chapter 5: Configuring Monitors 471
Removing a Monitor<br />
Removing a Monitor<br />
To remove a monitor:<br />
1. Open the Monitor Group Editor.<br />
2. On the Monitors tab, click the name of the monitor that you<br />
want to remove.<br />
3. Click the Remove button.<br />
Note: In the Monitors list, the check box that appears next to<br />
each monitor’s name determines whether or not that monitor is<br />
enabled. You can temporarily disable an existing monitor by<br />
clearing the check box adjacent to the monitor’s name.<br />
Modifying Alerts for Multiple Monitors<br />
You can add, change, and delete alerts for multiple monitors using<br />
the Bulk Modification option. These options apply to thresholdbased<br />
alerts and dedicated monitors only. You can add an alert to a<br />
maximum of 100 monitors at one time. You can modify or delete a<br />
maximum of 2000 alerts at one time.<br />
Adding Alerts to Multiple Monitors<br />
To add alerts to multiple monitors:<br />
1. Click the Configure page.<br />
2. Select Monitors.<br />
3. Select Bulk Modification.<br />
472 <strong>OneSight</strong> <strong>Administrator</strong> <strong>Guide</strong>
Modifying Alerts for Multiple Monitors<br />
4. Select Alert Bulk Modification from the Available Options field.<br />
The Bulk Modification – Add Alerts dialog box lets you add a<br />
threshold-based alert to a maximum of 100 selected monitors.<br />
Specify the alert in the top half of the screen, then select the<br />
monitors to add the alert to in the bottom half of the screen.<br />
Click Show to display a list of all monitors or use the Show<br />
monitors where field to filter the list of monitors.<br />
When you click the Save Changes button the alert is added to<br />
the selected monitors. If an alert with the same name already<br />
exists, an error message is displayed and the alert is not saved.<br />
The top half of the screen displays the fields and options that<br />
apply to threshold-based alerts. These fields are described in<br />
detail in the “The Alert Editor” section of this chapter.<br />
Show monitors where contains – Select the<br />
type of filter and enter any specific text, if necessary. For<br />
Chapter 5: Configuring Monitors 473
Modifying Alerts for Multiple Monitors<br />
example, you can search for all monitors with Ping in the name.<br />
In addition to plain text, you can enter a PERL expression in the<br />
contains field.<br />
Show – Displays the list of monitors based on the filtering<br />
selections. All monitors are listed if no filter has been specified.<br />
Note: Only the monitors explicitly owned by your user group<br />
are listed. To change monitors in a sub group of your user<br />
group you must activate the sub group by selecting it from the<br />
user group drop down list at the top of the screen.<br />
Check All – Checks all monitors in the list.<br />
Uncheck All – Unchecks all monitors in the list.<br />
Apply Changes – Saves the changes. This may take several<br />
minutes.<br />
Check box – Indicates which monitors are selected. Selected<br />
monitors will have the changes applied to them.<br />
Monitor Name – Displays the monitor name. Click in the column<br />
header to sort the list. An arrow is displayed showing the<br />
direction of the sort, ascending or descending.<br />
Threshold Alerts – Displays the threshold alerts for the monitor.<br />
Threshold Unit – Displays the threshold unit of measure.<br />
5. Configure the alert that you want to add. Refer to “The Alert<br />
Editor” section of this chapter for more information on<br />
configuring threshold-based alerts.<br />
6. Display the list of monitors that you want to choose from by<br />
entering filtering criteria in the Show monitors where field and<br />
then clicking Show. Clicking Show without entering filtering<br />
criteria displays all monitors. You can sort the list by clicking<br />
on a column header.<br />
474 <strong>OneSight</strong> <strong>Administrator</strong> <strong>Guide</strong>
Modifying Alerts for Multiple Monitors<br />
7. Select the monitors to which you want to add the alert by<br />
clicking in the check box. You can add an alert to a maximum<br />
of 100 monitors.<br />
8. Click Apply Changes to apply the changes to the selected<br />
monitors. This may take several minutes. If the alert has the<br />
same name as an existing alert an error message is displayed<br />
and the alert is not saved.<br />
9. Click Close.<br />
Changing Alert Thresholds for Multiple Alerts<br />
To change multiple alerts for multiple monitors:<br />
1. Click the Configure page.<br />
2. Select Monitors.<br />
3. Select Bulk Modification.<br />
4. Select Alert Bulk Modification from the Available Options field.<br />
Chapter 5: Configuring Monitors 475
Modifying Alerts for Multiple Monitors<br />
5. Click the Change Alerts tab.<br />
The Bulk Modification – Change Alerts dialog box lets you<br />
modify the threshold value of a maximum of 2000 alerts. This<br />
dialog box has the following options:<br />
New Threshold – This fields is displayed for all alert types<br />
except Threshold Range. Enter the new threshold to apply to<br />
the selected alerts.<br />
Upper Limit – This field is displayed when the alert type is<br />
Threshold Range. Enter the upper limit for the alert.<br />
Lower Limit – This field is displayed when the alert type is<br />
Threshold Range. Enter the lower limit for the alert.<br />
Show monitors where contains – Select the<br />
type of filter and enter any specific text, if necessary. For<br />
example, you can search for all monitors with Ping in the name.<br />
476 <strong>OneSight</strong> <strong>Administrator</strong> <strong>Guide</strong>
Modifying Alerts for Multiple Monitors<br />
In addition to plain text, you can enter a PERL expression in the<br />
contains field.<br />
and alert type is – Select the type of alerts that you want to<br />
display. Select Any to display all types of alerts that meet the<br />
rest of the filtering criteria.<br />
and threshold is – Enter the current threshold of the alerts that<br />
you want to change. This field is displayed for all alert types<br />
except Threshold Range alerts.<br />
Upper Limit – Enter the upper limit of the alerts that you want to<br />
change. This field is displayed for the Threshold Range alert<br />
type.<br />
Lower Limit – Enter the lower limit of the alerts that you want to<br />
change. This field is displayed for the Threshold Range alert<br />
type.<br />
and state is – Select the state of the alerts that you want to<br />
change.<br />
and unit is – Select the unit of the threshold.<br />
Show – Displays the list of monitors based on the filtering<br />
selections. All monitors are listed if no filter has been specified.<br />
Note: Only the monitors explicitly owned by your user group<br />
are listed. To change monitors in a sub group of your user<br />
group you must activate the sub group by selecting it from the<br />
user group drop down list at the top of the screen.<br />
Check All – Checks all monitors in the list that do not have a<br />
disabled check box.<br />
Uncheck All – Unchecks all monitors in the list.<br />
Save Changes – Saves the changes. This may take several<br />
minutes.<br />
Chapter 5: Configuring Monitors 477
Modifying Alerts for Multiple Monitors<br />
Check box – Indicates which alerts are selected and which are<br />
available for selection. If you have selected Any in the and alert<br />
type is field, threshold range alerts will not be available for<br />
selection. They will be grayed out. You must select Threshold<br />
Range from the and alert type is field to change these alerts.<br />
Selected alerts will have the changes applied to them. You can<br />
select a maximum of 2000 alerts.<br />
Monitor Name – Displays the monitor name. Click in the column<br />
header to sort the list. An arrow is displayed showing the<br />
direction of the sort, ascending or descending.<br />
Alert Name – Displays the alert name.<br />
Threshold – Displays the current value of the threshold.<br />
Unit – Displays the threshold unit of measure.<br />
6. Display the list of alerts from which you want to choose using<br />
the filtering criteria and clicking Show. Clicking Show without<br />
entering filtering criteria displays all alerts. You can sort the list<br />
by clicking on a column header.<br />
To change threshold range alerts you must select Threshold<br />
Range from the and alert type is field. Threshold Range alerts<br />
are not available for selection when you chose Any from the and<br />
alert type is field.<br />
7. Select the alerts you want to change by clicking in the check<br />
box. You can change a maximum of 2000 alerts.<br />
8. Click Apply Changes to apply the changes to the selected alerts.<br />
This may take several minutes.<br />
9. Click Close.<br />
478 <strong>OneSight</strong> <strong>Administrator</strong> <strong>Guide</strong>
Modifying Alerts for Multiple Monitors<br />
Deleting Alerts From Multiple Monitors<br />
To delete alerts from multiple monitors:<br />
1. Click the Configure page.<br />
2. Select Monitors.<br />
3. Select Bulk Modification.<br />
4. Select Alert Bulk Modification from the Available Options field.<br />
5. Click the Remove Alerts tab.<br />
The Bulk Modification – Remove Alerts dialog box lets you<br />
remove a maximum of 2000 alerts. This dialog box has the<br />
following options:<br />
Chapter 5: Configuring Monitors 479
Modifying Alerts for Multiple Monitors<br />
Show monitors where contains – Select the<br />
type of filter and enter any specific text, if necessary. For<br />
example, you can search for all monitors with Ping in the name.<br />
In addition to plain text, you can enter a PERL expression in the<br />
contains field.<br />
and alert type is – Select the type of alerts that you want to<br />
display. Select Any to display all types of alerts that meet the<br />
rest of the filtering criteria.<br />
and threshold is – Enter the current threshold of the alerts that<br />
you want to change. This field is displayed for all alert types<br />
except Threshold Range alerts.<br />
Upper Limit – Enter the upper limit of the alerts that you want to<br />
change. This field is displayed for the Threshold Range alert<br />
type.<br />
Lower Limit – Enter the lower limit of the alerts that you want to<br />
change. This field is displayed for the Threshold Range alert<br />
type.<br />
and state is – Select the state of the alerts that you want to<br />
change.<br />
and unit is – Select the unit of the threshold.<br />
Show – Displays the list of monitors based on the filtering<br />
selections. All monitors are listed if no filter has been specified.<br />
Note: Only the monitors explicitly owned by your user group<br />
are listed. To change monitors in a sub group of your user<br />
group you must activate the sub group by selecting it from the<br />
user group drop down list at the top of the screen.<br />
Check All – Checks all monitors in the list.<br />
Uncheck All – Unchecks all monitors in the list.<br />
Save Changes – Saves the changes. This may take several<br />
minutes.<br />
480 <strong>OneSight</strong> <strong>Administrator</strong> <strong>Guide</strong>
Modifying the Location of Multiple Monitors<br />
Check box – Indicates which alerts are selected. Selected alerts<br />
will be removed. You can select a maximum of 2000 alerts.<br />
Monitor Name – Displays the monitor name. Click in the column<br />
header to sort the list. An arrow is displayed showing the<br />
direction of the sort, ascending or descending.<br />
Alert Name – Displays the alert name.<br />
Threshold – Displays the current value of the threshold.<br />
Unit – Displays the threshold unit of measure.<br />
6. Display the list of alerts from which you want to choose using<br />
the filtering criteria and clicking Show. Clicking Show without<br />
entering filtering criteria displays all alerts. You can sort the list<br />
by clicking on a column header.<br />
7. Select the alerts you want to change by clicking in the check<br />
box. You can delete a maximum of 2000 alerts.<br />
8. Click Apply Changes to delete the selected alerts. This may take<br />
several minutes.<br />
9. Click Close.<br />
Modifying the Location of Multiple Monitors<br />
You can add, change, and delete locations for multiple monitors<br />
using the Bulk Modification option. You can modify a maximum of<br />
100 monitors or 2000 metrics at one time.<br />
To modify locations for multiple monitors:<br />
1. Click the Configure page.<br />
2. Select Monitors.<br />
3. Select Bulk Modification.<br />
Chapter 5: Configuring Monitors 481
Modifying the Location of Multiple Monitors<br />
4. Select Location Bulk Modification from the Available Options<br />
field.<br />
The Bulk Location Modification dialog box has three tabs that<br />
have the same fields:<br />
Add Locations – Adds additional locations to the selected<br />
monitors. Adding a location increases the number of metrics<br />
associated with the monitor by the number of metrics<br />
collected by the monitor at any one location. For example,<br />
adding a second location to a monitor doubles the number of<br />
metrics associated with the monitor.<br />
Change Locations – Replaces the existing locations with the<br />
selected locations for the selected monitors.<br />
Remove Locations – Removes the selected locations from the<br />
selected monitors unless the removal will result in no<br />
locations being assigned to the monitor.<br />
482 <strong>OneSight</strong> <strong>Administrator</strong> <strong>Guide</strong>
Modifying the Location of Multiple Monitors<br />
Examples<br />
Assuming Monitor1 is assigned to Boston and New York<br />
Operation<br />
Selected Locations<br />
Existing Locations<br />
after Save Changes<br />
Add Detroit Boston, New York,<br />
and Detroit<br />
Change Detroit Detroit<br />
Delete Boston New York<br />
Available Locations – Lists the available locations. Select the<br />
locations that you want to add, change to, or remove from the<br />
selected monitors. Use the right arrow button to move them into<br />
the Selected Locations field.<br />
Selected Locations – Lists the locations that have been selected.<br />
Use the left arrow button to remove them from this list.<br />
– Moves selections either into or out of the<br />
Selected Locations field.<br />
Show monitors where contains – Select the<br />
type of filter and enter any specific text, if necessary. For<br />
example, you can search for all monitors with Ping in the name.<br />
In addition to plain text, you can enter a PERL expression in the<br />
contains field.<br />
Note: Only the monitors explicitly owned by your user group<br />
are listed. To change monitors in a sub group of your user<br />
group you must activate the sub group by selecting it from the<br />
user group drop down list at the top of the screen.<br />
Show – Displays the list of monitors based on the filtering<br />
selections. All monitors are listed if no filter has been specified.<br />
On the Remove Locations tab, monitors not using the selected<br />
Chapter 5: Configuring Monitors 483
Modifying the Location of Multiple Monitors<br />
location(s) have a disabled checkbox since the location cannot<br />
be removed from a monitor that is not using the location.<br />
Check All – Checks all monitors in the list that do not have a<br />
disabled check box..<br />
Uncheck All – Unchecks all monitors in the list.<br />
Save Changes – Saves the changes. This may take several<br />
minutes.<br />
Check box – Indicates which monitors are available for<br />
selection and which monitors are selected. Selected monitors<br />
will have the changes applied to them. The monitors that are<br />
available for selection are determined by which tab you are in:<br />
Add Locations – Monitors that already use all of the selected<br />
locations will have a disabled check box. Monitors that do<br />
not support using more than one location will have a disabled<br />
check box.<br />
Change Locations – Monitors that already use all of the<br />
selected locations will have a disabled check box. Monitors<br />
that do not support using more than one location will have a<br />
disabled check box if more than one location has been<br />
selected in the Selected Locations field.<br />
Remove Locations – Monitors not using the selected<br />
location(s) will have a disabled check box. In addition,<br />
monitors that will result in zero locations after the removal,<br />
that is, the only location assigned to the monitor is the<br />
selected location, will have a disabled check box.<br />
Note: Monitors that do not allow a location to be selected<br />
when the monitor is created will have a disabled check box.<br />
Monitor Name – Displays the monitor name. Click in the column<br />
header to sort the list. An arrow is displayed showing the<br />
direction of the sort, ascending or descending.<br />
484 <strong>OneSight</strong> <strong>Administrator</strong> <strong>Guide</strong>
Modifying the Location of Multiple Monitors<br />
Existing Locations – Displays the locations that are currently<br />
used by the monitor. Click in the column header to sort the list.<br />
An arrow is displayed showing the direction of the sort,<br />
ascending or descending.<br />
5. Select the tab that corresponds to the action you want to<br />
perform:<br />
Add Locations – Adds additional locations to the selected<br />
monitors. Adding a location increases the number of metrics<br />
associated with the monitor by the number of metrics<br />
collected by the monitor at any one location. For example,<br />
adding a second location to a monitor doubles the number of<br />
metrics associated with the monitor.<br />
Change Locations – Replaces the existing locations with the<br />
selected locations for the selected monitors.<br />
Remove Locations – Removes the selected locations from the<br />
selected monitors unless the removal will result in no<br />
locations being assigned to the monitor.<br />
6. Select the locations that you want to add, change to, or remove<br />
by selecting them in the Available Locations list and clicking the<br />
right arrow button to move them to the Selected Locations list.<br />
7. Display the list of monitors that you want to choose from by<br />
entering filtering criteria in the Show monitors where field and<br />
then clicking Show. Clicking Show without entering filtering<br />
criteria displays all monitors. You can sort the list by clicking<br />
on a column header.<br />
8. Select the monitors to which you want to apply changes by<br />
clicking in the check box. The monitors that are available for<br />
selection are determined by which tab you are in.<br />
Add Locations – Monitors that already use all of the selected<br />
locations will have a disabled check box. Monitors that do<br />
Chapter 5: Configuring Monitors 485
Adding Multiple Dedicated Monitors<br />
not support using more than one location will have a disabled<br />
check box.<br />
Change Locations – Monitors that already use all of the<br />
selected locations will have a disabled check box. Monitors<br />
that do not support using more than one location will have a<br />
disabled check box if more than one location has been<br />
selected in the Selected Locations field.<br />
Remove Locations – Monitors not using the selected<br />
location(s) will have a disabled check box. In addition,<br />
monitors that will result in zero locations after the removal,<br />
that is, the only location assigned to the monitor is the<br />
selected location, will have a disabled check box.<br />
Note: Monitors that do not allow a location to be selected<br />
when the monitor is created will have a disabled check box.<br />
Note: You can modify a maximum of 100 monitors or 2000<br />
metrics at one time.<br />
9. Click Save Changes to apply the changes to the monitors. This<br />
may take several minutes.<br />
10. Click Close.<br />
Adding Multiple Dedicated Monitors<br />
You can add several dedicated monitors with a similar<br />
configuration in a single operation. This is done by placing the<br />
%filename% variable in the host field. This variable points to an<br />
XML file that is located in the imports directory.<br />
This file will contain one or more host values, and any<br />
individualized property settings for a specific monitor instance.<br />
Alert properties cannot be overridden.<br />
486 <strong>OneSight</strong> <strong>Administrator</strong> <strong>Guide</strong>
Globally Changing Proxy Settings<br />
When you accept the configuration, a monitor is added for each<br />
host in the file, using the settings specified in <strong>OneSight</strong>, unless<br />
individual properties are specified in the file. If a monitor by the<br />
same name already exists, it will be overwritten. In this way, group<br />
modifications can be made. For example, you could modify the<br />
sample rate for a group of monitors.<br />
A sample file, monitors.xml, is provided in the imports directory.<br />
The format of the variable is %filename%, where filename is the<br />
name of the XML file in the imports directory. Because this<br />
implementation is a form of variable substitution, the actual host<br />
value in the XML file can be the entire value for the Host field or it<br />
can be a substring within the field. For example,<br />
http://www.%filename%.com?myarg=val.<br />
To add multiple monitors:<br />
1. Setup the monitors file in the imports directory using the<br />
monitors.xml file as a template.<br />
2. On the Monitors Page, click Add New to open the Add Monitor<br />
dialog box.<br />
3. Select the type of monitor you are adding.<br />
4. Make any necessary configuration changes on the tabs.<br />
5. Enter %filename% in the Host field.<br />
6. Click OK.<br />
Globally Changing Proxy Settings<br />
You can change the proxy server settings for all monitors of the<br />
same type at the same time rather than changing each monitor<br />
individually. To change proxy server settings for all monitors of the<br />
same type:<br />
Chapter 5: Configuring Monitors 487
Globally Changing Proxy Settings<br />
1. Click the Configure menu.<br />
2. Select Proxy.<br />
Monitor Type – Select the type of monitor for which you want to<br />
change proxy settings. Proxy settings for all monitors of this<br />
type will be changed.<br />
Use a proxy server – Select this check box and enter changes.<br />
Proxy Server – The IP address of the proxy server.<br />
Proxy Port – The port of the proxy server.<br />
Proxy User – The username for the proxy server.<br />
Proxy Password – The password for the proxy server.<br />
Confirm Password – Re-enter the password for the proxy server.<br />
3. Select the Use a proxy server check box.<br />
4. Enter the new settings.<br />
5. Click OK.<br />
488 <strong>OneSight</strong> <strong>Administrator</strong> <strong>Guide</strong>
C h a p t e r 6<br />
Using Profiles<br />
A profile provides a set of performance criteria, in the form of<br />
metrics, to help you monitor the behavior of a particular type of<br />
back-end web component. You create a profile monitor by applying<br />
a profile to a specific machine. You can also create dedicated<br />
monitors for specific web components. Profiles differ from<br />
dedicated monitors in these ways:<br />
You can apply a profile to more than one web component of the<br />
same type. For example, you can apply the Windows profile to<br />
one PC running Windows 2000 or Windows 2003 or to multiple<br />
PCs running Windows 2000 or Windows 2003.<br />
Applying a profile to a web component requires specification of<br />
system information for each machine. As you create a profile<br />
monitor, you will need to identify the systems and describe their<br />
properties. See Adding Profiles for details.<br />
The Add Monitor dialog box is where you apply profiles to web<br />
components to create profile monitors. The Profile Manager is<br />
where you control which profiles are available to be applied.<br />
Default Profiles<br />
<strong>OneSight</strong> provides default profiles, listed in the Profiles list in the<br />
Profile Manager, that have been optimized to monitor web servers,<br />
database applications, operating systems, application servers, mail<br />
servers and other SNMP-enabled devices (see What <strong>OneSight</strong><br />
Monitors in Chapter 1 for the full list of supported components):<br />
489
The Profile Manager<br />
Web Servers<br />
Apache Web Server, version 1.3x on UNIX machines<br />
HTTP server (generic)<br />
Microsoft IIS, version 4.0 and 5.0 on Windows machines<br />
Netscape Enterprise Server, version 3.6<br />
iPlanet 4.0 on UNIX machines<br />
(To monitor an iPlanet 4.0 web server, use the Netscape Enterprise<br />
Server profile.)<br />
Database Applications<br />
Oracle, versions 8.0, 8i, and 10g<br />
Microsoft SQL Server, versions 6.5, 7.0, 2000<br />
DB2<br />
Operating Systems<br />
Microsoft Windows NT, version 4.0 with Service Pack 4 or<br />
higher<br />
Microsoft Windows 2000<br />
Microsoft Windows Vista<br />
Sun Solaris, versions 2.6, 7.0, 8.0, and 10<br />
Linux<br />
RedHat 10<br />
AIX 5.3<br />
490 <strong>OneSight</strong> <strong>Administrator</strong> <strong>Guide</strong>
The Profile Manager<br />
HP-UX 11i<br />
Application Server<br />
Allaire ColdFusion<br />
BEA WebLogic<br />
Mail Servers<br />
Microsoft Exchange version 5.5<br />
Switches and Controllers<br />
Cisco Catalyst 4000 Service Switch<br />
Cisco Catalyst 5000 Service Switch<br />
Cisco Catalyst 6000 Service Switch<br />
F5's BIG-IP<br />
Uninterruptible Power Supplies<br />
APC Symmetra<br />
Firewalls<br />
Netscreen Firewall<br />
If you are monitoring web components running the software listed<br />
above, the default profiles should meet your needs. To monitor<br />
back-end customer service technology components for which there<br />
are no default profiles, you can create your own either from scratch<br />
or by cloning an existing profile and modifying it. See adding,<br />
cloning, or modifying a profile for more information.<br />
Chapter 6: Using Profiles 491
The Profile Manager<br />
Which Profile Should I use?<br />
In some cases, you have more than one profile option available for<br />
monitoring a web component. In particular, the RFC 1213 Network<br />
Device can provide network statistics for a wide variety of<br />
machines.<br />
For example, you can monitor a Linux machine using the Linux<br />
profile or using the RFC 1213 Network Device profile. If you want<br />
to monitor the overall health of the Linux machine, the Linux<br />
profile is more appropriate. The Linux profile has a focus on system<br />
statistics, while the RFC 1213 profile has a focus on network<br />
statistics. If you have a specific network statistic within RFC 1213<br />
that you want to use, you can also set up an SNMP dedicated<br />
monitor.<br />
If you have an Apache web server on a UNIX machine or an IIS web<br />
server on a Windows 2000 or 2003 machine, there are specific<br />
profiles for these purposes. In addition, the HTTP web server profile<br />
is a more generic web server profile that can be used on a wider<br />
variety of systems because it contains no metric for monitoring the<br />
web server’s log file.<br />
Profile Symbols<br />
In the Profiles list in the Profile Manager, you will see these<br />
symbols next to the profile names and descriptions.<br />
Profile is defined and applied to a component.<br />
Profile is defined but not applied to a component.<br />
The Profile Manager<br />
Use the Profile Manager to control which profiles are available for<br />
creating monitors.<br />
To open the Profile Manager:<br />
492 <strong>OneSight</strong> <strong>Administrator</strong> <strong>Guide</strong>
The Profile Manager<br />
1. Click the Configure menu.<br />
2. Select Profiles.<br />
Adding, Cloning, and Modifying Profiles<br />
There are up to four main steps to add, clone, or modify a profile:<br />
1. Enter the main settings of a profile.<br />
2. Add metrics to or remove metrics from a profile.<br />
3. Edit metrics (optional).<br />
4. Edit a response to an alert (optional). Refer to Chapter 8.<br />
Chapter 6: Using Profiles 493
The Profile Manager<br />
Entering a Profile’s Main Settings<br />
To enter a profile’s main settings:<br />
1. In the Profile Manager click one of the following buttons to<br />
display the Profile Editor:<br />
Add – to create a new profile from scratch.<br />
Clone – to create a new profile based on an existing one.<br />
Modify – to modify how an existing profile is configured.<br />
Main Settings<br />
Name – Type a name that identifies this profile.<br />
Description – Type a description that helps you differentiate<br />
this profile from the other profiles you are using to monitor<br />
your web components.<br />
494 <strong>OneSight</strong> <strong>Administrator</strong> <strong>Guide</strong>
The Profile Manager<br />
Metrics Tab Settings<br />
Metrics – The Metrics group box displays the metrics in the<br />
profile you are configuring. A metric provides <strong>OneSight</strong> with<br />
detailed information about a specific aspect of a monitored<br />
web component, such as how many disk reads an Oracle<br />
database performs every 10 minutes. Each profile you create<br />
can contain one or more metrics. The profiles provided by<br />
default with <strong>OneSight</strong> each have a metric called Monitor:<br />
Monitor is Operational. The purpose of this<br />
metric is to determine whether the monitored web component<br />
can be sampled.<br />
Add – Adds a metric to a profile.<br />
Remove – Removes a metric from a profile. Clicking Remove<br />
does not delete the metric altogether; it just removes it from<br />
the profile you are creating or configuring.<br />
Global Metric Manager – Displays the Global Metric Manager<br />
to reconfigure a metric or to create a new metric from<br />
scratch. Because multiple profiles can use the same metric,<br />
keep in mind that metric configuration changes are global,<br />
not unique to the profile through which you accessed the<br />
metric. For example, if you change a metric’s Sample Every<br />
value from 30 to 60 seconds, every profile containing that<br />
metric will use 60 seconds as the metric’s new sampling<br />
interval.<br />
Alerts Tab Settings – The Alerts group box appears when you<br />
highlight a metric in the Metrics list. An alert draws your<br />
attention to monitored web component performance, such as an<br />
overloaded disk drive, that you want to know about. In response<br />
to an alert, <strong>OneSight</strong> can trigger an action plan, change a<br />
monitor’s health, or, in some cases, do both. Use the Alert<br />
Editor, which appears when you highlight a metric and click<br />
either Add or Modify, to link an alert to a response. Each metric<br />
in the Metrics group box can be linked to one or more alerts.<br />
Chapter 6: Using Profiles 495
The Profile Manager<br />
Add – Click this button to link a metric alert to a <strong>OneSight</strong><br />
response using the Alert Editor.<br />
Clone – Duplicates the selected alert.<br />
Modify – Click this button to change how a metric alert is<br />
configured using the Alert Editor.<br />
Remove – Click this button to remove a metric alert.<br />
SmartLink Tab Settings<br />
URL – Enter the URL that you want to associate with this<br />
monitor or metric. The URL can include specific substitution<br />
variables.<br />
New Browser – Select this option to open a new browser<br />
window when the link is clicked in the Status Details page.<br />
Rollover Menu Text – Enter the text that you want to display<br />
when the mouse is rolled over the link on the Status Details<br />
page.<br />
Notes for this metric – Enter details about this metric in text<br />
or using HTML that can be found between the tags.<br />
These notes can be viewed by clicking on View notes for this<br />
metric on the popup menu on the Status Details page.<br />
Update – saves or updates the notes for this metric.<br />
Attributes Tab Settings – Attributes are used in <strong>OneSight</strong> to sort<br />
the monitors, monitor groups, profiles, and systems on the<br />
status page. You can assign custom attribute values to specific<br />
monitors and use the Group by selection on the status page to<br />
show only those monitors, monitor groups, profiles, or systems<br />
assigned to a specific attribute set.<br />
To apply attributes to more than one profile at a time, use the<br />
Assignment tab on the Attributes page.<br />
496 <strong>OneSight</strong> <strong>Administrator</strong> <strong>Guide</strong>
The Profile Manager<br />
All Attributes – Lists all configured Attributes and their<br />
associated values in a tree view.<br />
Selected Attributes – Shows the list of attribute values applied<br />
to this monitor, monitor group, profile, or system. Use the<br />
right and left arrows to customize the list of attribute values<br />
applied to the monitor, monitor group, profile, or system.<br />
Right Arrows – Adds the selected attribute value to the<br />
monitor, monitor group, profile, or system.<br />
Left Arrows – Removes the selected attribute value from the<br />
current monitor, monitor group, profile, or system. The<br />
attribute value is no longer applied to the current monitor,<br />
monitor group, profile, or system, but remains in the<br />
attributes configuration.<br />
Access Control Tab Settings<br />
User Group – Displays the user group names.<br />
Owner – The user group for this profile. A profile can be<br />
directly owned by a single user group.<br />
Global Read – Gives read access to this user group and all of<br />
its sub user groups.<br />
Read – Gives read permission to the user group.<br />
Write – Gives write permission to the user group.<br />
Delete – Gives delete permission to the user group.<br />
2. Type or edit the profile’s Name and Description.<br />
Chapter 6: Using Profiles 497
The Profile Manager<br />
Adding/Removing Metrics From a Profile<br />
To add metrics to or remove metrics from a profile:<br />
1. If you are:<br />
Adding a profile – the profile you are adding contains no<br />
metrics. In the Profile Editor, click the Add button below the<br />
empty Metrics list, then follow the steps below.<br />
Cloning or modifying a profile – the Metrics list in the Profile<br />
Editor displays the profile’s metrics. To remove a metric<br />
from the profile, highlight the metric and click Remove. To<br />
add a metric, click Add, then follow the steps below.<br />
Use the Add Metrics dialog box to add metrics to or remove<br />
metrics from a profile. A metric provides detailed information<br />
about a specific aspect of a monitored web component. Each<br />
profile can contain one or more metrics.<br />
The Add Metrics dialog box has the following options:<br />
498 <strong>OneSight</strong> <strong>Administrator</strong> <strong>Guide</strong>
The Profile Manager<br />
Available Metrics – These are the metrics you can choose from<br />
as you create or modify a profile.<br />
Selected Metrics – These are the metrics in the profile you are<br />
creating or modifying. If you are creating a new profile, this list<br />
will be empty.<br />
Global Metric Manager – Click this button to use the Global<br />
Metric Manager to reconfigure a metric in the Available<br />
Metrics list or to create a new metric. Because multiple profiles<br />
can use the same metric, it is important to keep in mind that<br />
metric configuration changes are global. For example, if you<br />
change a metric’s Sampling Interval from 30 to 60 seconds,<br />
every profile containing that metric will use 60 seconds as the<br />
metric’s new sampling interval.<br />
– Click this button to add a metric from the<br />
Available Metrics list to the Selected Metrics list. Clicking Add<br />
does not remove metrics from the Available Metrics list.<br />
– Click this button to remove a metric from the<br />
Selected Metrics list. Clicking Remove will not delete the<br />
metric all together, just from the profile you are creating or<br />
modifying.<br />
2. Add a metric to your profile by highlighting a metric under<br />
Available Metrics and clicking the right arrow button (>>). The<br />
metric’s name appears in the Selected Metrics list. To remove a<br />
metric from the profile, highlight the metric name under<br />
Selected Metrics and click the left arrow button (
The Profile Manager<br />
Removing Profiles<br />
return to the Profile Editor. The metrics you selected appear in<br />
the Metrics list.<br />
4. To exit the Profile Editor, click OK. The profile you created is<br />
added to the Profiles list in the Profile Manager.<br />
Note: If you have metrics that are getting floating values outside<br />
the range of 10 3 to 10 7 , such as phone numbers, reporting may<br />
not be accurate.<br />
1. Select a profile in the Profile Manager.<br />
2. Click Remove.<br />
Importing Profiles<br />
3. A warning dialog box opens, confirming that you want to<br />
remove the profile. Click OK.<br />
The profile is removed from the Profile Manager, but not deleted<br />
altogether. To recover the profile, click Import, highlight the profile’s<br />
name in the Import Profiles dialog box, and click Import. If you are<br />
trying to recover a profile that you created, it can only be recovered if it<br />
was exported.<br />
Use the Import Profile dialog box to import profiles from the<br />
<strong>OneSight</strong> server’s Imports folder (\Empirix\<strong>OneSight</strong>\Imports) to<br />
the Profiles list in the Profile Manager.<br />
500 <strong>OneSight</strong> <strong>Administrator</strong> <strong>Guide</strong>
The Profile Manager<br />
1. In the Profile Manager, click Import. The Import Profile dialog<br />
box opens.<br />
Chapter 6: Using Profiles 501
The Profile Manager<br />
2. Under Available Files, the profiles in the <strong>OneSight</strong> server’s<br />
Imports folder (the default location is<br />
\Empirix\<strong>OneSight</strong>\imports) are listed. To import a profile,<br />
highlight it and click Import. The Confirm dialog box may be<br />
displayed. Following is a sample message:<br />
Use this dialog box to confirm that you want to perform the<br />
action you specified.<br />
Importing Metrics and Profiles<br />
If you are importing a profile and the metrics included in that<br />
profile, this dialog box appears when existing settings will be<br />
overwritten by the import request.<br />
Importing a metric<br />
<strong>OneSight</strong> profiles consist of a set of metrics as well as some<br />
alert and threshold settings. When you import a profile that<br />
already exists on your server, <strong>OneSight</strong> confirms that you are<br />
502 <strong>OneSight</strong> <strong>Administrator</strong> <strong>Guide</strong>
The Profile Manager<br />
willing to replace the existing profile and the associated<br />
selected metrics.<br />
When you import a metric, the existing settings for the metric<br />
(for example, sample frequency) will be overwritten. You can<br />
change a metric’s settings in the <strong>OneSight</strong> Metric Editor.<br />
If you have not made any changes to the existing metric and<br />
profile, they may be the same as the metrics and profile you are<br />
importing. In this case, you can click OK to complete the profile<br />
import procedure.<br />
Importing a profile<br />
After being prompted about overwriting individual metrics<br />
within the existing profile, you will also be asked if you are<br />
willing to replace the existing version of the profile. Profile<br />
settings (as opposed to metric settings) include alerts and<br />
threshold settings. You can change a profile’s settings in the<br />
Profile Editor.<br />
If you have not made any changes to the existing metric and<br />
profile, they may be the same as the metrics and profile you are<br />
importing. In this case, you can click OK complete the profile<br />
import procedure.<br />
Importing a profile without importing metrics<br />
If you choose not to replace the existing metrics but you do<br />
choose to replace the profile, the imported profile will use the<br />
existing metrics but will use the imported profile’s alerts and<br />
threshold settings.<br />
3. Select the metrics that you want to import.<br />
4. Click OK.<br />
5. After the file is added to the <strong>OneSight</strong> server’s Imports folder<br />
(you may need to click Refresh to see it), it will be available for<br />
Chapter 6: Using Profiles 503
Global Metric Manager<br />
Exporting Profiles<br />
import into the Profile Manager by highlighting it and clicking<br />
Import.<br />
1. In the Profile Manager, highlight the profile you want to export<br />
to the <strong>OneSight</strong> Server’s Imports folder<br />
(\Empirix\<strong>OneSight</strong>\imports), for example, MyProfile.<br />
2. Click Export. A message box notifies you that the export is<br />
complete.<br />
The profile you highlighted in the Profile Manager is exported<br />
to the \Empirix\<strong>OneSight</strong>\imports folder and given an .imp<br />
extension. For example,<br />
\Empirix\<strong>OneSight</strong>\imports\MyProfile.imp.<br />
Note: When you export a profile using the same name as the<br />
original profile, a zero is appended to the original file name. For<br />
example if you exported a profile with the same name, the file<br />
names would be as follows:<br />
MyProfile0 – the original profile<br />
Global Metric Manager<br />
MyProfile – the exported custom profile<br />
Profiles are composed of metrics. Metrics provide <strong>OneSight</strong> with<br />
detailed information about specific aspects of monitored web<br />
components. For example, among the metrics in the Windows<br />
profile is one called Disk: % Space Free. Applying the Windows<br />
profile to a machine running Windows 2000 or to a Windows 2003<br />
machine creates a profile monitor that supplies <strong>OneSight</strong> with<br />
information about how much disk space is available on that<br />
machine, among many other types of information.<br />
504 <strong>OneSight</strong> <strong>Administrator</strong> <strong>Guide</strong>
Global Metric Manager<br />
What to remember about metrics:<br />
Metrics rely on data sources – Data sources gather information for<br />
metrics and dedicated monitors. You can review, create, or<br />
modify data source information in the Data Source Configuration<br />
tab.<br />
One metric can sample multiple instances of a component – Using<br />
the Disk: % Space Free example above, when the Disk: % Space<br />
Free metric is applied as part of the Windows profile to a<br />
Windows machine that has four logical disks, each of those<br />
logical disks will be sampled by the same Disk: % Space Free<br />
metric. The Sample for Each setting, set in the Metric Editor<br />
(General tab), controls this behavior.<br />
Metric changes are global – When you modify a metric, such as<br />
changing its Sample Every measurement from 60 to<br />
120 seconds, that modification applies to every instance of that<br />
metric, whether it is shared by another profile or sampled for<br />
each instance, as described above. If you want to avoid making a<br />
global change, try cloning the metric you are interested in (in the<br />
Global Metric Manager) and modifying it to suit your purposes.<br />
Keep it simple – If you create a metric from scratch, keep it<br />
simple. For example, do not build in special Translation Type or<br />
Scale settings on your first pass.<br />
Use the Global Metric Manager to control which metrics are<br />
available for use in profiles and how those metrics are configured.<br />
Adding/Cloning/Modifying Metrics<br />
Empirix <strong>OneSight</strong> provides predefined metrics for the web<br />
components it can monitor. If you are creating or modifying a<br />
profile, try to use those predefined metrics rather than create your<br />
own.<br />
Chapter 6: Using Profiles 505
Global Metric Manager<br />
To create or modify metrics:<br />
1. In the Profile Editor, click the Global Metric Manager button.<br />
The Global Metric Manager opens.<br />
Global Metric Manager settings – When you use the Global<br />
Metric Manager, keep in mind that multiple profiles can contain<br />
the same metric and any changes you make to a metric affect all<br />
those profiles. For example, if you delete a metric, you delete it<br />
from every profile that contains that metric. Or, if you change a<br />
metric’s Sample Every from 30 to 60 seconds (in the<br />
Metric Editor), every profile containing that metric will use 60<br />
seconds as the metric’s new sampling interval.<br />
Add – Creates a new metric using the Metric Editor.<br />
Clone – To use an existing metric as the base for creating a new<br />
one, select a metric in the Global Metrics list and click Clone.<br />
The Metric Editor opens and you can modify the cloned metric<br />
there.<br />
Modify – To modify an existing metric using the Metric Editor,<br />
select a metric in the Global Metrics list and click Modify.<br />
506 <strong>OneSight</strong> <strong>Administrator</strong> <strong>Guide</strong>
Global Metric Manager<br />
Remove – To permanently remove a metric from Empirix<br />
<strong>OneSight</strong>, select the metric and click Remove.<br />
Used By – Displays the profiles and monitors that use this<br />
metric.<br />
Name – The Name column lists the names of existing metrics.<br />
User Group – Displays the user group to which this metric<br />
belongs.<br />
Data Source – Displays the data source used by this metric.<br />
Group – The Group column lists the Group to which each metric<br />
belongs. The Group can be either general or specific. For<br />
example, if a metric measures something that is unique to<br />
Apache web servers, Web Server, Apache will be its Group. If a<br />
metric measures something that is common to all of <strong>OneSight</strong>’s<br />
supported web servers, Apache, Microsoft IIS, and Netscape<br />
Enterprise, Web Server, Any will be its Group.<br />
Type – Displays the type of metric. When applied to a system,<br />
the type determines the type of license used. Refer to Chapter<br />
2.<br />
Basic – metrics that measure basic operating system<br />
performance such as CPU, Disk, etc.<br />
Premium – metrics defined by the contact center.<br />
Advanced – metrics that are not basic or premium.<br />
Description – Displays a description of the selected metric.<br />
Chapter 6: Using Profiles 507
Global Metric Manager<br />
2. If you are:<br />
Modifying or cloning a metric – highlight the metric name in<br />
the Global Metrics list and click Modify or Clone.<br />
Creating a new metric – click Add in the Global Metric<br />
Manager.<br />
3. In the Metric Editor, type or edit the metric name in the Metric<br />
Name box.<br />
4. Do the following on the General tab. Refer to General Tab<br />
Settings for a description of this dialog box.<br />
Type or edit the metric description in the Description box.<br />
Select a setting under Sample for Each.<br />
Select Group, Report Category, and Translation Type settings.<br />
If you are creating a new metric, select a measurement from<br />
the Unit Measure list or type the unit of measure you want to<br />
use. If you are modifying or cloning an existing metric, this<br />
field will be filled in for you.<br />
508 <strong>OneSight</strong> <strong>Administrator</strong> <strong>Guide</strong>
Global Metric Manager<br />
Enter or edit the Sample Every: value. This is how<br />
often the metric will attempt to gather information from the<br />
web component.<br />
5. Refer to Data Sources Tab Settings for a description of this<br />
dialog box. On the Data Sources tab, if you are:<br />
Modifying or cloning a metric – the data source(s) listed will<br />
probably meet your needs. To change how that data source is<br />
configured, change the settings and click OK.<br />
Creating a metric – the metric you are creating will not work<br />
unless there is a data source to collect information for it.<br />
Select the data source you want to use. See Adding a Data<br />
Source for information on how to fill out these fields.<br />
Chapter 6: Using Profiles 509
Global Metric Manager<br />
6. Click the Attributes tab if you want to assign attribute values to<br />
this metric. Assigning attribute values lets you filter data by<br />
attribute on metric-based reports. Refer to Attribute Tab<br />
Settings for information on how to fill out these fields.<br />
7. Click OK to exit the Metric Editor. The metric you just<br />
modified or added appears under Global Metrics in the Global<br />
Metric Manager.<br />
8. In the Global Metric Manager, click Close.<br />
9. In the Profile Editor, if you:<br />
Modified or cloned a metric in a profile, you are now ready<br />
to Create or modify a response to an alert for that metric.<br />
Created a metric and want to add it to a profile, click the Add<br />
button. In the Add Metric dialog box, highlight the metric<br />
you created under Available Metrics and add it to the<br />
Selected Metrics list. Click OK. The metric you created is in<br />
the profile. Now you’re ready to Create or modify a response<br />
to an alert.<br />
10. Create or modify a response to an alert. Refer to Chapter 8.<br />
510 <strong>OneSight</strong> <strong>Administrator</strong> <strong>Guide</strong>
Global Metric Manager<br />
General Tab Settings<br />
Use the Metric Editor to define or modify general and data sourcespecific<br />
information about a metric. The general tab displays basic<br />
metric settings, such as the metric’s name and the type of web<br />
component it is measuring. Use the options on the General tab of<br />
the Metric Editor to define basic aspects of a metric, such as its<br />
name, description, report setting, and unit of measurement.<br />
Metric Name – Type a name for this metric. The name you enter also<br />
appears in the Name column of the Profile Editor and the Global<br />
Metric Manager.<br />
Description – Type a description for the metric. The description you<br />
enter also appears in the Description area of the Global Metric<br />
Manager.<br />
Sample for Each – Sample for Each settings correspond with the<br />
items under Components in the System Editor. Use the Sample for<br />
Each settings to make the metric sample each component of that<br />
type that it finds on the monitored web component. Take, for<br />
example, a metric that measures Queue Length that has Disk as its<br />
Sample for Each setting (Disk: Queue Length). When Disk: Queue<br />
Length is applied as part of a profile to an NT machine that has four<br />
logical disks, four instances of the Disk: Queue Length metric will<br />
be created, one metric instance for each logical disk.<br />
The Sample for Each setting called System does not replicate metrics.<br />
Use System to measure ―one of a kind‖ items on a machine.<br />
Group – Specify the group to which this metric belongs. The Group<br />
designation can be either general or specific. For example, if the<br />
metric measures something that is unique to Apache web servers,<br />
you could type Web Server, Apache as the Group setting. If the metric<br />
measures something that is common to all of <strong>OneSight</strong>’s supported<br />
web servers, Apache, Microsoft IIS, and Netscape Enterprise, you<br />
could type Web Server, Any as the Group setting.<br />
Chapter 6: Using Profiles 511
Global Metric Manager<br />
The purpose of the Group specification is to provide information<br />
about how this metric should be used. When defining profiles, you<br />
can use the group information to determine which metrics can be<br />
part of the profile.<br />
The following table lists examples of Groups used in <strong>OneSight</strong><br />
default profiles.<br />
General Group setting<br />
AppServer ColdFusion<br />
ATG Dynamo<br />
DB Server Oracle<br />
Other group settings<br />
Allaire ColdFusion Application<br />
Server (see also WebLogic for<br />
SNMP)<br />
ATG Dynamo<br />
Oracle, versions 8.0 and 8i<br />
SQL 6.5: Microsoft SQL Server<br />
version 6.5<br />
SQL 7, 2000: Microsoft SQL Server<br />
version 7 or 2000<br />
Mail Server Exchange 5.5<br />
Microsoft Transaction<br />
Server<br />
RealSystem Server<br />
(Windows)<br />
SNMP<br />
Machines running Microsoft<br />
Exchange 5.5 Mail Server software<br />
Microsoft Transaction Server<br />
RealSystem Server version 8.0<br />
CheckPoint-MIB: Hosts and devices<br />
supporting the CheckPoint MIB.<br />
Cisco-Process-MIB: Machines<br />
running Cisco Catalyst 4000 or<br />
5000.<br />
512 <strong>OneSight</strong> <strong>Administrator</strong> <strong>Guide</strong>
Global Metric Manager<br />
Cisco-Stack-MIB: Machines running<br />
Cisco Catalyst 4000 or 5000.<br />
Cisco-Switch-Engine-MIB:<br />
Machines running Cisco Catalyst<br />
4000 or 5000.<br />
CPQHOST-MIB: Hosts and devices<br />
supporting the Compaq PC Server<br />
CPQHOST MIB.<br />
CPQHLTH-MIB: Hosts and devices<br />
supporting the Compaq PC Server<br />
CPQHLTH MIB.<br />
DELLHOST-MIB: Hosts and devices<br />
supporting the Dell PC Server<br />
DELLHOST MIB.<br />
DELLHLTH-MIB: Hosts and devices<br />
supporting the Dell PC Server<br />
DELLHLTH MIB.<br />
HOST-RESOURCES-MIB: Any<br />
machine with Agents that support<br />
the Host Resources MIB, including<br />
Linux and IBM AS/400.<br />
HP-UX: Hosts and devices<br />
supporting the Hewlett-Packard<br />
Unix MIB.<br />
LOAD-BAL-SYSTEM-MIB: Hosts<br />
and devices supporting the F5 BIG-<br />
IP Load Balancer MIB.<br />
SNMP<br />
RFC1213-MIB: Hosts and devices<br />
supporting SNMP MIB-II (RFC<br />
1213), covering a wide variety of<br />
TCP/IP devices.<br />
TUBS-MIB: Hosts and devices<br />
Chapter 6: Using Profiles 513
Global Metric Manager<br />
supporting the TUBS MIB.<br />
UCD-SNMP-MIB: Hosts and devices<br />
supporting the UCD SNMP MIB,<br />
including many Linux systems.<br />
WebLogic-MIB: Machines running<br />
BEA Web Logic Application Server.<br />
System<br />
Windows NT 4.0 with Service Pack<br />
4 or higher, Windows 2000, or<br />
Solaris version 2.6, 7.0, or 8.0.<br />
Windows NT: Windows NT 4.0 with<br />
Service Pack 4 or higher or<br />
Windows 2000.<br />
Solaris: Solaris, version 2.6, 7.0, or<br />
8.0.<br />
Web Server<br />
Any: Apache Web Server, version<br />
1.3x; Microsoft IIS, version 4.0 or<br />
5.0; or Netscape Enterprise Server,<br />
version 3.6, iPlanet 4.0 on UNIX<br />
machines, HTTP server (generic).<br />
Apache: Apache Web Server,<br />
version 1.3x on UNIX machines.<br />
IIS: Microsoft IIS, version 4.0 or<br />
5.0.<br />
IPlanet: IPlanet Web Server 4.0 on<br />
UNIX machines.<br />
Netscape: Netscape Enterprise<br />
Server, version 3.6<br />
514 <strong>OneSight</strong> <strong>Administrator</strong> <strong>Guide</strong>
Global Metric Manager<br />
Report Category – Choose which type of report should incorporate<br />
the data from this metric. The Report Category<br />
setting should work for most metrics. If you are modifying a metric<br />
that is provided as part of a profile, try to use the existing Report<br />
Category setting. The following list shows the reports that each<br />
category lets you run:<br />
– The most general reports.<br />
Throughput – Reports that describe the volume of data that can be<br />
transferred per unit of time<br />
Response Time – Reports that provide response-related data, such<br />
as how quickly a remote web site responds.<br />
Monitor Is Operational – Reports that provide information on<br />
monitor availability.<br />
Translation Type – Translation Type settings control how <strong>OneSight</strong><br />
translates a metric’s data when displayed on the <strong>OneSight</strong> Alerts<br />
page and in Reports. If you are modifying a metric that is provided<br />
as part of a profile, use the existing Translation Type setting:<br />
No Translation – <strong>OneSight</strong> presents the metric’s data as it is<br />
provided by the metric’s data source.<br />
Rate (minutes) – <strong>OneSight</strong> presents the metric’s data as a delta,<br />
per minute. If the time interval between two samples was 10<br />
minutes, and 50 errors were found, the Rate (minutes) would be<br />
five (5) errors per minute.<br />
Note: Rate (minutes) translates data sources that return their values<br />
as an endlessly increasing counter. If the data source does not return<br />
data this way, use No Translation. For example, some network<br />
metrics from the UNIX System data source are returned as the<br />
number of errors since the machine was rebooted. To get the error<br />
rate per minute, use Rate (minutes).<br />
Chapter 6: Using Profiles 515
Global Metric Manager<br />
Unit Measure – Select which unit of measurement should be<br />
associated with this metric and displayed in places like the <strong>OneSight</strong><br />
Alerts page and Reports. You can also use this field to enter your own<br />
unit of measurement setting. If you are modifying a metric that is<br />
provided as part of a profile, try to use the existing Unit Measure<br />
setting:<br />
% (percent) – the metric’s data is expressed as a percentage.<br />
bytes – the metric’s data is expressed in bytes.<br />
hours – the metric’s data is expressed in hours.<br />
minutes – the metric’s data is expressed in minutes.<br />
seconds – the metric’s data is expressed in seconds.<br />
– the metric’s data is expressed with no unit of<br />
measurement.<br />
Sample Every – Specifies how often samples are taken<br />
for this metric. Select the unit of time to use for the sampling<br />
interval: seconds, minutes, or hours. You can specify sample<br />
intervals to occur regularly, hourly, or daily.<br />
To Sample Interval Value Example<br />
Regularly integer 5 minutes<br />
Hourly @ 60@15 minutes<br />
Daily @ @23:15 minutes<br />
Daily GMT 24@hh 24@01 hours<br />
To sample at regular intervals, specify a simple integer value and<br />
select the appropriate units. For example, to sample every 5<br />
minutes, enter 5 and select minutes. <strong>OneSight</strong> selects a random time<br />
516 <strong>OneSight</strong> <strong>Administrator</strong> <strong>Guide</strong>
Global Metric Manager<br />
to take the first sample that is shortly after configuration or startup,<br />
and from then on samples every 5 minutes.<br />
To sample at a specific time every hour, specify the value as<br />
@. For example, to sample every hour at<br />
quarter past the hour, enter 60@15 and select minutes as the units.<br />
The first sample is taken shortly after configuration or startup so<br />
that the status gumball will go out of waiting. Subsequent samples<br />
are then taken as specified.<br />
To sample at a specific time every day, specify the value as @. For example, to sample once a day at quarter past eleven<br />
(local time on the server machine), enter @23:15. The first sample<br />
occurs at the time specified.<br />
You can specify in seconds, minutes, or hours<br />
using the following formats:<br />
Seconds: hh:mm:ss<br />
Minutes: hh:mm<br />
Hours: hh<br />
When specifying midnight, use the format @0.<br />
For a daily interval, you can also use the format 24@hh. The<br />
interval is 24 hours and the hh specifies the number of hours after<br />
midnight Greenwich time. You must select hours as the units. The<br />
first sample is taken shortly after configuration or startup so that the<br />
status gumball will go out of waiting. Subsequent samples are taken<br />
as specified.<br />
You can also specify different sampling intervals based on the<br />
sample’s state using the following syntax: <br />
or ; or<br />
;;. Separate each state interval by a<br />
semi-colon. Each state interval must share the same unites. For<br />
example, 30;20;15 minutes samples every 30 minutes when in a<br />
good state, every 20 minutes in a warning state, and every 15<br />
Chapter 6: Using Profiles 517
Global Metric Manager<br />
minutes in a critical state. If two states are the same one can be<br />
omitted. For example, 30;;15 minutes samples every 30 minutes in<br />
good and warning states, and every 15 minutes in a critical state.<br />
The format 30;20 minutes samples every 30 minutes in a good state,<br />
and every 20 minutes in the warning and critical states. A single<br />
interval value applies to all three states.<br />
Data Sources Tab Settings<br />
Use the options on the Data Sources tab of the Metric Editor to<br />
determine which data sources gather information for a metric, how<br />
often the information is gathered, whether that information should<br />
be stored in the <strong>OneSight</strong> database, and, if so, how often it should<br />
be stored. The settings on this tab vary depending on which data<br />
source is selected.<br />
Attributes Tab Settings<br />
The Attributes tab displays the attributes applied to the current<br />
metric and lets you change the attributes that are applied. To apply<br />
attributes to more than one metric, use the Assignment tab on the<br />
Attributes page.<br />
Attributes are used in <strong>OneSight</strong> to sort the monitors, monitor<br />
groups, profiles, and systems on the status page. You can assign<br />
custom attribute values to specific monitors and use the Group by<br />
selection on the status page to show only those monitors, monitor<br />
groups, profiles, or systems assigned to a specific attribute set.<br />
Attributes are also used to filter reports that support attribute<br />
filtering.<br />
All Attributes – Shows the name of all of the configured attributes<br />
and their values. Click on the plus sign to expand the tree view.<br />
Selected Attributes – Shows the list of attribute values applied to<br />
this metric. Use the Add and Remove arrow buttons to customize the<br />
list of attribute values applied to the metric.<br />
518 <strong>OneSight</strong> <strong>Administrator</strong> <strong>Guide</strong>
Global Metric Manager<br />
Attribute Editor – Displays the Attribute dialog box for managing<br />
attributes.<br />
Attribute Sets – The Attribute Sets list shows the names of the<br />
custom attribute sets that have been defined in <strong>OneSight</strong>. The<br />
names added to this list will appear in the Group by select list on the<br />
<strong>OneSight</strong> status page. When you group the status page by an<br />
Attribute Set, the <strong>OneSight</strong> status lists only the monitors, monitor<br />
groups, systems, and profiles that are configured with an Attribute<br />
Value from that Attribute Set.<br />
In addition to custom Attribute Set names, the following names can<br />
also appear in the Group by list on the status page:<br />
<br />
Action Plan<br />
Location<br />
Monitor Type<br />
Profile<br />
System<br />
Chapter 6: Using Profiles 519
Global Metric Manager<br />
These Attribute Sets are added automatically by <strong>OneSight</strong> when<br />
monitors are configured and are not editable in the Attributes<br />
configuration.<br />
Add – Opens a dialog box for defining a new Attribute Set name.<br />
Modify – Opens a dialog box for changing the selected attribute set.<br />
Remove– Deletes the currently selected Attribute Set from the list.<br />
A dialog box appears asking to confirm the deletion. Removing an<br />
Attribute Set also deletes the associated Attribute values. The<br />
Attribute Set name is removed from the Group by list on the status<br />
page. The attribute values are also removed from the monitor group,<br />
monitor, system, and profile configurations.<br />
Used by – Displays a list of monitor groups, monitors, profiles,<br />
systems, and saved status groupings that are using this attribute set.<br />
Attribute Value Name – Shows the list of Attribute Value names for<br />
the currently selected Attribute Set. Attribute Values can be<br />
assigned to monitor groups, monitors, systems, and profiles.<br />
Add– Opens a dialog box for defining a new Attribute Value name.<br />
Remove– Deletes the currently selected Attribute Value name from<br />
the Attribute Set. A dialog box appears asking to confirm the<br />
deletion. Removing an Attribute Value also deletes the value from<br />
the monitor group, monitor, system, and profile configurations.<br />
Used by – Displays a list of monitor groups, monitors, profiles,<br />
systems , and metrics that are using this attribute value.<br />
520 <strong>OneSight</strong> <strong>Administrator</strong> <strong>Guide</strong>
Global Metric Manager<br />
Access Control Tab Settings<br />
The Access Control tab lets you specify which user groups can<br />
read, write, or delete this metric.<br />
This tab has the following options:<br />
User Group – Displays the user group names.<br />
Owner – The user group for this metric. a metric an be directly<br />
owned by a single user group.<br />
Global Read – Gives read access to this user group and all of its sub<br />
user groups.<br />
Read – Gives read permission to the user group.<br />
Write – Gives write permission to the user group.<br />
Delete – Gives delete permission to the user group.<br />
Chapter 6: Using Profiles 521
Global Metric Manager<br />
Adding a Data Source<br />
Data sources act as information gatherers for profile metrics or<br />
dedicated monitors. You can view the metrics used for <strong>OneSight</strong>’s<br />
default profiles in the Data Source Configuration dialog box. You<br />
supply additional information in the System Editor when you apply<br />
the profile.<br />
<strong>OneSight</strong> also makes use of third-party data sources that reside on<br />
the machines that <strong>OneSight</strong> is monitoring. Some <strong>OneSight</strong> data<br />
sources (SNMP and Perfmon) require that a corresponding thirdparty<br />
data source be running to operate successfully.<br />
If you are using<br />
this data source…<br />
JDBC<br />
On the monitored machine you may need to...<br />
n/a<br />
Log File<br />
NT Event Log<br />
Perfmon<br />
Ping<br />
Service<br />
SNMP<br />
Install the <strong>OneSight</strong> Data Collector or Remote<br />
Agent for NT or the <strong>OneSight</strong> Remote Agent<br />
for Solaris or Linux.<br />
n/a<br />
If the Data Collector or Remote Agent (for<br />
NT) is not installed on the monitored machine,<br />
make sure that the <strong>OneSight</strong> server can access<br />
the machine’s Perfmon data. For metrics that<br />
sample disk performance, you may also need<br />
to execute the Diskperf command.<br />
Ping is not available from UNIX machines.<br />
n/a<br />
Enable SNMP. Also, be sure that the schema<br />
(MIBs) on the monitored machine supports<br />
the data you plan to collect.<br />
522 <strong>OneSight</strong> <strong>Administrator</strong> <strong>Guide</strong>
Global Metric Manager<br />
SNMP Trap<br />
UNIX<br />
URL<br />
Enable SNMP. Make sure the <strong>OneSight</strong><br />
Service is running.<br />
System Install the <strong>OneSight</strong> Remote Agent for<br />
Solaris or Linux.<br />
n/a<br />
To add a data source to a metric:<br />
1. In the Metric Editor, click the Data Sources tab.<br />
2. Select a data source from the Available Data Sources box. The<br />
data sources listed do not represent the data sources available<br />
on the machine the metric will monitor, but rather all possible<br />
data sources that <strong>OneSight</strong> can use.<br />
Fill in the fields on the right side of the dialog box. The fields<br />
displayed are different for each data source. See the dialog box<br />
descriptions that follow.<br />
Chapter 6: Using Profiles 523
Global Metric Manager<br />
3. Click OK. The data source you added appears under Data<br />
Sources in the Metric Editor.<br />
JDBC Dialog Box<br />
Use this dialog box to add or modify a data source to a metric that<br />
relies on JDBC information being configured.<br />
Query – Enter a query appropriate for the database application this<br />
metric is monitoring.<br />
Report On – Select Query Time or Query Result as the value to be<br />
measured.<br />
Query time – Lets you run response time-related reports using this<br />
metric’s data.<br />
Good Content String – Enter the string that should be returned for<br />
the query you specified. If the string is not matched, an error is<br />
returned.<br />
524 <strong>OneSight</strong> <strong>Administrator</strong> <strong>Guide</strong>
Global Metric Manager<br />
Query result – Lets you run reports using the numeric or string<br />
result of the query.<br />
Perl Expression – Enter the numeric value that should be returned<br />
for the query you specified. If this metric returns a string that<br />
contains more than just numerical information, then a regular<br />
expression can be used in Match string to extract the numerical<br />
result that <strong>OneSight</strong> requires. For more information, see Using<br />
Regular Expressions for Pattern Matching in Chapter 5.<br />
String Mappings – Use this button to display the String Mappings<br />
dialog box for entering a string that should be returned for the<br />
query you specified.<br />
<strong>OneSight</strong> collects numeric performance data. If you are<br />
measuring a JDBC result representing a string datatype, it can be<br />
converted to a number for use in <strong>OneSight</strong> by using the String<br />
Mappings field. Specify a semicolon delimited mapping of<br />
strings to integers. For example, ―false=0;true=1‖ converts a false<br />
reading to a zero value in <strong>OneSight</strong>. String mappings can also be<br />
used to translate a number to a string for display in <strong>OneSight</strong>.<br />
Note: When the output of a database query is a result set the query<br />
retrieves all rows of the result set. It processes for good content<br />
match, perl expression match, or advanced string mapping, treating<br />
the entire result set as a whole data block. Matching is successful<br />
when there is at least one match in the whole data block. If the<br />
result needs to be returned, the first matched value is returned.<br />
Return the first column of the first row – Select this option to return<br />
the first column of the first row if there are multiple results.<br />
Loop on result items, returning the first match – Select this option to<br />
loop on each result and return the first result that matches.<br />
Concatenate result items (space delimited) – Select this option to<br />
concatenate all results and return the first result that matches.<br />
Results are space delimited.<br />
Chapter 6: Using Profiles 525
Global Metric Manager<br />
Scale – Type the multiplier you want applied to the data that is<br />
collected.<br />
Setting Scale to 1 means the data will be reported as it is. If the<br />
metric measurement is expressed in kilobytes, setting Scale to 1024<br />
will translate it to bytes. If the metric measurement is expressed in<br />
milliseconds, setting Scale to .001 will translate it to seconds.<br />
Timeout (sec) – Enter the length of time after which the query will<br />
time out.<br />
JMX Dialog Box<br />
Use this dialog box to add the JMX data source to a metric.<br />
Attribute Name – The Mbean’s attribute name.<br />
Attribute Property – The Mbean’s attribute property.<br />
Scale – Type the multiplier you want applied to the data that’s<br />
collected.<br />
526 <strong>OneSight</strong> <strong>Administrator</strong> <strong>Guide</strong>
Global Metric Manager<br />
Setting Scale to 1 means the data will be reported as it is. If the<br />
metric measurement is expressed in kilobytes, setting Scale to 1024<br />
will translate it to bytes. If the metric measurement is expressed in<br />
milliseconds, setting Scale to .001 will translate it to seconds.<br />
String Mappings – If you are measuring an object representing a<br />
string data type, it can be converted to a number for use in <strong>OneSight</strong><br />
using this field. Specify a semicolon delimited mapping of strings to<br />
integers. For example, ―false=0;true=1‖ will convert a false reading<br />
to a zero value in <strong>OneSight</strong>. String mappings can also be used to<br />
translate a number to a string for display in <strong>OneSight</strong>.<br />
Log File, Directory Dialog Box<br />
Use this dialog box to add or modify the Log File data source to a<br />
metric. The Log File data source monitors text log files produced by<br />
applications such as web servers, database servers, or application<br />
servers. For the Log File data source to function correctly, the<br />
<strong>OneSight</strong> Data Collector or Remote Agent must be installed on the<br />
monitored machine.<br />
You can monitor directory existence, size, or the number of files or<br />
folders in a directory. For metrics that apply to folders, you can<br />
select whether to return values on the directory and all<br />
subdirectories or only the topmost directory.<br />
Chapter 6: Using Profiles 527
Global Metric Manager<br />
Monitor Type – Specifies the type of monitor you want to create:<br />
Log File – Select this monitor type to monitor a log file.<br />
Directory – Select this monitor type to monitor a directory.<br />
File/Directory Name – Specifies the path to the log file or directory<br />
that you want to monitor. For example, c:\temp\mlog.txt.<br />
Metric Type – Select the type of metric. The metric types that are<br />
available depend on the type of monitor you are using:<br />
Log File Monitor<br />
Perl Expression – select this option when you want to use a Perl<br />
expression to collect numerical performance data from a log file<br />
entry.<br />
Number of Matching Records – this metric returns the number of<br />
records that match the entered Perl expression.<br />
528 <strong>OneSight</strong> <strong>Administrator</strong> <strong>Guide</strong>
Global Metric Manager<br />
File/Directory Existence – this metric returns a one when the file<br />
or directory exists, otherwise, it returns a sample failure.<br />
File/Directory Size – this metric returns the size of the file or<br />
directory.<br />
Total Records Encountered Since Last Sample – this metric<br />
returns the number of records written to the log file since the last<br />
sample.<br />
Time Since Last Modified – this metric returns the length of time<br />
since the log file was changed.<br />
Directory Monitor<br />
File/Directory Existence – this metric returns whether the file or<br />
directory exists.<br />
File/Directory Size – this metric returns the file or directory size.<br />
Number of Folders – this metric returns the number of folders in<br />
the directory.<br />
Number of Files – this metric returns the number of files in the<br />
directory.<br />
Time Since Last Modified – this metric returns the length of time<br />
since the directory was last modified.<br />
Record Type – Specifies the operating mode:<br />
Each record is one line – select this option to use one line at a<br />
time operating mode. In this mode each line read from the file is<br />
treated as a single log file entry and is processed individually.<br />
PERL expression defines record – select this option to use<br />
arbitrary record-based mode. In this mode a Perl expression is<br />
used to determine where each record in the file starts and ends.<br />
The expression is applied to the data as it is read, and records are<br />
Chapter 6: Using Profiles 529
Global Metric Manager<br />
picked out as they are found. Entries that exceed the specified<br />
maximum record size are ignored.<br />
If you select Perl expression defines record, the following<br />
additional fields are displayed:<br />
Max Record Length – Enter the maximum record length. Entries<br />
that exceed this length are ignored.<br />
Record Format (PERL) – Enter the Perl expression defining the<br />
record, including the delimiter character.<br />
Inactivity Sample Count – If the Log File data source detects that the<br />
monitored log file does not log any new information for the number<br />
of sample counts you enter here, a sample failure will result. A<br />
value of 0 (the default) disables this setting.<br />
Perl Expression – Specifies a Perl Expression used to collect<br />
numerical performance data from a log file entry. The monitor<br />
checks the last entry whenever the log file changes. This returned<br />
data can then be used within <strong>OneSight</strong>, both for alerting, using<br />
threshold alerts, and reporting.<br />
To check if the file exists, use the File/directory exists metric type<br />
and leave this field blank.<br />
String Mappings – Displays the String Mappings dialog box for<br />
specifying string mappings.<br />
String Mappings – <strong>OneSight</strong> collects numeric performance data. If<br />
you are measuring a log file response that is a string, it can be<br />
converted to a number for use in <strong>OneSight</strong> by using the String<br />
Mappings field. Simply specify a semicolon delimited mapping<br />
of Strings to Integers. For example, ―false=0;true=1‖; will<br />
convert a ―false‖ reading to a 0 value in <strong>OneSight</strong>, and this will<br />
be displayed in <strong>OneSight</strong> Status as ―false=0‖. If you only want to<br />
display the string on the <strong>OneSight</strong> status page, use a colon, rather<br />
than a semi-colon to delimit the values.<br />
530 <strong>OneSight</strong> <strong>Administrator</strong> <strong>Guide</strong>
Global Metric Manager<br />
If you neglect to provide a mapping for a specific string,<br />
<strong>OneSight</strong> will consider this a Sample Failure, and report the<br />
String that was returned. String Mappings can also be used to<br />
translate a number to a String for display in <strong>OneSight</strong> Status.<br />
This is helpful when numbers represent an objects state.<br />
Note that string matching is case-insensitive and data that has a<br />
colon cannot be used in string mapping.<br />
Sample Continuously – Select to sample continuously. This field is<br />
only available when Metric Type is Perl Expression value.<br />
File/Directory Must Exist – Select to check that the file/directory<br />
exists.<br />
Directory Range – Specify whether to monitor all directories<br />
including sub directories or to monitor only the top directory. This<br />
field applies to all metric types except File/Directory Existence<br />
monitors.<br />
Alert Collection Mode – Select how you want alerts to be processed.<br />
Report Alerts as they Occur – If multiple alerts occur on the same<br />
trigger they are all sent. Alerts with the same timestamp as a<br />
previous alert will not be sent.<br />
Report First Alert Encountered for a Trigger – The first alert that<br />
occurs during a sample run for a specific trigger is the only one<br />
sent. Subsequent alerts for the same trigger are ignored.<br />
Report Last Alert Encountered for a Trigger – The last alert that<br />
occurs during a sample run for a specific trigger is the only one<br />
sent. Previous alerts for the same trigger are ignored.<br />
Report all Alerts for a Trigger as a bundle – Send all alerts that<br />
occur for a specific trigger during the sample run as one alert<br />
message.<br />
Chapter 6: Using Profiles 531
Global Metric Manager<br />
NT Event Log Dialog Box<br />
Use this dialog box to add or modify the NT Event Log data source<br />
to a metric. The NT Event Log data source monitors events logged<br />
in the Event Viewer.<br />
Note: This data source applies to both Windows 2000 metrics and<br />
Windows 2003 metrics.<br />
Event log – Select whether the Windows event log that is being<br />
monitored is an Application, System, or Security event log. You can<br />
also specify a different type of log by typing its name here.<br />
Inactivity sample count – If the Event Log data source detects that<br />
the monitored log file does not log any new events for the number<br />
of sample counts you enter here, a sample failure will result. A<br />
value of 0 (the default) disables this setting.<br />
Alert Collection Mode – Select how you want alerts to be processed.<br />
532 <strong>OneSight</strong> <strong>Administrator</strong> <strong>Guide</strong>
Global Metric Manager<br />
Report Alerts as they Occur – If multiple alerts occur on the same<br />
trigger they are all sent. Alerts with the same timestamp as a<br />
previous alert will not be sent.<br />
Report First Alert Encountered for a Trigger – The first alert that<br />
occurs during a sample run for a specific trigger is the only one<br />
sent. Subsequent alerts for the same trigger are ignored.<br />
Report Last Alert Encountered for a Trigger – The last alert that<br />
occurs during a sample run for a specific trigger is the only one<br />
sent. Previous alerts for the same trigger are ignored.<br />
Report all Alerts for a Trigger as a bundle – Send all alerts that<br />
occur for a specific trigger during the sample run as one alert<br />
message.<br />
Metric Type – Select the type of metric.<br />
None – Checks to see if the monitor is operational.<br />
Perl Expression Value – Lets you enter a Perl Expression for<br />
parsing the results.<br />
Number of Matching Records – Returns the number of records that<br />
match the specified criteria.<br />
Number of Records in Log – Returns the total number of records<br />
in the log.<br />
Total Records Encountered Since Last Sample – Returns the<br />
number of records added since the last sample.<br />
Time Since Last Modified – Returns the time since the log was last<br />
modified.<br />
The following fields are available when you select a metric type of<br />
Perl Expression or Number of Matching Records.<br />
Chapter 6: Using Profiles 533
Global Metric Manager<br />
Perl Expression – Enter the Perl Expression to use to parse the<br />
results.<br />
Match if NT Even Source is – Filter based on NT event source.<br />
Match if NT Event ID is – Filter based on NT event ID.<br />
Match if Category is – Filter based on category.<br />
Match if Username is – Filter based on Username.<br />
NT Event Type – Select the type of NT event you want to monitor. If<br />
no type is selected, all event types are monitored.<br />
534 <strong>OneSight</strong> <strong>Administrator</strong> <strong>Guide</strong>
Global Metric Manager<br />
Perfmon Dialog Box<br />
Use the Perfmon Data Source Configuration dialog box to add or<br />
modify how the Perfmon data source is configured. As you work in<br />
this dialog box, you may find it helpful to view the Windows<br />
Performance Monitor as a reference. If you do use Windows<br />
Performance Monitor to obtain object and counter names, enter the<br />
names exactly as they appear in Windows Performance Monitor<br />
(use the same spacing, capitalization, and the like).<br />
Object – Enter an object, for example: LogicalDisk. In the Windows<br />
operating system, an object is a standard mechanism for identifying<br />
a system resource.<br />
Counter – Enter a counter, for example: Free Megabytes. The counter<br />
defines what is being measured in the object. Every object has at<br />
least one counter.<br />
Instance – Enter an instance, if any, for the object you entered<br />
above, for example: D:<br />
Chapter 6: Using Profiles 535
Global Metric Manager<br />
An object can have one, several, or no instances. For example, for a<br />
system with multiple processors, the Processor object type has<br />
multiple instances, each processor being a different instance. Using<br />
this example, you would enter one of those instances under Instance.<br />
Some object types, such as Memory and Server, do not have<br />
instances, in which case you do not need to enter anything under<br />
Instance. For disk drive instances, use upper case letters—for<br />
example, D: instead of d:.<br />
Leave the Instance box empty if Sample for Each is set to something<br />
other than System.<br />
Scale – Type the multiplier you want applied to the data that is<br />
collected.<br />
If the metric measurement is expressed in kilobytes, setting Scale to<br />
1024 will translate it to bytes. If the metric measurement is<br />
expressed in milliseconds, setting Scale to .001 will translate it to<br />
seconds.<br />
Note: for Perfmon data sources, setting Scale to 0 will use a default<br />
value provided by Windows.<br />
To display the Windows Performance Monitor:<br />
In both Windows 2000 and Windows 2003, select the Run option<br />
from the Start button, then type perfmon or use the following<br />
procedure.<br />
1. Click the Start button.<br />
2. Point to Programs, then Administrative Tools.<br />
3. Click Performance Monitor. The Performance Monitor opens.<br />
4. If you are using the Performance Monitor to display the Object,<br />
Counter, and Instance fields, click the Add counter toolbar button<br />
(+ symbol).<br />
536 <strong>OneSight</strong> <strong>Administrator</strong> <strong>Guide</strong>
Global Metric Manager<br />
Ping Dialog Box<br />
Use the Ping Data Source Configuration dialog box to add or<br />
modify how the Ping data source is configured.<br />
Metric – Specifies the metric to use for the data source: Average<br />
Round Trip Time or Percentage of Success.<br />
Length – Enter the number of bytes that should be included in each<br />
echo request packet.<br />
Time to Live – Specify the maximum number of router hops<br />
permitted. If the echo request takes more than the maximum number<br />
of hops, it is thrown away and the Ping attempt is treated as a<br />
failure.<br />
Time Out Seconds – Enter the amount of time (in seconds) to<br />
wait for an echo reply. If an echo reply is not received in this<br />
amount of time, the Ping echo request is retried.<br />
# of Packets – Specify the number of packets to send for the Ping<br />
echo request.<br />
Chapter 6: Using Profiles 537
Global Metric Manager<br />
Scale – Type the multiplier you want applied to the data that is<br />
collected.<br />
Setting Scale to 1 means the data will be reported as it is. If the<br />
metric measurement is expressed in kilobytes, setting Scale to 1024<br />
will translate it to bytes. If the metric measurement is expressed in<br />
milliseconds, setting Scale to .001 will translate it to seconds.<br />
Port Dialog Box<br />
Use this dialog box to add the Port data source to a metric or<br />
modify how a Port data source is configured.<br />
Port – Specifies the port you want to monitor. Click the arrow to<br />
select from a variety of common ports. If the port you want to<br />
monitor is not listed, select Other and type in the port number.<br />
Time Out Seconds – Specifies the number of seconds to wait for<br />
a reply.<br />
Retries – Specify the upper limit for the number of times a connect<br />
request is retried. For example, if Retries is set to 2, the connect<br />
538 <strong>OneSight</strong> <strong>Administrator</strong> <strong>Guide</strong>
Global Metric Manager<br />
request will be sent up to 3 times. After the third try, if no response<br />
is received, the connect attempt is treated as a failure.<br />
Send String – Specifies the query to be sent to the port. By default, a<br />
linefeed character is appended to the string you specify. If you want<br />
to use an alternate control character, simply append the character<br />
you prefer. If you don’t want any control character appended, add<br />
the null character (\0x00) to the end of the string.<br />
Match String – Specifies the string that should be returned. If you<br />
specify this string, you can trigger an alert and an action plan when<br />
the string is not returned. String matching is case sensitive.<br />
Maximum Read Length – Specifies maximum length of the string to<br />
be read from the port when searching for the text specified in the<br />
Match String box.<br />
Process Dialog Box<br />
Use this dialog box to add the Process data source to a metric or<br />
modify how a Process data source is configured.<br />
Chapter 6: Using Profiles 539
Global Metric Manager<br />
Process – Specify the name of the process you want to monitor. To<br />
monitor all processes on a system, leave this field blank and set the<br />
Sample for Each field in the Metric Editor to Process. You can then<br />
select Process Discovery on the Find Components dialog box to find<br />
all processes on the system.<br />
Measurement – Specifies the process measurement you want to<br />
monitor. Click the arrow to select either count (number of<br />
instances), memory (in MB), or CPU (in percent).<br />
Method of Aggregation – Specifies the method of aggregation to use<br />
for monitoring memory or CPU usage. Click the arrow to select a<br />
method, either Total, Min, or Max.<br />
It is common for an application to run multiple processes with the<br />
same name or even the same commandline. Method of Aggregation<br />
indicates how to aggregate data about multiple processes. ―Total‖<br />
specifies that the monitor should add the measurements from all<br />
such processes, for example, returning the total memory used by<br />
processes named ―httpd‖. ―Min‖ specifies the smallest measurement<br />
for all such processes, returning, for example, the least CPU usage<br />
for all such processes. ―Max‖ specifies the largest measurement for<br />
all such processes, which would help determine, for example, if a<br />
single httpd process is using most of the CPU.<br />
Send sample failure if zero processes found – Sends a sample failure<br />
if no processes are found.<br />
Service Dialog Box<br />
Use this dialog box to add the Service data source to a metric for a<br />
profile monitoring a Windows 2000 or Windows 2003 machine or<br />
to modify the way a Service data source is configured.<br />
540 <strong>OneSight</strong> <strong>Administrator</strong> <strong>Guide</strong>
Global Metric Manager<br />
Note: <strong>OneSight</strong> also offers a dedicated Service monitor that allows<br />
you to monitor a service metric on an individual system.<br />
Service Display name – Specify the 2000 or Windows 2003 service<br />
you want to monitor with this metric. This is the display name as it<br />
appears in the Control Panel.<br />
To see details about the Windows services that you want to monitor<br />
in Windows 2000 or 2003, open the Control Panel, then click<br />
Services in Administrative Tools.<br />
Chapter 6: Using Profiles 541
Global Metric Manager<br />
SNMP Dialog Box<br />
Use this dialog box to add the SNMP data source to a metric or<br />
modify how an SNMP data source is configured. SNMP (Simple<br />
Network Management Protocol) is a widely used protocol that<br />
governs network management and the monitoring of network hosts<br />
and devices and their functions. <strong>OneSight</strong>’s SNMP data source<br />
allows you to monitor hosts and devices that have SNMP enabled<br />
(see Adding a Data Source for more information).<br />
Object ID Settings<br />
Object ID – Specify an Object ID (OID). <strong>OneSight</strong> only uses objects<br />
that return numeric values. If the Object ID you enter does not begin<br />
with a ―.‖, <strong>OneSight</strong> assumes the OID is within the MIB-II<br />
(.1.3.6.1.2.1) hierarchy. Enter the following information in the<br />
Object ID box.<br />
Get – Enter the OID and append the instance identifier to it. For<br />
scalar objects, the instance is always 0. For example, if you want<br />
to retrieve the MIB-2 sysUpTime (.1.3.6.1.2.1.1.3) object, enter<br />
.1.3.6.1.2.1.1.3.0 in the Object ID box, since there is only one<br />
542 <strong>OneSight</strong> <strong>Administrator</strong> <strong>Guide</strong>
Global Metric Manager<br />
instance of this object, and scalar SNMP objects require the ―.0‖<br />
instance identifier.<br />
Table Get – Enter the OID. Do not append the instance identifier<br />
(―.0‖) to it since, for columnar (table) objects, the instance is<br />
non-zero and determined by <strong>OneSight</strong>’s search of the Search for<br />
String parameter within the Table Get OID parameter’s column.<br />
Translation Type – This setting is available only if you select the<br />
Enable check box under the Divide by Object ID setting. The Delta<br />
translation type means that a metric used in a Divide by<br />
calculation is computed as the difference between its current and<br />
previous samples. This allows the Object ID to reflect a complex<br />
calculation such as the difference between the current collision<br />
count and the previous collision count divided by the difference<br />
between the current output packets and the previous output<br />
packets.<br />
General Settings<br />
Action – Select an action:<br />
Get – Allows you to perform a traditional SNMP get operation. If<br />
you select Get, you must also specify a valid Object ID, and<br />
append the instance identifier to it.<br />
Table Get – Allows you to search an SNMP table for numeric data<br />
associated with a particular instance, or row, of the table. If you<br />
select Table Get, you must also specify a valid Object ID (no<br />
instance identifier), Search for String, and column to look in.<br />
Search for string – This setting only applies if Table Get is selected<br />
in the Action box. Enter the string or regular expression that<br />
<strong>OneSight</strong> will search for in the Table Get OID column that you<br />
specify. Because this string search identifies the instance, or row, of<br />
the table, you do not need to append an instance identifier under<br />
Object ID.<br />
Chapter 6: Using Profiles 543
Global Metric Manager<br />
In the case of a web server, this is the port number of the web<br />
server.<br />
Refer to Using Regular Expressions for Pattern Matching in<br />
Chapter 5 for more information on using regular expressions.<br />
in OID column – This setting only applies if Table Get is selected in<br />
the Action box. Enter the column where <strong>OneSight</strong> will search for<br />
the Table Get string you specified above.<br />
Scale – Type the multiplier you want applied to the data that is<br />
collected.<br />
Setting Scale to 1 means the data will be reported as it is. If the<br />
metric measurement is expressed in kilobytes, setting Scale to 1024<br />
will translate it to bytes. If the metric measurement is expressed in<br />
milliseconds, setting Scale to .001 will translate it to seconds.<br />
MIB Browser – Displays the MIB browser in a separate window. You<br />
can view objects in the MIB browser and copy and paste the<br />
appropriate OID into the Object ID field on the Add Data Source<br />
screen.<br />
Divide by Object ID settings<br />
Use the settings under Divide by Object ID in conjunction with Object<br />
ID settings (above) to gather information that’s best expressed as a<br />
ratio. If you do this, the value retrieved by Object ID (above) is the<br />
dividend and the value retrieved by Divide by Object ID (below) is the<br />
divisor (Object ID/Divide by Object ID).<br />
Enable – Select the Enable check box to divide the value of the<br />
Object ID above by the value of the Object ID you specify below.<br />
Object ID – Enter an object ID. For example, in the HOST-<br />
RESOURCES MIB, disk size (hrStorageSize) and disk in use<br />
(hrStorageUsed) are two different OIDs which, when divided,<br />
give you the ratio, or portion, of the disk that is in use. Using this<br />
544 <strong>OneSight</strong> <strong>Administrator</strong> <strong>Guide</strong>
Global Metric Manager<br />
example, you could enter 25.2.3.1.6 as the Object ID and<br />
25.2.3.1.5 as the Divide By Object ID.<br />
Translation Type – This setting is available only if you select the<br />
Enable check box under the Divide by Object ID settings. The Delta<br />
translation type means that a metric used in a Divide by<br />
calculation is computed as the difference between its current and<br />
previous samples. This allows the Object ID to reflect a complex<br />
calculation such as the difference between the current collision<br />
count and the previous collision count divided by the difference<br />
between the current output packets and the previous output<br />
packets.<br />
Chapter 6: Using Profiles 545
Global Metric Manager<br />
String Mappings – Use this button to display the String Mappings<br />
dialog box for entering a string that should be returned for the<br />
query you specified.<br />
<strong>OneSight</strong> collects numeric performance data. If you are<br />
measuring a string representing a string datatype, it can be<br />
converted to a number for use in <strong>OneSight</strong> by using the String<br />
Mappings field. Specify a semicolon delimited mapping of<br />
strings to integers. For example, ―false=0;true=1‖ converts a false<br />
reading to a zero value in <strong>OneSight</strong>.<br />
SNMP Trap Dialog Box<br />
Use this dialog box to add the SNMP Trap data source to a metric or<br />
modify an SNMP Trap data source.<br />
MIB File – Optionally specifies the name and location of the<br />
Management Information Base (MIB) file for the SNMP device. The<br />
MIB file is provided by the SNMP device manufacturer. The MIB<br />
file allows <strong>OneSight</strong> to import the OIDs by name rather than<br />
number. When you specify a MIB file, the Enterprise and Trap Type<br />
lists will be populated with the OID names defined in the MIB file.<br />
546 <strong>OneSight</strong> <strong>Administrator</strong> <strong>Guide</strong>
Global Metric Manager<br />
You can select the names in the Enterprise and/or Trap Type lists to<br />
define which SNMP Trap to monitor.<br />
The <strong>OneSight</strong> Server <strong>Administrator</strong> must copy other SNMP device<br />
manufacturer MIB files to the MIB file directory of the <strong>OneSight</strong><br />
Server before a filename can be specified in this field (<strong>OneSight</strong><br />
includes a onesight.mib file). If you get an error when specifying a<br />
MIB file, contact your <strong>OneSight</strong> Server <strong>Administrator</strong> to verify the<br />
SNMP device MIB file is available on the <strong>OneSight</strong> server.<br />
List Mibs – Lists the MIB files in the C:\Empirix\<strong>OneSight</strong>\mibs\<br />
directory on the <strong>OneSight</strong> server. Use to enter a MIB that is<br />
not listed.<br />
Get Values – Gets the values for Enterprise and Trap type from the<br />
MIB file entered in the Mib File field.<br />
Upload MIB – Lets you upload a MIB file to the<br />
C:\Empirix\<strong>OneSight</strong>\mibs\ directory on the <strong>OneSight</strong> server.<br />
MIB Browser – Displays the MIB Browser in a separate window.<br />
You can view objects and copy and paste them into the Add<br />
Monitor dialog box.<br />
Note: When using SNMP Trap metrics with translation, the mib file<br />
must be copied to the following two locations. If it is not, <strong>OneSight</strong><br />
will still receive and process the trap, however, it will not translate<br />
the OIDs to text.<br />
c:\Empirix\Onesight\mibs\<br />
c:\Empirix\DataCollector\mibs\<br />
Enterprise – Specifies the Enterprise criteria to define which SNMP<br />
Trap to monitor. Enter a specific Enterprise OID.<br />
Trap Type – Specifies the Trap Type criteria to further define which<br />
SNMP Trap to monitor. Enter a specific trap type OID.<br />
Chapter 6: Using Profiles 547
Global Metric Manager<br />
Reset Trap – Specifies the Trap Type criteria that will reset any<br />
existing alerts for this monitor.<br />
Socket Dialog Box<br />
Use this dialog box to set up a TCP/IP socket to collect data on a<br />
TCP/IP port on a remote system. The data source connects to the<br />
host and port specified and treats the data it receives in the same<br />
way as it would treat the data in a log file. This is useful, for<br />
example, for monitoring a serial port via a serial to TCP converter<br />
or for monitoring a system that has a logging port.<br />
TCP/IP Port – Specify the TCP/IP port that you want <strong>OneSight</strong> to<br />
connect to. Data must be being sent down this port.<br />
Metric Type – Select the type of metric.<br />
Perl Expression – select this option when you want to use a Perl<br />
expression to collect data.<br />
548 <strong>OneSight</strong> <strong>Administrator</strong> <strong>Guide</strong>
Global Metric Manager<br />
Number of Matching Records – this metric returns the number of<br />
records that matched the entered Perl expression.<br />
Total Records Encountered Since Last Sample – this metric returns<br />
the number of records written since the last sample.<br />
Time Since Last Modified – this metric returns the length of time<br />
since data was sent to the channel.<br />
Record Type – Specifies the operating mode:<br />
Each record is one line – select this option to use one line at a<br />
time operating mode. In this mode each line read from the file is<br />
treated as a single log file entry and is processed individually.<br />
PERL expression defines record – select this option to use<br />
arbitrary record-based mode. In this mode a Perl expression is<br />
used to determine where each record in the file starts and ends.<br />
The expression is applied to the data as it is read, and records are<br />
picked out as they are found. Entries that exceed the specified<br />
maximum record size are ignored.<br />
If you select Perl expression defines record, the following<br />
additional fields are displayed:<br />
Max Record Length – Enter the maximum record length. Entries<br />
that exceed this length are ignored.<br />
Record Format (PERL) – Enter the Perl expression defining the<br />
record, including the delimiter character.<br />
Inactivity Sample Count – If the Log File data source detects that the<br />
monitored log file does not log any new information for the number<br />
of sample counts you enter here, a sample failure will result. A<br />
value of 0 (the default) disables this setting.<br />
Perl Expression – Specifies a Perl Expression used to collect<br />
numerical performance data from a log file entry. The monitor<br />
Chapter 6: Using Profiles 549
Global Metric Manager<br />
checks the last entry whenever the log file changes. This returned<br />
data can then be used within <strong>OneSight</strong>, both for alerting, using<br />
threshold alerts, and reporting.<br />
To check if the file exists, use the File/directory exists metric type<br />
and leave this field blank.<br />
String Mappings – Displays the String Mappings dialog box for<br />
specifying string mappings.<br />
String Mappings – <strong>OneSight</strong> collects numeric performance data. If<br />
you are measuring a log file response that is a string, it can be<br />
converted to a number for use in <strong>OneSight</strong> by using the String<br />
Mappings field. Simply specify a semicolon delimited mapping<br />
of Strings to Integers. For example, ―false=0;true=1‖; will<br />
convert a ―false‖ reading to a 0 value in <strong>OneSight</strong>, and this will<br />
be displayed in <strong>OneSight</strong> Status as ―false=0‖. If you only want to<br />
display the string on the <strong>OneSight</strong> status page, use a colon, rather<br />
than a semi-colon to delimit the values.<br />
If you neglect to provide a mapping for a specific string,<br />
<strong>OneSight</strong> will consider this a Sample Failure, and report the<br />
String that was returned. String Mappings can also be used to<br />
translate a number to a String for display in <strong>OneSight</strong> Status.<br />
This is helpful when numbers represent an objects state.<br />
Note that string matching is case-insensitive and data that has a<br />
colon cannot be used in string mapping.<br />
Sample Continuously – Select to sample continuously. This field is<br />
only available when Metric Type is Perl Expression value.<br />
Alert Collection Mode – Select how you want alerts to be processed.<br />
Report Alerts as they Occur – If multiple alerts occur on the same<br />
trigger they are all sent. Alerts with the same timestamp as a<br />
previous alert will not be sent.<br />
550 <strong>OneSight</strong> <strong>Administrator</strong> <strong>Guide</strong>
Global Metric Manager<br />
Report First Alert Encountered for a Trigger – The first alert that<br />
occurs during a sample run for a specific trigger is the only one<br />
sent. Subsequent alerts for the same trigger are ignored.<br />
Report Last Alert Encountered for a Trigger – The last alert that<br />
occurs during a sample run for a specific trigger is the only one<br />
sent. Previous alerts for the same trigger are ignored.<br />
Report all Alerts for a Trigger as a bundle – Send all alerts that<br />
occur for a specific trigger during the sample run as one alert<br />
message.<br />
UNIX System Dialog Box<br />
Use this dialog box to add the UNIX System data source to a metric<br />
or modify a UNIX System data source. For the UNIX System data<br />
source to function correctly, the <strong>OneSight</strong> Remote Agent must be<br />
installed on the monitored machine.<br />
Chapter 6: Using Profiles 551
Global Metric Manager<br />
The metrics this data source can gather depend on the data sources<br />
(described below) that collect the data. For example, for Solaris<br />
metrics, the data source will use the kstat (3K) facility to collect<br />
CPU, disk, and memory data; the proc (/proc) file system to collect<br />
process data; and the Streams mechanism to collect network data.<br />
Metric Settings<br />
Data Source<br />
kstat – Provides kernel statistics.<br />
proc – Retrieves process data.<br />
streams – Provides network-related data.<br />
iostat – Reports disk and I/O activity metrics similar to those<br />
provided by the iostat -x command.<br />
vmstat – Reports statistics regarding process, virtual memory,<br />
trap, and CPU activity similar to those provided by the vmstat<br />
and vmstat -S commands.<br />
552 <strong>OneSight</strong> <strong>Administrator</strong> <strong>Guide</strong>
Global Metric Manager<br />
df – Retrieves the amount of disk space occupied by mounted or<br />
unmounted file systems, the amount of used available space, and<br />
how much of the file system’s total capacity has been used.<br />
For more information about how to collect statistics using UNIX<br />
system data sources, check the <strong>OneSight</strong> Support area of the<br />
Empirix.com web site.<br />
Object – Enter an object for the data source you selected.<br />
Metric – Enter a metric.<br />
Scale - Type the multiplier you want applied to the data that is<br />
collected.<br />
Setting Scale to 1 means the data will be reported as it is. If the<br />
metric measurement is expressed in kilobytes, setting Scale to 1024<br />
will translate it to bytes. If the metric measurement is expressed in<br />
milliseconds, setting Scale to .001 will translate it to seconds.<br />
Translation Type – This setting is available if you select the Enable<br />
check box the Divide by Metric option described below. The Delta<br />
translation type means that a metric used in a Divide by calculation<br />
is computed as the difference between its current and previous<br />
samples. This allows the metric to reflect a complex calculation<br />
such as the difference between the current collision count and the<br />
previous collision count divided by the difference between the<br />
current output packets and the previous output packets.<br />
Divide by Metric Settings<br />
Use the settings under Divide by metric in conjunction with Metric<br />
settings (above) to gather information that is best expressed as a<br />
ratio. If you do this, the value retrieved by Metric (above) is the<br />
dividend and value retrieved by Divide by metric (below) is the<br />
divisor (Metric/Divide by metric).<br />
Chapter 6: Using Profiles 553
Global Metric Manager<br />
Enable – Select the Enable check box to divide the value of the<br />
metric above by the value of the metric you specify below.<br />
Object – Enter an object. The data source specified in the Data<br />
Source list, under Metric, is the data source that will be used.<br />
Metric – Enter a metric.<br />
Translation Type – This setting is available only if you select the<br />
Enable check box under the Divide by Metric settings. The Delta<br />
translation type means that a metric used in a Divide by<br />
calculation is computed as the difference between its current and<br />
previous samples. This allows the metric to reflect a complex<br />
calculation such as the difference between the current collision<br />
count and the previous collision count divided by the difference<br />
between the current output packets and the previous output<br />
packets.<br />
URL Dialog Box<br />
Use the URL Data Source Configuration dialog box to add or modify<br />
how the URL data source is configured.<br />
554 <strong>OneSight</strong> <strong>Administrator</strong> <strong>Guide</strong>
Global Metric Manager<br />
Report on – Lets you check the amount of time it takes to download the<br />
file/content or the size of the file. Once you know the file size you can<br />
create an alert to check whether the size is greater than expected.<br />
Download Time – Returns the download time.<br />
Download File Size – Returns the size of the file.<br />
Perl Expression – Specifies a Perl Expression used to retrieve the<br />
file size.<br />
String Mappings – Use this button to display the String Mappings<br />
dialog box for entering a string that should be returned for the<br />
query you specified.<br />
<strong>OneSight</strong> collects numeric performance data. If you are<br />
measuring a string representing a string datatype, it can be<br />
converted to a number for use in <strong>OneSight</strong> by using the String<br />
Mappings field. Specify a semicolon delimited mapping of<br />
strings to integers. For example, ―false=0;true=1‖ converts a false<br />
reading to a zero value in <strong>OneSight</strong>.<br />
Measurement Details<br />
Retrieve Images – If you want to calculate URL availability and<br />
access time with retrieval of embedded images (such as .gif and<br />
.jpeg files and references within tags) included, select this<br />
check box.<br />
Retrieve Objects – If you want to calculate URL availability and<br />
access time with retrieval of embedded objects (such as ActiveX<br />
objects and Java applets) included, select this check box.<br />
<strong>OneSight</strong> measures the time taken to retrieve data used by<br />
objects, but does not include the time needed to retrieve any<br />
executable file required in order to interpret the data. Content<br />
types other than HTML and images are also classified as objects.<br />
Save object download details – When selected, collects data for the<br />
object timer report.<br />
Chapter 6: Using Profiles 555
Global Metric Manager<br />
Authentication Settings – Fill in User Name and Password information<br />
to monitor URLs with HTTP Basic Authentication restrictions.<br />
User Name – If the URL specified requires a name and password<br />
for access, enter the name in this field.<br />
Password – If the URL specified requires a name and password<br />
for access, enter the password in this field.<br />
Proxy Server Settings – If your network makes use of a proxy server, you<br />
can specify this information here. Check Use a proxy server and add the<br />
information below.<br />
If you find that a <strong>OneSight</strong> URL monitor fails to reach a URL when your<br />
browser successfully connects to the same URL, check your proxy server<br />
settings in your browser. For example, in Internet Explorer, select<br />
Internet Options from the Tools menu and then click LAN settings on<br />
the Connections tab. If proxy server settings are configured for your<br />
browser, they may also need to be configured for the URL monitor.<br />
Use a proxy server – When selected, <strong>OneSight</strong> uses the specified<br />
proxy server for this monitor.<br />
Proxy Host – The name or IP address of the proxy server.<br />
Port – The port of the proxy server.<br />
Proxy User Name – The proxy server login user name.<br />
Password – The proxy server login password.<br />
556 <strong>OneSight</strong> <strong>Administrator</strong> <strong>Guide</strong>
Global Metric Manager<br />
Virtual Agent Dialog Box<br />
Use this dialog box to add the Virtual Agent data source to a metric.<br />
Operating System – Select the operating system being used on the<br />
host machine. If you select Custom Setting, enter the Command, Perl<br />
Expression, and Key Index manually.<br />
Metric Name – Specifies the metric to measure. If you select a<br />
predefined metric for one of the operating systems, the Command,<br />
Perl Expression, and Key Index are automatically entered. If you select<br />
Custom Setting, enter the Command, Perl Expression, and Key Index<br />
manually.<br />
Command – Specifies the command to execute on the host machine.<br />
Perl Expression – Specifies a Perl expression to use to report the<br />
data returned from the executable program. See Using Regular<br />
Expressions for Pattern Matching in Chapter 5 for more<br />
information about specifying Perl expressions.<br />
Chapter 6: Using Profiles 557
Global Metric Manager<br />
Process remote server response as a single block – When selected,<br />
all output is treated as a single block of data. The default is to treat<br />
output as one line at a time.<br />
String Mapping – <strong>OneSight</strong> collects numeric performance data. If<br />
you are measuring a response from a Virtual Agent that is<br />
represented a string, it can be converted to a number for use in<br />
<strong>OneSight</strong> by using the String Mappings field. Simply specify a<br />
semicolon delimited mapping of Strings to Integers. For example,<br />
"false=0;true=1" will convert a "false" reading to a 0 value in<br />
<strong>OneSight</strong>, and this will be displayed in <strong>OneSight</strong> Status as<br />
"false=0". If you wish to just display the string in <strong>OneSight</strong> Status,<br />
use a colon, rather than a semicolon, to delimit your values.<br />
If you neglect to provide a mapping for a specific string, <strong>OneSight</strong><br />
will consider this a Sample Failure, and report the String that was<br />
returned.<br />
String Mappings can also be used to translate a number to a String<br />
for display in <strong>OneSight</strong> Status. This is helpful when numbers<br />
represent an objects state.<br />
Note that string matching is case-insensitive.<br />
Key Index – Specifies which value within the Perl expression that<br />
represents the instance of the data returned from the executable<br />
program. If the metric can be an instance, then the key defines<br />
which value should be checked for that particular instance.<br />
-1 – there is no key to match. The Virtual Agent returns the first<br />
value it matches.<br />
0 – the Virtual Agent uses the first value it matches to compare<br />
against the configured component. If a match is found, the second<br />
match is returned as the metric to <strong>OneSight</strong>.<br />
558 <strong>OneSight</strong> <strong>Administrator</strong> <strong>Guide</strong>
Global Metric Manager<br />
1 – the Virtual Agent uses the second value it matches to<br />
compare against the configured component. If a match is found,<br />
the first match is returned as the metric to <strong>OneSight</strong>.<br />
Refer to the examples at the end of this section for information on<br />
how the perl expression and the key index should be configured to<br />
correctly extract a value.<br />
Command Procedure – Select the state machine containing the XML<br />
for running a complex command. This is useful, for example, when<br />
you want to run a different command depending on the output of a<br />
previous command. Refer to “Configuring State Machines,” in<br />
Chapter 5 for more information.<br />
Configuration Example 1<br />
The user has a Linux system with the following components (―/‖<br />
and ―.sys‖) defined for the file system. The command that is to run<br />
is df –a and the output is as follows:<br />
File<br />
System<br />
1Kblocks<br />
Used Available Use% Mounted On<br />
tmpfs 498792 213176 285616 43% /<br />
proc 0 0 0 - /proc<br />
sysfs 0 0 0 - /sys<br />
devpts 0 0 0 - /dev/pts<br />
usbfs 0 0 0 - /proc/bus/usb<br />
The following are defined in the Metric Editor:<br />
Command: /bin/df –a<br />
Perl Expression: /\S+\s+([0-9]+)\s+[0-9]+.*\S+\s+(\S+)/<br />
Key Index: 1<br />
Chapter 6: Using Profiles 559
Global Metric Manager<br />
In this example, the perl expression checks each line of output and<br />
extracts the following values:<br />
498792 /<br />
0 /proc<br />
0 /sys<br />
0 /dev/pts<br />
0 /proc/bus/usb<br />
The Virtual Agent then checks each line of the output and uses the<br />
key index to identify a matching row and returns the appropriate<br />
value.<br />
Note: The Virtual Agent only uses the first two matches it finds. For<br />
example, it uses the first two values in parenthesis, not including<br />
the column delimiters such as (?:\S+\s+).<br />
Configuration Example 2<br />
Using the example above, what happens if the components are<br />
defined as tmpfs and sysfs. the Metric Editor configuration would<br />
be as follows:<br />
Command: /bin/df –a<br />
Perl Expression: /(\S+)\s+([0-9]+)\s+[0-9]+.*\S+\s+(\S+)/<br />
Key Index: 0<br />
The matching output would be:<br />
tmpfs 498792<br />
proc 0<br />
sysfs 0<br />
devpts 0<br />
usbfs 0<br />
Even if the final (\S+) remains in the pattern, it will not be included<br />
in the matches that the Virtual Agent evaluates. In addition, the key<br />
index had to be changed to match the newly defined components.<br />
560 <strong>OneSight</strong> <strong>Administrator</strong> <strong>Guide</strong>
Global Metric Manager<br />
WMI System Dialog Box<br />
Use this dialog box to add the WMI data source to a metric or<br />
modify a WMI data source.<br />
Namespace – Specifies the name space, for example: root\cimv2 (the<br />
default). Data in the WMI repository is organized by schemas,<br />
which are loaded into ―namespaces.‖ A namespace provides a<br />
domain (or container) for a schema and for the instances of the<br />
classes in that schema.<br />
Select – Specifies the name of the metric, for example: FreeSpace.<br />
From – Specifies the class name, for example: Win32_LogicalDisk.<br />
Where – Specifies the key name and value, for example: Name=”C:\”.<br />
Scale – Type the multiplier you want applied to the data that is<br />
collected.<br />
String Mappings – Displays the String Mappings dialog box for<br />
specifying string mappings.<br />
Chapter 6: Using Profiles 561
Global Metric Manager<br />
String Mappings – <strong>OneSight</strong> collects numeric performance data. If<br />
you are measuring a WMI object representing a String datatype, it<br />
can be converted to a number for use in <strong>OneSight</strong> by using the<br />
String Mappings field. Simply specify a semicolon delimited<br />
mapping of Strings to Integers. For example, ―false=0;true=1‖;<br />
will convert a ―false‖ reading to a 0 value in <strong>OneSight</strong>, and this<br />
will be displayed in <strong>OneSight</strong> Status as ―false=0‖. If you only<br />
want to display the string on the <strong>OneSight</strong> status page, use a<br />
colon, rather than a semi-colon to delimit the values.<br />
If you neglect to provide a mapping for a specific string,<br />
<strong>OneSight</strong> will consider this a Sample Failure, and report the<br />
String that was returned. String Mappings can also be used to<br />
translate a number to a String for display in <strong>OneSight</strong> Status.<br />
This is helpful when numbers represent an objects state.<br />
Note that string matching is case-insensitive and data that has a<br />
colon cannot be used in string mapping.<br />
Setting a Metric’s Sampling Interval<br />
To set a metric’s sampling interval:<br />
1. In the Metric Editor, click the General tab.<br />
2. In the Sample Every: box, enter how often you would<br />
like the web component sampled.<br />
562 <strong>OneSight</strong> <strong>Administrator</strong> <strong>Guide</strong>
Global Metric Manager<br />
Removing Metrics<br />
3. From the list to the right of Sample Every , select<br />
whether the Sample Every value should be measured in<br />
Seconds, Minutes, or Hours.<br />
To delete a metric:<br />
1. In the Profile Editor, click the Global Metric Manager button.<br />
The Global Metric Manager opens.<br />
2. Highlight the metric’s name under Global Metrics and click<br />
Remove.<br />
3. A warning dialog box appears, confirming that you intend to<br />
permanently delete the metric. Click OK.<br />
The metric is removed from the profile, and from any other<br />
profiles to which it belonged.<br />
Chapter 6: Using Profiles 563
Modifying a Metric’s Data Source<br />
Modifying a Metric’s Data Source<br />
To modify a metric’s data source:<br />
1. In the Metric Editor, click the Data Sources tab.<br />
2. Modify the configuration information (see the descriptions of<br />
the settings in the Data Source Configuration dialog boxes for<br />
more information).<br />
3. Click OK.<br />
564 <strong>OneSight</strong> <strong>Administrator</strong> <strong>Guide</strong>
C h a p t e r 7<br />
Configuring Systems<br />
Adding Systems<br />
Systems, and information about the components on each system,<br />
must be identified so that <strong>OneSight</strong> profiles can be used to create<br />
profile monitors for the web components running on those<br />
machines.<br />
You can add systems one at a time or you can add multiple systems.<br />
Multiple systems are imported from a .csv or .xml file, after which<br />
you can perform multiple system discovery to discover the<br />
components to monitor.<br />
To add a system definition:<br />
1. Click the Configure menu.<br />
565
Adding Systems<br />
2. Click Systems to open the Systems page.<br />
Show Systems Where contains – Select the<br />
type of filter and enter any specific text, if necessary. For<br />
example, you could search for all systems at the location<br />
Boston. In addition to plain text, you can enter a PERL<br />
expression in the contains field.<br />
Add – To manually set up a new system definition for a<br />
specified machine, click Add to open the Add System dialog<br />
box. After specifying the machine’s computer name or IP<br />
address, click OK. Optionally, you can direct <strong>OneSight</strong> to find<br />
system components (such as disk drives, processes, and web<br />
servers) on the system that you are adding. However, this is not<br />
necessary because when you apply a profile to the system to<br />
create a monitor, <strong>OneSight</strong> prompts you to add any missing<br />
system components that are tracked by that monitor.<br />
In the System Editor, on the System tab, specify the Operating<br />
System that is running on the machine. Click OK in the System<br />
Editor to save the machine information and return to the Add<br />
Monitor dialog box.<br />
566 <strong>OneSight</strong> <strong>Administrator</strong> <strong>Guide</strong>
Adding Systems<br />
Modify – To change the name or system properties of an existing<br />
system, select the system name in the Systems list and click<br />
Modify. In the System Editor, make the desired changes, and<br />
then click OK to update the system information and return to the<br />
Add Monitor dialog box.<br />
Remove – To remove a system from the list, select the system<br />
name in the Systems list and click Remove.<br />
Import – Displays the Add System dialog box for adding<br />
multiple systems from a .csv or .xml file that specifies the<br />
systems to add and optionally, some additional properties. After<br />
importing the systems, you can use Multiple System Discover to<br />
find the components to monitor.<br />
Used By – Opens a list of the profile names that currently use<br />
the selected system.<br />
Multiple System Discovery – Displays the discover components<br />
dialog box for selecting the discovery methods that you want to<br />
use to discover the components to monitor.<br />
Note: the systems being discovered must have the same type of<br />
operating system. For example, they must be all Windows<br />
machines or all Linux machines.<br />
Bulk Location Modification – Displays the Bulk Location<br />
Modification dialog box for changing the location of multiple<br />
systems.<br />
3. Click Add to open the Add System dialog box.<br />
Chapter 7: Configuring Systems 567
Adding Systems<br />
Use settings in the Add System dialog box to add a new system<br />
to the list of systems that are recognized by <strong>OneSight</strong> for<br />
monitoring purposes. The Add System dialog box has the<br />
following settings<br />
System Name – Type the computer name or IP address that<br />
identifies the machine.<br />
Device Type – Specify the type of device. This specification<br />
affects licensing and which profiles and metrics can be applied<br />
to the system. Metrics are categorized into three types. Basic<br />
metrics measure basic operating system performance such as<br />
CPU, Disk, etc. and cannot be modified. Premium metrics are<br />
metrics defined by the contact center and cannot be modified.<br />
All other metrics are advanced metrics. The options are:<br />
Advanced Server – All profiles can be applied to this system.<br />
If you are using premium metrics, you must define the system<br />
as an advanced server. Each profile applied to this system<br />
consumes one advanced server license. In addition, each<br />
premium profile applied to this system consumes both an<br />
advanced server license and a premium profile license.<br />
Basic Server – Only basic profiles such as Windows, Linux,<br />
Solaris, Unix, etc., can be applied to this system. The license<br />
consumed is per system, not per profile.<br />
568 <strong>OneSight</strong> <strong>Administrator</strong> <strong>Guide</strong>
Adding Systems<br />
Network Device – Only profiles with Ping or SNMP metrics<br />
can be applied to this system, otherwise a licensing error will<br />
occur. The license consumed is per system regardless of the<br />
number of profiles applied.<br />
4. In the System Name box, type the computer name or IP address<br />
that identifies the machine you want to add and select the<br />
device type. When you click OK, the System Editor opens.<br />
Use settings in the System Editor to supply information about<br />
the components on the current system. The System Editor lists<br />
all the types of system components that you can monitor on the<br />
specified machine.<br />
Display Name – Identifies the system that you are currently<br />
defining.<br />
Components – Shows the types of objects that profiles are used<br />
to monitor: System, CPU, Database, Database log file, Disk,<br />
File System, Interface, Port, Process, and Web server. When<br />
you add a system component, the Components list expands to<br />
show the name of the added components under the appropriate<br />
category. For example, if you add a disk drive, the name of the<br />
Chapter 7: Configuring Systems 569
Adding Systems<br />
drive you added appears in the Disk section of the Components<br />
list.<br />
Add – Opens the Add System Component dialog box so that<br />
you can add a system component or a global component type.<br />
Remove – Removes the currently selected system component<br />
from the system definition.<br />
Add Data Source – When you select a component in the<br />
Components list, and click Add Data Source, the Add Data<br />
Source dialog box is displayed listing the data sources<br />
applicable to this component. When you click OK, the Property<br />
tabs are displayed with the settings for configuring the data<br />
sources that <strong>OneSight</strong> profile metrics use to obtain information<br />
about this type of system component.<br />
For information about the Properties tabs used for each type of<br />
component, refer to the following sections.<br />
Remove Data Source – Removes the selected data source.<br />
Discover Components – Directs <strong>OneSight</strong> to find system<br />
components on the current system. The Find Components<br />
Configuration dialog box opens so that you can specify what<br />
methods should be used to find components. When you click<br />
OK, the discovery process runs and reports on its progress.<br />
When the process completes click Done to return to the System<br />
Editor.<br />
5. You can use the System Editor to identify all of the components<br />
on this system that you want <strong>OneSight</strong> to monitor. See Adding<br />
System Components Manually for more information.<br />
6. Click OK to save the system definition you have added and<br />
return to the Add Monitor dialog box.<br />
570 <strong>OneSight</strong> <strong>Administrator</strong> <strong>Guide</strong>
Adding Multiple Systems<br />
Adding Multiple Systems<br />
You can import multiple systems into <strong>OneSight</strong> using a .csv or .xml<br />
file that contains the system names and some optional additional<br />
properties. This file must be located in the <strong>OneSight</strong> imports<br />
directory. A sample file, systems.xml, is located in the imports<br />
directory.<br />
The following optional properties can be included in addition to the<br />
system names:<br />
Settings on the System’s System tab: Device Type, IP Address,<br />
NetBIOS Name, Operating System, Location, and On Failure.<br />
SNMP Discovery settings: Community, Timeout, Retries, Port,<br />
and Version.<br />
Windows NT authentication information: User, Password, and<br />
Domain.<br />
Virtual Agent discovery settings: Connection Method, Port,<br />
Prompt, Charset, Operating System, User, Password, Private Key<br />
file, Login Timeout, and Discovery Timeout.<br />
User group cannot be specified. Imports must be done by specific<br />
user group.<br />
Property names in the import file must match those expected by<br />
<strong>OneSight</strong>. If they do not, an error message is displayed. The<br />
following example .xml files show the property names that should<br />
be used. Following is a list of valid values for certain properties:<br />
DeviceType – NetworkDevice, BasicServer, AdvancedServer<br />
OperationSystemType – NT_OS, OTHER_UNIX_OS,<br />
SUN_SOLARIS_OS<br />
Location – Default Location, <br />
Chapter 7: Configuring Systems 571
Adding Multiple Systems<br />
OnFailure – Send ping, Run Traceroute, Do Nothing<br />
SnmpVersion – Snmp_Version1, Snmp_Version2c<br />
ConnectionMethod – Local Machine, SSH, Telnet<br />
Charset – Big5, Big5-HKSCS, EUC-JP, etc., UTF-16, etc., UTF-8,<br />
etc.<br />
OperatingSystem – HPUX-v11_0, Linux-RH-v7_1, HPUX,<br />
AIX-v4_3, Solaris-v5_8, Windows<br />
Following is an example that includes only the system name.<br />
<br />
<br />
<br />
<br />
<br />
Following is an example that includes the system name and<br />
discovery properties for SNMP.<br />
<br />
<br />
<br />
<br />
<br />
<br />
<br />
<br />
<br />
<br />
Following is an example that includes the system name and<br />
discovery properties for Windows.<br />
<br />
<br />
<br />
<br />
<br />
<br />
572 <strong>OneSight</strong> <strong>Administrator</strong> <strong>Guide</strong>
Adding Multiple Systems<br />
<br />
<br />
Following is an example that includes the system name and<br />
discovery properties for the System tab.<br />
<br />
<br />
<br />
<br />
<br />
<br />
<br />
<br />
<br />
<br />
<br />
Following is an example that includes the system name and<br />
discovery properties for Virtual Agent.<br />
<br />
<br />
<br />
<br />
<br />
<br />
<br />
<br />
<br />
<br />
<br />
<br />
<br />
<br />
<br />
To add multiple systems:<br />
1. Click the Configure menu.<br />
2. Click Systems to open the Systems page.<br />
3. Click Import to display the Add systems dialog box.<br />
Chapter 7: Configuring Systems 573
Adding Multiple Systems<br />
Import File Name – Enter the name of the .csv or .xml file that<br />
contains the systems that you want to import and any optional<br />
properties. This file must be located in the <strong>OneSight</strong> imports<br />
directory.<br />
4. Enter the name of the import file. This file must be located in<br />
the <strong>OneSight</strong> imports directory.<br />
5. Click OK. The systems are imported. You can now discover the<br />
components to monitor by clicking Multiple System Discover.<br />
Refer to “Discovering Multiple Systems” later in this chapter.<br />
574 <strong>OneSight</strong> <strong>Administrator</strong> <strong>Guide</strong>
Adding a New Component Type<br />
Adding a New Component Type<br />
Use options in the Add System Component dialog box to add a new<br />
global component type.<br />
Information about the components on each system must be<br />
identified so that <strong>OneSight</strong> profiles can be used to create monitors<br />
for the web components running on those machines. The Add New<br />
Component Type dialog box allows you to manually add new<br />
global components types in addition to those defined automatically<br />
by <strong>OneSight</strong>. You can also use this dialog box to add a new<br />
component manually.<br />
After adding a new component type, you need to configure the data<br />
sources that gather information for the profile metrics that apply to<br />
Chapter 7: Configuring Systems 575
Adding a New Component Type<br />
this component type. In the System Editor, select the component<br />
type that you added and fill in the discovery settings on the<br />
Properties tabs. See the Find Components Configuration dialog box<br />
help for information on running the Find Components discovery<br />
procedure.<br />
Add type – Select the type of component you are adding to display<br />
the fields associated with the selected type.<br />
Component Type – Select this option to add a new component<br />
type. This is the only option available from the system node.<br />
Component – Select this option to add components for the<br />
selected component type.<br />
Component Type Definition<br />
Name – Specify a meaningful name that allows you to identify<br />
the specific component type you are adding.<br />
Description – Type a description that helps you differentiate this<br />
component type from the other component types you are defining<br />
to monitor your web components.<br />
Component Definition<br />
Component type – The type list defaults to the kind of component<br />
that was selected when you clicked the Add button to open the<br />
Add System Component dialog box. Select the type of<br />
component you want to add and configure.<br />
Component – Specify a meaningful name that allows you to<br />
identify the specific component you are adding. You can add<br />
multiple instances of a component using the following syntax:<br />
name[[[numbers..numbers]]]<br />
For example, e[[[8..10]]] creates the following components:<br />
e8, e9, and e10.<br />
576 <strong>OneSight</strong> <strong>Administrator</strong> <strong>Guide</strong>
Modifying System Definitions<br />
Data Sources to Add – The data sources applicable to the type of<br />
component you are adding are listed. Select the data sources that<br />
you want to use. When you click OK the associated tabs are<br />
displayed so that you can configure the selected data sources.<br />
Modifying System Definitions<br />
To modify a system definition:<br />
1. Click the Configure menu.<br />
2. Click Systems.<br />
3. Select the system in the Systems list and click Modify. The<br />
System Editor opens. Use settings in the System Editor to<br />
update information about the components on the current<br />
system.<br />
CPU System Information<br />
When you add a new CPU component, you must add information to<br />
the Properties tabs to configure the data sources that <strong>OneSight</strong><br />
metrics use to obtain information about the CPU.<br />
Component Tab – The Component Tab shows the name of the CPU<br />
you are configuring. Changing this name will affect the CPU entry<br />
on the left side of the System Editor dialog box.<br />
Name – In the Name box, specify a meaningful name that allows<br />
you to identify the specific CPU you are adding.<br />
Perfmon Tab – The Windows Performance Monitor (Perfmon) can<br />
be used with <strong>OneSight</strong> to gather resource information for specific<br />
components and program processes throughout your system. To<br />
enable <strong>OneSight</strong> to use this information, you must first start and<br />
configure Performance Monitor for your system. For more<br />
information, see Chapter 5.<br />
Chapter 7: Configuring Systems 577
Modifying System Definitions<br />
Instance – Typically, this value is zero for single-processor<br />
machines. If you have a multiprocessor machine, then look up the<br />
Instance value in the NT Performance Monitor.<br />
SNMP Tab – Adding information to the Simple Network<br />
Management Protocol (SNMP) tab enables <strong>OneSight</strong> to provide<br />
specific performance and configuration information on network<br />
devices, such as routers, or on hosts, such as workstations or<br />
mainframes.<br />
To use SNMP with <strong>OneSight</strong>, you must enable SNMP on the<br />
machines you intend to monitor. For more information, see the<br />
SNMP System Requirements. The <strong>OneSight</strong> Solaris profile queries<br />
the Sun SNMP agent for Sun’s MIB and the RFC-1213 (MIB-2).<br />
The following options are available on the SNMP tab for the<br />
component type.<br />
Object ID (to override default discovery) – Enter the object ID of<br />
the object you want to discover if it is different than the default<br />
discovery. Click Browse to display the MIB browser for<br />
searching for the object.<br />
Perl Expression – Enter a Perl expression if you want to further<br />
qualify the results returned by the discovery request. Refer to<br />
Using Regular Expressions for Pattern Matching in Chapter 5<br />
for more information about regular expressions.<br />
The following option is available on the SNMP tab for individual<br />
components.<br />
Search for string – This field is automatically filled in as a result<br />
of discovery based on the Object ID and Perl expression that<br />
were entered.<br />
UNIX System Tab – Currently, the CPU component does not use<br />
UNIX System information as a data source. Settings on this tab can<br />
be ignored.<br />
578 <strong>OneSight</strong> <strong>Administrator</strong> <strong>Guide</strong>
Modifying System Definitions<br />
Virtual Agent Tab – This tab is necessary when you are using a<br />
virtual agent metric and you apply a profile that makes use of the<br />
component.<br />
Instance – Enter the component that you want to monitor.<br />
WMI Tab – Windows Management Instrumentation (WMI) can be<br />
used to provide <strong>OneSight</strong> with in-depth information about the<br />
configuration, status, and operational aspects of your Windows<br />
operating system.<br />
Instance – Enter the component that you want to monitor.<br />
Database System Information<br />
After <strong>OneSight</strong> has discovered a database on a system (or you have<br />
added a database to the system list yourself), you must add the<br />
following information for <strong>OneSight</strong> to monitor the database.<br />
Oracle Database System Information<br />
After <strong>OneSight</strong> has discovered a database on a system (or you have<br />
added a database to the system list yourself), you must add the<br />
following information for <strong>OneSight</strong> to monitor the database.<br />
Note: The strings in the examples below are case-sensitive: use the<br />
same case as displayed.<br />
Component Tab – The Component tab shows the name of the<br />
database you are configuring. Changing this name will affect the<br />
database entry on the left side of the System Editor dialog box.<br />
<strong>OneSight</strong> uses JDBC to connect to your Oracle database.<br />
JDBC Tab – <strong>OneSight</strong> uses a JDBC driver to connect to your<br />
database. Two examples of such a JDBC driver are:<br />
JDBC-ODBC Bridge (installed as part of <strong>OneSight</strong>). Before<br />
configuring the JDBC-ODBC bridge for Oracle, you must first<br />
Chapter 7: Configuring Systems 579
Modifying System Definitions<br />
install the Oracle Client on the <strong>OneSight</strong> server and set up an<br />
ODBC DSN.<br />
Oracle Thin JDBC driver. You will need to install the Oracle Thin<br />
JDBC driver on the machine that runs <strong>OneSight</strong>. Download the<br />
JDK 2.0 version from<br />
http://www.oracle.com/technology/software/tech/java/sqlj_jdbc/index.htm<br />
l. Unzip the driver classes into a Classes folder beneath your<br />
<strong>OneSight</strong> folder.<br />
For monitoring enterprise level databases, the Oracle Thin JDBC<br />
driver is recommended.<br />
Driver – Select a driver type from the list: Oracle Thin JDBC driver,<br />
Inet Sprinta JDBC driver for Microsoft SQL Server, Sun<br />
JDBC:ODBC Bridge, or Custom. You must have the appropriate<br />
driver installed on the <strong>OneSight</strong> Server in order to set up a Database<br />
monitor.<br />
Driver String – This information will vary depending on the type of<br />
database that you are monitoring. If you selected any option other<br />
than Custom, the appropriate string is automatically displayed. For<br />
example, this is the string for the Oracle Thin JDBC driver:<br />
oracle.jdbc.driver.OracleDriver<br />
If you selected a Custom driver type, you can type in the Driver<br />
String yourself.<br />
Connect String – For most drivers, this string is constructed from<br />
the information you supply in the following fields. The structure of<br />
the Connect String is different for each driver type, but <strong>OneSight</strong><br />
builds this string for all driver types except a Custom driver type.<br />
For a Custom driver setting, type in the Connect String.<br />
Connection Settings<br />
580 <strong>OneSight</strong> <strong>Administrator</strong> <strong>Guide</strong>
Modifying System Definitions<br />
Host – Specify the host name of the machine running the<br />
database. This is not required for a JDBC:ODBC or Custom driver<br />
setting.<br />
Instance – Specify the database instance.<br />
Port – <strong>OneSight</strong> displays the default port for the driver you<br />
selected. For example, the default port for an Oracle Thin JDBC<br />
driver is 1521. Modify the port number if necessary. This is not<br />
required for a JDBC:ODBC or Custom driver setting.<br />
Database Name or Database SID – For the Inet Sprinta driver for<br />
SQL Server, provide the database name. For the Oracle Thin<br />
JDBC driver, provide the database or server ID.<br />
System DSN – This field applies to the JDBC:ODBC Bridge driver<br />
type only. In the Windows Control Panel, locate the System DSN<br />
in the ODBC Data Sources field to confirm the name of the<br />
database. The connect string will have the following format:<br />
Authentication<br />
jdbc:odbc:<br />
User name – If a user name and password are required for access<br />
to the database, enter the user name here. The user must have<br />
system administrator privileges.<br />
Password – If a user name and password are required for access<br />
to the database, enter the password here.<br />
Perfmon Tab – This tab applies to profiles for Microsoft SQL<br />
Server. This tab does not apply to Oracle databases.<br />
Instance – Instance refers to the Perfmon counter instance and is<br />
not used for monitoring Oracle databases. Leave this field blank.<br />
UNIX System Tab – The UNIX System tab is used when configuring<br />
monitors to collect data on UNIX workstations. If the machine you<br />
Chapter 7: Configuring Systems 581
Modifying System Definitions<br />
are configuring as a monitored system is not a UNIX machine, this<br />
tab is unnecessary.<br />
If you are monitoring a UNIX machine, make sure the proper<br />
<strong>OneSight</strong> UNIX Remote Agent is installed. For help installing the<br />
UNIX Remote Agent, see Installing the UNIX Remote Agent in<br />
Chapter 2.<br />
Instance – Enter the name of the database to be monitored.<br />
WMI Tab – Windows Management Instrumentation (WMI) can be<br />
used to provide <strong>OneSight</strong> with in-depth information about the<br />
configuration, status, and operational aspects of your Windows<br />
operating system.<br />
Instance – Enter the component that you want to monitor.<br />
Sample JDBC settings for Oracle<br />
Driver – oracle.jdbc.driver.OracleDriver<br />
Connect String – jdbc:oracle:thin:@DBserver:1521:orcl<br />
User name – sys<br />
Password – change-on-install<br />
SQL Database System Information<br />
After <strong>OneSight</strong> has discovered a database on a system (or you have<br />
added a database to the system list yourself), you must add the<br />
following information for <strong>OneSight</strong> to monitor the database.<br />
Note: The strings in the examples below are case-sensitive: use the<br />
same case as displayed.<br />
Component Tab – The Component tab shows the name of the<br />
database you are configuring. Changing this name will affect the<br />
database entry on the left side of the System Editor dialog box.<br />
582 <strong>OneSight</strong> <strong>Administrator</strong> <strong>Guide</strong>
Modifying System Definitions<br />
<strong>OneSight</strong> uses JDBC and Perfmon to connect to your SQL Server<br />
database.<br />
JDBC Tab – <strong>OneSight</strong> uses a JDBC driver to connect to your<br />
database. Two examples of such a JDBC driver are:<br />
JDBC-ODBC Bridge (installed as part of <strong>OneSight</strong>)<br />
Note: The SQL Server ODBC driver is installed with MSDE and<br />
Microsoft SQL Server. If you do not have either of these on the<br />
Empirix <strong>OneSight</strong> server and you are using a remotely installed<br />
SQL database for <strong>OneSight</strong>, you need to install the SQL Server<br />
ODBC driver on the <strong>OneSight</strong> machine and set up an ODBC DSN.<br />
The ODBC driver is included with the SQL Server Client utilities.<br />
Inet Sprinta JDBC driver for SQL Server (installed as part of<br />
<strong>OneSight</strong>)<br />
The information you provide here depends on which of these<br />
drivers you are using. For monitoring enterprise level databases, the<br />
Inet Sprinta JDBC driver is recommended.<br />
Driver – Select a driver type from the list: Oracle Thin JDBC driver,<br />
Inet Sprinta JDBC driver for Microsoft SQL Server, Sun<br />
JDBC:ODBC Bridge, or Custom. You must have the appropriate<br />
driver installed on the <strong>OneSight</strong> Server in order to set up a Database<br />
monitor.<br />
Driver String – This information will vary depending on the type of<br />
database that you are monitoring. If you selected any option other<br />
than Custom, the appropriate string is automatically displayed. For<br />
example, this is the string for the Oracle Thin JDBC driver:<br />
oracle.jdbc.driver.OracleDriver<br />
If you selected a Custom driver type, you can type in the Driver<br />
String yourself.<br />
Chapter 7: Configuring Systems 583
Modifying System Definitions<br />
Connect String – For most drivers, this string is constructed from<br />
the information you supply in the following fields. The structure of<br />
the Connect String is different for each driver type, but <strong>OneSight</strong><br />
builds this string for all driver types except a Custom driver type.<br />
For a Custom driver setting, type in the Connect String.<br />
Connection Settings<br />
Host – Specify the host name of the machine running the<br />
database. This is not required for a JDBC:ODBC or Custom driver<br />
setting.<br />
Instance – Specify the database instance.<br />
Port – <strong>OneSight</strong> displays the default port for the driver you<br />
selected. For example, the default port for an Oracle Thin JDBC<br />
driver is 1521. Modify the port number if necessary. This is not<br />
required for a JDBC:ODBC or Custom driver setting.<br />
Database Name or Database SID – For the Inet Sprinta driver for<br />
SQL Server, provide the database name. For the Oracle Thin<br />
JDBC driver, provide the database or server ID.<br />
System DSN – This field applies to the JDBC:ODBC Bridge driver<br />
type only. In the Windows Control Panel, locate the System DSN<br />
in the ODBC Data Sources field to confirm the name of the<br />
database. The connect string will have the following format:<br />
Authentication<br />
jdbc:odbc:<br />
User name – If a user name and password are required for access<br />
to the database, enter the user name here. The user must have<br />
system administrator privileges.<br />
Password – If a user name and password are required for access<br />
to the database, enter the password here.<br />
584 <strong>OneSight</strong> <strong>Administrator</strong> <strong>Guide</strong>
Modifying System Definitions<br />
Sample JDBC settings for SQL Server<br />
Driver – com.inet.tds.TdsDriver<br />
Connect String –<br />
jdbc:inetdae::1433?database=<strong>OneSight</strong><br />
User name – sa<br />
Password – <br />
Perfmon Tab – If you use the profiles for Microsoft SQL Server,<br />
version 6.5 or 7.0 to monitor a database server running either of<br />
those database applications, the <strong>OneSight</strong> Server must be able to<br />
access the server’s Perfmon, and the monitored database server’s<br />
Perfmon must have SQL object counters.<br />
Instance – Type the name of the database to be monitored. To<br />
confirm the database name, use Perfmon on the machine you<br />
want to monitor and select the object type SQL Server to see the<br />
database name instance.<br />
UNIX System Tab – The UNIX System tab is used when configuring<br />
monitors to collect data on UNIX workstations. If the machine you<br />
are configuring as a monitored system is not a UNIX machine, this<br />
tab is unnecessary.<br />
If you are monitoring a UNIX machine, make sure the proper<br />
<strong>OneSight</strong> UNIX Remote Agent is installed. For help installing the<br />
UNIX Remote Agent, see Installing the UNIX Remote Agent in<br />
Chapter 2.<br />
Instance – Enter the name of the database to be monitored.<br />
WMI Tab – Windows Management Instrumentation (WMI) can be<br />
used to provide <strong>OneSight</strong> with in-depth information about the<br />
configuration, status, and operational aspects of your Windows<br />
operating system.<br />
Chapter 7: Configuring Systems 585
Modifying System Definitions<br />
Instance – Enter the component that you want to monitor.<br />
Database Instance System Information<br />
Enter the following information for discovering named instances of<br />
SQL databases.<br />
Component Tab – The Component tab shows the name of the<br />
database you are configuring. Changing this name will affect the<br />
database entry on the left side of the System Editor dialog box.<br />
Perfmon Tab – The Windows NT Performance Monitor (Perfmon)<br />
can be used with <strong>OneSight</strong> to discovery multiple named instances<br />
of SQL databases. To enable <strong>OneSight</strong> to use this information, you<br />
must first start and configure Performance Monitor for your system.<br />
For more information, see Perfmon.<br />
Instance – Enter the instance names separated by a semi-colon.<br />
For example, ABC;DEF.<br />
Database Log File System Information<br />
Currently, the Database log file component type is not used by any<br />
existing profile metric. This component type will be used for<br />
database log files when implemented in future database profiles.<br />
Disk System Information<br />
When you add a new disk component, you must add information to<br />
the Properties tabs to configure the data sources that <strong>OneSight</strong><br />
metrics use to obtain information about the disk.<br />
Note: If you are using Windows 2003/2008 with a firewall, you<br />
must open the SNMP agent port configured on the SNMP tab (the<br />
default is port 161), otherwise discovery may fail.<br />
586 <strong>OneSight</strong> <strong>Administrator</strong> <strong>Guide</strong>
Modifying System Definitions<br />
Component Tab – The Component Tab shows the name of the disk<br />
you are configuring. Changing this name will affect the Disk entry<br />
on the left side of the System Editor dialog box.<br />
Name – In the Name box, specify a meaningful name that allows<br />
you to identify the specific Disk you are adding. For example:<br />
“C:”.<br />
Perfmon Tab – The Windows Performance Monitor (Perfmon) can<br />
be used with <strong>OneSight</strong> to gather resource information for specific<br />
components and program processes throughout your system. To<br />
enable <strong>OneSight</strong> to use this information, you must first start and<br />
configure Performance Monitor for your system. For more<br />
information, see Perfmon.<br />
Instance – Typically, this value is the drive letter plus a colon (:).<br />
For example: “C:”. <strong>OneSight</strong> will not allow you to enter a<br />
lowercase value in this box.<br />
SNMP Tab – Adding information to the Simple Network<br />
Management Protocol (SNMP) tab enables <strong>OneSight</strong> to provide<br />
specific performance and configuration information on network<br />
devices, such as routers, or on hosts, such as workstations or<br />
mainframes.<br />
To use SNMP with <strong>OneSight</strong>, you must enable SNMP on the<br />
machines you intend to monitor. For more information, see the<br />
SNMP System Requirements. The <strong>OneSight</strong> Solaris profile queries<br />
the Sun SNMP agent for Sun’s MIB and the RFC-1213 (MIB-2).<br />
The following options are available on the SNMP tab for the<br />
component type.<br />
Object ID (to override default discovery) – Enter the object ID of<br />
the object you want to discover if it is different than the default<br />
discovery. Click Browse to display the MIB browser for<br />
searching for the object.<br />
Chapter 7: Configuring Systems 587
Modifying System Definitions<br />
Perl Expression – Enter a Perl expression if you want to further<br />
qualify the results returned by the discovery request. Refer to<br />
Using Regular Expressions for Pattern Matching in Chapter 5<br />
for more information about regular expressions.<br />
The following option is available on the SNMP tab for individual<br />
components.<br />
Search for string – This field is automatically filled in as a result<br />
of discovery based on the Object ID and Perl expression that<br />
were entered.<br />
UNIX System Tab – The UNIX System tab is used when configuring<br />
monitors to collect data on UNIX workstations. If the machine you<br />
are configuring as a monitored system is not a UNIX machine, this<br />
tab is unnecessary.<br />
For help installing the UNIX Remote Agent, see Installing the UNIX<br />
Remote Agent in Chapter 2.<br />
Instance – When configuring a UNIX profile, enter the system<br />
disk information using the module.machine.name format. This<br />
information can be gathered using a UNIX kernel statistics utility<br />
(for example, kstat). For example: sd.0.sd0<br />
To configure multiple disk instances, highlight the Disk type and<br />
click Add.<br />
For more information about how to collect statistics using UNIX<br />
system utilities, see the Knowledgebase section on the <strong>OneSight</strong><br />
Support web page.<br />
Virtual Agent Tab – This tab is necessary when you are using a<br />
virtual agent metric and you apply a profile that makes use of the<br />
component.<br />
Instance – Enter the component that you want to monitor.<br />
588 <strong>OneSight</strong> <strong>Administrator</strong> <strong>Guide</strong>
Modifying System Definitions<br />
WMI Tab – Windows Management Instrumentation (WMI) can be<br />
used to provide <strong>OneSight</strong> with in-depth information about the<br />
configuration, status, and operational aspects of your Windows<br />
operating system.<br />
Instance – Enter the component that you want to monitor.<br />
File System Information<br />
When you add a new File System component, you must add<br />
information to the Properties tabs to configure the data sources that<br />
<strong>OneSight</strong> metrics use to obtain information about the file system.<br />
Component Tab – The Component Tab shows the name of the file<br />
system you are configuring. Changing this name will affect the File<br />
System entry on the left side of the System Editor dialog box.<br />
Name – In the Name box, specify a meaningful name that allows<br />
you to identify the specific file system you are adding.<br />
UNIX System Tab – The UNIX System tab is used when configuring<br />
monitors to collect data on UNIX workstations. If the machine you<br />
are configuring as a monitored system is not a UNIX machine, this<br />
tab is unnecessary.<br />
If you are monitoring a UNIX machine, make sure the proper<br />
<strong>OneSight</strong> UNIX Remote Agent is installed. For help installing the<br />
UNIX Remote Agent, see Installing the UNIX Remote Agent in<br />
Chapter 2.<br />
Instance – When configuring a profile for a UNIX machine, enter<br />
the file system information for the machine you are monitoring.<br />
For example: /dev<br />
Information regarding specific mounted file systems for a UNIX<br />
system can be accessed using the df utility on the UNIX shell.<br />
Chapter 7: Configuring Systems 589
Modifying System Definitions<br />
To configure multiple file system instances, highlight the File<br />
System type and click Add.<br />
Virtual Agent Tab – This tab is necessary when you are using a<br />
virtual agent metric and you apply a profile that makes use of the<br />
component.<br />
Instance – Enter the component that you want to monitor.<br />
Interface System Information<br />
When you add a new interface component, you must add<br />
information to the Properties tabs to configure the data sources that<br />
<strong>OneSight</strong> metrics use to obtain information about the interface.<br />
Note: If you are using Windows 2003/2008 with a firewall, you must<br />
open the SNMP agent port configured on the SNMP tab (the default<br />
is port 161), otherwise discovery may fail.<br />
Component Tab – The Component Tab shows the name of the<br />
interface you are configuring. Changing this name will affect the<br />
Interface entry on the left side of the System Editor dialog box.<br />
Name – In the Name box, specify a meaningful name that allows<br />
you to identify the specific interface you are adding.<br />
Perfmon Tab – Currently, the Interface component does not use<br />
Perfmon as a data source. Settings on this tab can be ignored.<br />
Ping Tab – When configuring a profile to monitor a UNIX machine,<br />
the Ping tab must be configured to specify the IP address.<br />
IP Address – Enter the IP address for the interface you are<br />
monitoring.<br />
SNMP Tab – Adding information to the Simple Network<br />
Management Protocol (SNMP) tab enables <strong>OneSight</strong> to provide<br />
specific performance and configuration information on network<br />
590 <strong>OneSight</strong> <strong>Administrator</strong> <strong>Guide</strong>
Modifying System Definitions<br />
devices, such as routers, or on hosts, such as workstations or<br />
mainframes.<br />
To use SNMP with <strong>OneSight</strong>, you must enable SNMP on the<br />
machines you intend to monitor. For more information, see the<br />
SNMP System Requirements. The <strong>OneSight</strong> Solaris profile queries<br />
the Sun SNMP agent for Sun’s MIB and the RFC-1213 (MIB-2).<br />
The following options are available on the SNMP tab for the<br />
component type.<br />
Object ID (to override default discovery) – Enter the object ID of<br />
the object you want to discover if it is different than the default<br />
discovery. Click Browse to display the MIB browser for<br />
searching for the object.<br />
Perl Expression – Enter a Perl expression if you want to further<br />
qualify the results returned by the discovery request. Refer to<br />
Using Regular Expressions for Pattern Matching in Chapter 5<br />
for more information about regular expressions.<br />
The following option is available on the SNMP tab for individual<br />
components.<br />
Search for string – This field is automatically filled in as a result<br />
of discovery based on the Object ID and Perl expression that<br />
were entered.<br />
UNIX System Tab – The UNIX System tab is used when configuring<br />
monitors to collect data on UNIX workstations. If the machine you<br />
are configuring as a monitored system is not a UNIX machine, this<br />
tab is unnecessary.<br />
If you are monitoring a UNIX machine, make sure the proper<br />
<strong>OneSight</strong> UNIX Remote Agent is installed. For help installing the<br />
UNIX Remote Agent, see Installing the UNIX Remote Agent in<br />
Chapter 2.<br />
Chapter 7: Configuring Systems 591
Modifying System Definitions<br />
Instance – When configuring a profile to monitor a UNIX<br />
machine, enter the network device information using the<br />
module.machine.name format. This information is used to identify<br />
a specific device driver on your UNIX system. For example,<br />
device drivers are entered using the following format:<br />
hme.0.hme0<br />
To configure multiple UNIX devices, highlight the Interface type<br />
and click Add.<br />
WMI Tab – Windows Management Instrumentation (WMI) can be<br />
used to provide <strong>OneSight</strong> with in-depth information about the<br />
configuration, status, and operational aspects of your Windows<br />
operating system.<br />
Instance – Enter the component that you want to monitor.<br />
Load Balancer System Information<br />
When you add a new load balancer component, you must add<br />
information to the Properties tabs to configure the data sources that<br />
<strong>OneSight</strong> metrics use to obtain information about the load balancer.<br />
Component Tab – The Component Tab shows the name of the load<br />
balancer you are configuring. Changing this name will affect the<br />
Load Balancer entry on the left side of the System Editor dialog<br />
box.<br />
Name – In the Name box, specify a meaningful name that allows<br />
you to identify the specific load balancer you are adding.<br />
SNMP Tab – Adding information to the Simple Network<br />
Management Protocol (SNMP) tab enables <strong>OneSight</strong> to provide<br />
specific performance and configuration information on network<br />
devices, such as routers, or on hosts, such as workstations or<br />
mainframes.<br />
592 <strong>OneSight</strong> <strong>Administrator</strong> <strong>Guide</strong>
Modifying System Definitions<br />
To use SNMP with <strong>OneSight</strong>, you must enable SNMP on the<br />
machines you intend to monitor. For more information, see the<br />
SNMP System Requirements. The <strong>OneSight</strong> Solaris profile queries<br />
the Sun SNMP agent for Sun’s MIB and the RFC-1213 (MIB-2).<br />
The following option is available on the SNMP tab for the<br />
component type.<br />
Object ID – Enter the object ID of the object you want to discover.<br />
The following option is available on the SNMP tab for individual<br />
components.<br />
Search for string – This field is automatically filled in as a result<br />
of discovery based on the Object ID and Perl expression that<br />
were entered.<br />
Service System Information<br />
When you add a new service component, you must add information<br />
to the Properties tabs to configure the data sources that <strong>OneSight</strong><br />
metrics use to obtain information about the service.<br />
Component Tab – The Component Tab shows the name of the<br />
service you are configuring. Changing this name will affect the<br />
Service entry on the left side of the System Editor dialog box.<br />
Name – In the Name box, specify a meaningful name that allows<br />
you to identify the specific service you are adding.<br />
Service Tab – The Service tab shows the name of the service you<br />
want to monitor.<br />
Service Name – Enter the name of the service you want to<br />
monitor.<br />
Chapter 7: Configuring Systems 593
Modifying System Definitions<br />
System Properties Information<br />
When you add a new system, you must add information to the<br />
Properties tabs to configure the data sources that <strong>OneSight</strong> metrics<br />
use to obtain information about the system.<br />
Note: If you are using Windows 2003/2008 with a firewall, you<br />
must open the SNMP agent port configured on the SNMP tab (the<br />
default is port 161), otherwise discovery may fail.<br />
System Tab – The System Tab specifies the IP address and<br />
operating system of the machine you are configuring.<br />
Device Type – Specify the type of device. This specification affects<br />
licensing and which profiles and metrics can be applied to the system.<br />
Metrics are categorized into three types. Basic metrics measure basic<br />
operating system performance such as CPU, Disk, etc. and cannot be<br />
modified. Premium metrics are metrics defined by the contact center<br />
and cannot be modified. All other metrics are advanced metrics. The<br />
options are:<br />
Advanced Server – All profiles can be applied to this system. If<br />
you are using premium metrics, you must define the system as an<br />
advanced server. Each profile applied to this system consumes one<br />
advanced server license. In addition, each premium profile<br />
applied to this system consumes both an advanced server<br />
license and a premium profile license.<br />
Basic Server – Only basic profiles such as Windows, Linux,<br />
Solaris, Unix, etc., can be applied to this system. The license<br />
consumed is per system, not per profile.<br />
Network Device – Only profiles with Ping or SNMP metrics can<br />
be applied to this system, otherwise a licensing error will occur.<br />
The license consumed is per system regardless of the number of<br />
profiles applied.<br />
594 <strong>OneSight</strong> <strong>Administrator</strong> <strong>Guide</strong>
Modifying System Definitions<br />
DNS Name – Specify the DNS name of the system. By default, this<br />
information is replicated as the NetBIOS Name, described below.<br />
IP Address – Specify the IP address of the system.<br />
NetBIOS Name – In most cases, the NetBIOS name and the DNS<br />
name are the same. <strong>OneSight</strong> assumes the setting for the DNS<br />
name should also be used for the NetBIOS name. If there is a<br />
difference, systems that use Perfmon as the data source cannot be<br />
monitored. Check the NetBIOS name on the machine you want to<br />
monitor (in the Network properties Identification tab, this is the<br />
Computer Name) to determine if the DNS name and the NetBIOS<br />
name are different.<br />
Operating System – Specify the type of operating system that is<br />
running on the machine.<br />
Location – Specifies the Data Collector Location from which to<br />
check the profile monitor. Select the location for this monitor<br />
from the list.<br />
On Failure – Indicates whether to include additional information<br />
in an alert when the system fails.<br />
Include Traceroute in alert – Includes a trace route in the alert.<br />
Include Ping in alert – Includes the results of a ping in the<br />
alert. This option is faster than including the trace route in<br />
the alert.<br />
Do Nothing – Does not include any additional information in<br />
the alert.<br />
System Response Plan – The following fields define a response plan<br />
associated with this system. The system plan applies to profile<br />
metrics only and overrides the profile alert’s plan. If the alert has an<br />
action plan of , the system plan is ignored.<br />
Chapter 7: Configuring Systems 595
Modifying System Definitions<br />
When in Warning State Respond by – Specify how you want to<br />
respond when the profile metric enters a Warning state by<br />
selecting an action plan from the list. Options displayed in this<br />
list represent previously configured plans. To create a new plan<br />
for this condition, select from the list.<br />
When in Critical State Respond by – Specify how you want to<br />
respond when the profile metric enters a Critical state by<br />
selecting an action plan from the list. Options displayed in this<br />
list represent previously configured plans. To create a new plan<br />
for this condition, select from the list.<br />
When Returning to Good State Respond by – Specify how you<br />
want to respond when the profile metric returns to a Good state<br />
by selecting an action plan from the list. Options displayed in this<br />
list represent previously configured plans. To create a new plan<br />
for this condition, select from the list.<br />
SNMP Tab – Adding information to the Simple Network<br />
Management Protocol (SNMP) tab enables <strong>OneSight</strong> to provide<br />
specific performance and configuration information on network<br />
devices, such as routers, or on hosts, such as workstations or<br />
mainframes.<br />
To use SNMP with <strong>OneSight</strong>, you must enable SNMP on the<br />
machines you intend to monitor. The <strong>OneSight</strong> Solaris profile<br />
queries the Sun SNMP agent for Sun’s MIB and the RFC-1213 (MIB-<br />
2). For the Netscape Enterprise Server profile, <strong>OneSight</strong> uses the<br />
Netscape HTTP Server MIB in addition to the Sun MIB.<br />
For more information on how to configure the Netscape SNMP<br />
agent to coexist with the Sun SNMP agent, refer to Netscape<br />
documentation.<br />
Community – Specifies the SNMP password of the system.<br />
Timeout Seconds – Specifies the amount of time (in seconds) to<br />
wait for an SNMP reply. If Timeout Retries is greater than 0 and a<br />
596 <strong>OneSight</strong> <strong>Administrator</strong> <strong>Guide</strong>
Modifying System Definitions<br />
reply is not received, a retry attempt is made. For each<br />
subsequent retry, the timeout value is doubled. For example, if<br />
Timeout Seconds is 5 and Timeout Retries is 2, the first request<br />
attempt will occur after 5 seconds, the second attempt will occur<br />
after 10 seconds, and the third attempt will occur after 20<br />
seconds. In this example, the total timeout period equals 35<br />
seconds. If there is no response after this time, a Sample Failure<br />
is triggered.<br />
If Timeout Retries is 0, a Sample Failure is triggered when a<br />
reply is not received in this amount of time.<br />
Timeout Retries – Sets the upper limit for the number of times an<br />
SNMP request is retried. For example, if Timeout Retries is set to<br />
3, the SNMP request will be sent up to four times (the initial try<br />
plus three retries).<br />
Port – Specifies the port number used on this system by the<br />
SNMP agent. Typically, this is port 161.<br />
Version – Specifies the SNMP version.<br />
SNMP Trap Tab<br />
Community - Specifies the community string for filtering traps.<br />
The default is public.<br />
Virtual Agent Tab – Adding information to the Virtual Agent tab<br />
enables <strong>OneSight</strong> to provide specific metrics and configuration<br />
information for the operating system (specified on the System tab)<br />
on the machine. The Virtual Agent settings in the System editor<br />
also provide the default values for the system when adding Virtual<br />
Agent data sources to a Profile monitor.<br />
Connection Method – Select the connection method to use for the<br />
Virtual Agent.<br />
Port – Specify the port to use to for the Virtual Agent connection.<br />
Chapter 7: Configuring Systems 597
Modifying System Definitions<br />
Prompt – Specify the command line prompt for the host machine.<br />
If you do not specify a command line prompt, <strong>OneSight</strong> will<br />
attempt to infer the prompt by parsing the screen output.<br />
Charset – Specifies the character set to use. Select a character set<br />
from the list.<br />
Operating System – Select the operating system of the host<br />
system.<br />
User Name – Specify a user name to log into an account on the<br />
host system.<br />
Password – Specify the password required to log into the User<br />
Name account on the system.<br />
Private key file – Specify the private key file to use for<br />
authentication when the connection method is SSH. This method<br />
is used in place of user name and password and requires that the<br />
equivalent public key file be installed on the remote system that<br />
you are logging in to.<br />
Login Timeout (ms) – Specify the length of time to wait before<br />
timing out when logging in.<br />
Discovery Timeout (ms) – Specify the length of time to wait<br />
before timing out when performing discovery.<br />
JMX Tab – Adding information to the JMX tab enables <strong>OneSight</strong> to<br />
provide specific performance and configuration information on JMX<br />
MBeans.<br />
JMX App name – The name of the JMX application. Valid entries<br />
are those listed or a user-created name in the Data Collector’s<br />
OSDC.properties file.<br />
Port – The port number of the JMX application’s JNDI server.<br />
598 <strong>OneSight</strong> <strong>Administrator</strong> <strong>Guide</strong>
Modifying System Definitions<br />
Authorization Required – Select true to enter authentication<br />
information.<br />
User Name – The username for accessing the JNDI server.<br />
Password – The password for accessing the JNDI server.<br />
Trust Store Filename – Enter the client-side trust store path and<br />
file name. This file should be in the datacollector directory.<br />
Trust Store Password – Enter the trust store file password.<br />
Key Store Filename – Enter the client-side key store path and file<br />
name. This file should be in the datacollector directory.<br />
Key Store Password – Enter the key store file password.<br />
Windows NT Tab – Adding information to the Windows NT tab<br />
enables <strong>OneSight</strong> to provide specific performance and<br />
configuration information on Windows NT machines.<br />
User Name – Enter the user name for a system account that has<br />
rights to read the NT Windows Registry.<br />
Password – Specify the password required by the system when<br />
logging in with the user name specified in the User Name box.<br />
Domain – Specify the domain name of the Windows NT machine.<br />
Attributes Tab Settings – Attributes are used in <strong>OneSight</strong> to sort the<br />
monitors, monitor groups, profiles, and systems on the status page.<br />
You can assign custom attribute values to specific monitors and use<br />
the Group by selection on the status page to show only those<br />
monitors, monitor groups, profiles, or systems assigned to a specific<br />
attribute set.<br />
To apply attributes to more than one system at a time, use the<br />
Assignment tab on the Attributes page.<br />
Chapter 7: Configuring Systems 599
Modifying System Definitions<br />
All Attributes – Shows the name of the attribute set and its<br />
attribute values.<br />
Selected Attributes – Shows the list of attribute values applied to<br />
this system. Use the Add and Remove arrow buttons to customize<br />
the list of attribute values applied to the monitor, monitor group,<br />
profile, or system.<br />
Attribute Editor – Opens the Attribute Editor for adding and<br />
deleting attributes and attribute values.<br />
Access Control Tab – The Access Control tab lets you specify which<br />
user groups can read, write, or delete this system.<br />
User Group – Displays the user group names.<br />
Owner – The user group for this system. A system can be directly<br />
owned by a user group.<br />
Global Read – Gives read access to this user group and all of its<br />
sub user groups.<br />
Read – Gives read permission to the user group.<br />
Write – Gives write permission to the user group.<br />
Delete – Gives delete permission to the user group.<br />
Port System Information<br />
When you add a new Port component, you must add information to<br />
the Properties tabs to configure the data sources that <strong>OneSight</strong><br />
metrics use to obtain information about the Port.<br />
Note: If you are using Windows 2003/2008 with a firewall, you<br />
must open the ports in the port list, otherwise discovery may fail.<br />
600 <strong>OneSight</strong> <strong>Administrator</strong> <strong>Guide</strong>
Modifying System Definitions<br />
Component Tab – The Component Tab shows the name of the Port<br />
you are configuring. Changing this name will affect the Port entry<br />
on the left side of the System Editor dialog box.<br />
Name – In the Name box, specify a meaningful name that allows<br />
you to identify the specific Port you are adding.<br />
Port Tab – A Port monitor checks on the availability of a specified<br />
network port. While checking network port availability, the port<br />
monitor can also check the value returned from a query to ensure<br />
that an application is available and running correctly. If a port does<br />
not reply, or if the reply is incorrect (as determined by a text<br />
match), an alert is triggered. The Port monitor can be used to<br />
monitor network applications that are not available as part of other<br />
<strong>OneSight</strong> monitors.<br />
The monitor must have appropriate privileges to access the<br />
specified port on the monitored machine.<br />
Port – Specifies the port you want to monitor.<br />
Process System Information<br />
Currently, the Process component type is not used by any existing<br />
profile metric. If you performed a <strong>OneSight</strong> Find System<br />
Components operation, process information is added to the list of<br />
components present on the system. At this time, this is simply for<br />
informational purposes.<br />
Note: If you are using Windows 2003/2008 with a firewall, you<br />
must open the SNMP agent port configured on the SNMP tab (the<br />
default is port 161), otherwise discovery may fail.<br />
Component Tab – The Component Tab shows the name of the<br />
process you are configuring. Changing this name will affect the<br />
Process entry on the left side of the System Editor dialog box.<br />
Chapter 7: Configuring Systems 601
Modifying System Definitions<br />
Name – In the Name box, specify a meaningful name that allows<br />
you to identify the specific process you are adding.<br />
Perfmon Tab – The Windows NT Performance Monitor (Perfmon)<br />
can be used with <strong>OneSight</strong> to gather resource information for<br />
specific components and program processes throughout your<br />
system. To enable <strong>OneSight</strong> to use this information, you must first<br />
start and configure Performance Monitor for your system.<br />
Instance – Specify the process name. To find the name, see the<br />
NT Performance Monitor.<br />
Process Tab<br />
Instance – Specify the process name.<br />
SNMP Tab – Adding information to the Simple Network<br />
Management Protocol (SNMP) tab enables <strong>OneSight</strong> to provide<br />
specific performance and configuration information on network<br />
devices, such as routers, or on hosts, such as workstations or<br />
mainframes.<br />
To use SNMP with <strong>OneSight</strong>, you must enable SNMP on the<br />
machines you intend to monitor. For more information, see the<br />
SNMP System Requirements. The <strong>OneSight</strong> Solaris profile queries<br />
the Sun SNMP agent for Sun’s MIB and the RFC-1213 (MIB-2).<br />
The following options are available on the SNMP tab for the<br />
component type.<br />
Object ID (to override default discovery) – Enter the object ID of<br />
the object you want to discover if it is different than the default<br />
discovery. Click Browse to display the MIB browser for<br />
searching for the object.<br />
Perl Expression – Enter a Perl expression if you want to further<br />
qualify the results returned by the discovery request. Refer to<br />
602 <strong>OneSight</strong> <strong>Administrator</strong> <strong>Guide</strong>
Modifying System Definitions<br />
Using Regular Expressions for Pattern Matching in Chapter 5<br />
for more information about regular expressions.<br />
The following option is available on the SNMP tab for individual<br />
components.<br />
Search for string – This field is automatically filled in as a result<br />
of discovery based on the Object ID and Perl expression that<br />
were entered.<br />
UNIX System Tab – The UNIX System tab is used when configuring<br />
monitors to collect data on UNIX workstations. If the machine you<br />
are configuring as a monitored system is not a UNIX machine, this<br />
tab is unnecessary.<br />
If you are monitoring a UNIX machine, make sure the proper<br />
<strong>OneSight</strong> UNIX Remote Agent is installed. For help installing the<br />
UNIX Remote Agent, see Installing the UNIX Remote Agent in<br />
Chapter 2.<br />
Instance – Specify the process to monitor. This value can be<br />
anything running as a process on the UNIX operating system. For<br />
example, the process ID for a Netscape web server is ns-httpd.<br />
The process ID for an Apache web server is httpd. Use the UNIX<br />
process status (ps) command to determine what processes are<br />
currently running.<br />
Virtual Agent Tab – This tab is necessary when you are using a<br />
virtual agent metric and you apply a profile that makes use of the<br />
component.<br />
Instance – Enter the component that you want to monitor.<br />
WMI Tab – Windows Management Instrumentation (WMI) can be<br />
used to provide <strong>OneSight</strong> with in-depth information about the<br />
configuration, status, and operational aspects of your Windows<br />
operating system.<br />
Chapter 7: Configuring Systems 603
Modifying System Definitions<br />
Instance – Enter the component that you want to monitor.<br />
VM System Information<br />
When you add a new VMWare component, you must add<br />
information to the Properties tabs to configure the data sources that<br />
<strong>OneSight</strong> metrics use to obtain information about VMWare.<br />
Component Tab – The Component Tab shows the name of the VM<br />
you are configuring. Changing this name will affect the Process<br />
entry on the left side of the System Editor dialog box.<br />
Name – In the Name box, specify a meaningful name that allows<br />
you to identify the specific VM you are adding.<br />
SNMP Tab – Adding information to the Simple Network<br />
Management Protocol (SNMP) tab enables <strong>OneSight</strong> to provide<br />
specific performance and configuration information on network<br />
devices, such as routers, or on hosts, such as workstations or<br />
mainframes.<br />
To use SNMP with <strong>OneSight</strong>, you must enable SNMP on the<br />
machines you intend to monitor. For more information, see the<br />
SNMP System Requirements. The <strong>OneSight</strong> Solaris profile queries<br />
the Sun SNMP agent for Sun’s MIB and the RFC-1213 (MIB-2).<br />
The following options are available on the SNMP tab for the<br />
component type.<br />
Object ID (to override default discovery) – Enter the object ID of<br />
the object you want to discover if it is different than the default<br />
discovery. Click Browse to display the MIB browser for<br />
searching for the object.<br />
Perl Expression – Enter a Perl expression if you want to further<br />
qualify the results returned by the discovery request. Refer to<br />
Using Regular Expressions for Pattern Matching in Chapter 5<br />
for more information about regular expressions.<br />
604 <strong>OneSight</strong> <strong>Administrator</strong> <strong>Guide</strong>
Modifying System Definitions<br />
The following option is available on the SNMP tab for individual<br />
components.<br />
Search for string – This field is automatically filled in as a result<br />
of discovery based on the Object ID and Perl expression that<br />
were entered.<br />
VMProcess System Information<br />
When you add a new VMProcess component, you must add<br />
information to the Properties tabs to configure the data sources that<br />
<strong>OneSight</strong> metrics use to obtain information about the VM<br />
processes.<br />
Component Tab – The Component Tab shows the name of the<br />
VMWare process you are configuring. Changing this name will<br />
affect the VMProcess entry on the left side of the System Editor<br />
dialog box.<br />
Name – In the Name box, specify a meaningful name that allows<br />
you to identify the specific VMWare process you are adding.<br />
SNMP Tab – Adding information to the Simple Network<br />
Management Protocol (SNMP) tab enables <strong>OneSight</strong> to provide<br />
specific performance and configuration information on network<br />
devices, such as routers, or on hosts, such as workstations or<br />
mainframes.<br />
To use SNMP with <strong>OneSight</strong>, you must enable SNMP on the<br />
machines you intend to monitor. For more information, see the<br />
SNMP System Requirements. The <strong>OneSight</strong> Solaris profile queries<br />
the Sun SNMP agent for Sun’s MIB and the RFC-1213 (MIB-2).<br />
The following options are available on the SNMP tab for the<br />
component type.<br />
Object ID (to override default discovery) – Enter the object ID of<br />
the object you want to discover if it is different than the default<br />
Chapter 7: Configuring Systems 605
Modifying System Definitions<br />
discovery. Click Browse to display the MIB browser for<br />
searching for the object.<br />
Perl Expression – Enter a Perl expression if you want to further<br />
qualify the results returned by the discovery request. Refer to<br />
Using Regular Expressions for Pattern Matching in Chapter 5<br />
for more information about regular expressions.<br />
The following option is available on the SNMP tab for individual<br />
components.<br />
Search for string – This field is automatically filled in as a result<br />
of discovery based on the Object ID and Perl expression that<br />
were entered.<br />
Web Server System Information<br />
When you add a new web server component, you must add<br />
information to the Properties tabs to configure the data sources that<br />
<strong>OneSight</strong> metrics use to obtain information about the web server.<br />
Note: If you are using Windows 2003/2008 with a firewall, you<br />
must open the SNMP agent port configured on the SNMP tab (the<br />
default is port 161), otherwise discovery may fail.<br />
Component Tab – The Component Tab shows the name of the web<br />
server you are configuring. Changing this name will affect the Web<br />
Server entry on the left side of the System Editor dialog box.<br />
Name – In the Name box, specify a meaningful name that allows<br />
you to identify the specific web server you are adding.<br />
Home Page Tab – The Home Page tab must be configured to specify<br />
the IP address of the machine hosting the web server and the port<br />
used by the web server.<br />
IP Address – Enter the IP address of the machine hosting the web<br />
server you are monitoring.<br />
606 <strong>OneSight</strong> <strong>Administrator</strong> <strong>Guide</strong>
Modifying System Definitions<br />
Port – Enter the port number used by the web server you are<br />
monitoring.<br />
Secure – Select True if the server you are adding is a secure<br />
server.<br />
Specify an HTTP Host Header – Select True if you want to define<br />
an HTTP Host Header. When selected, the monitor uses the IP<br />
Address specified in the URL Address and the header specified in<br />
the HTTP Host Header field. When cleared, the monitor uses the<br />
host specified in the URL Address field. Use this option if you<br />
have a single IP that hosts multiple web sites.<br />
HTTP Host Header – Specify the value to look for in the Host:<br />
field in the HTTP Get Request. For example, if you host web sites<br />
www.mywebsite.com and www.myotherwebsite.com using IP<br />
address 255.255.001.001, specify http://255.255.001.001 as the<br />
URL Address and www.mywebsite.com or<br />
www.myotherwebsite.com as the HTTP Host Header value.<br />
Perfmon Tab – Information on the Web Server Perfmon tab is used<br />
by the IIS profiles only.<br />
The Windows NT Performance Monitor (Perfmon) can be used with<br />
<strong>OneSight</strong> to gather resource information for specific components<br />
and program processes throughout your system. To enable<br />
<strong>OneSight</strong> to use this information, you must first start and configure<br />
Performance Monitor for your system.<br />
Instance – This value is typically “Default Web Server”.<br />
SNMP Tab – Information on the Web Server SNMP tab is used by<br />
the Netscape profile only.<br />
Adding information to the Simple Network Management Protocol<br />
(SNMP) tab enables <strong>OneSight</strong> to provide specific performance and<br />
configuration information on network devices, such as routers, or<br />
on hosts, such as workstations or mainframes.<br />
Chapter 7: Configuring Systems 607
Adding System Components<br />
To use SNMP with <strong>OneSight</strong>, you must enable SNMP on the<br />
machines you intend to monitor. The <strong>OneSight</strong> Solaris profile<br />
queries the Sun SNMP agent for Sun’s MIB and the RFC-1213 (MIB-<br />
2). For the Netscape Enterprise Server profile, <strong>OneSight</strong> uses the<br />
Netscape HTTP Server MIB in addition to the Sun MIB.<br />
For more information on how to configure the Netscape SNMP<br />
agent to coexist with the Sun SNMP agent, refer to Netscape<br />
documentation.<br />
Search for string – Enter the port number for the web server you<br />
are monitoring or a regular expression. Refer to Using Regular<br />
Expressions for Pattern Matching in Chapter 5 for more<br />
information about regular expressions.<br />
UNIX System Tab – The UNIX System tab is used when configuring<br />
monitors to collect data on UNIX workstations. If the machine you<br />
are configuring as a monitored system is not a UNIX machine, this<br />
tab is unnecessary.<br />
For help installing the UNIX Remote Agent, see Installing the UNIX<br />
Remote Agent in Chapter 2.<br />
Instance – Enter the server instance.<br />
WMI Tab – Windows Management Instrumentation (WMI) can be<br />
used to provide <strong>OneSight</strong> with in-depth information about the<br />
configuration, status, and operational aspects of your Windows<br />
operating system.<br />
Instance – Enter the component that you want to monitor.<br />
Adding System Components<br />
Information about the components on each system must be<br />
identified so that <strong>OneSight</strong> profiles can be used to create monitors<br />
for the web components running on those machines. The Add<br />
608 <strong>OneSight</strong> <strong>Administrator</strong> <strong>Guide</strong>
Adding System Components<br />
System Component dialog box allows you to manually define the<br />
system components that you want to monitor.<br />
After adding a system component, you need to configure the data<br />
sources that gather information for the profile metrics that monitor<br />
that component. In the System Editor, select the component that you<br />
added and fill in the settings on the Properties tabs.<br />
Adding Components Manually<br />
Profile monitors need information about the components present on<br />
each system that they monitor. Use this method to manually add a<br />
system component to an existing system definition.<br />
To add system components manually:<br />
1. Open the System Editor.<br />
Chapter 7: Configuring Systems 609
Adding System Components<br />
2. In the Components box, click a component and then click Add,<br />
which opens the Add System Component dialog box.<br />
Add type – Select the type of component you are adding to<br />
display the fields associated with the selected type.<br />
Component Type – Select this option to add a new component<br />
type. This is the only option available from the system node.<br />
Component – Select this option to add components for the<br />
selected component type.<br />
Component Type Definition<br />
Name – Specify a meaningful name that allows you to<br />
identify the specific component type you are adding.<br />
Description – Type a description that helps you differentiate<br />
this component type from the other component types you are<br />
defining to monitor your web components.<br />
Component Definition<br />
610 <strong>OneSight</strong> <strong>Administrator</strong> <strong>Guide</strong>
Adding System Components<br />
Component type – The type list defaults to the kind of<br />
component that was selected when you clicked the Add<br />
button to open the Add System Component dialog box. Select<br />
the type of component you want to add and configure.<br />
Component – Specify a meaningful name that allows you to<br />
identify the specific component you are adding. You can add<br />
multiple instances of a component using the following<br />
syntax:<br />
name[[[numbers…numbers]]]<br />
For example, e[[[8..10]]] creates the following<br />
components: e8, e9, and e10.<br />
Data Sources to Add – The data sources applicable to the type of<br />
component you are adding are listed. Select the data sources<br />
that you want to use. When you click OK the associated tabs are<br />
displayed so that you can configure the selected data sources.<br />
3. The Type list defaults to the kind of component you are adding.<br />
In the Name box, specify a meaningful name that allows you to<br />
identify the specific component you are adding. Then click OK<br />
to return to the System Editor.<br />
4. The newly added component appears in the Components list<br />
(for example, if you add a disk component named “C:”, it is<br />
added under Disk). Select this component in the Components<br />
list and click Add Data Source to display the options you need to<br />
fill out in order to configure the data sources that <strong>OneSight</strong><br />
metrics use to obtain information about this system component.<br />
5. After supplying information about the new system component,<br />
click OK to update the system.<br />
Chapter 7: Configuring Systems 611
Adding System Components<br />
Adding Components Automatically<br />
Profile monitors need information about the components present on<br />
each system that they are configured to watch. You can direct<br />
<strong>OneSight</strong> to find system components (such as disk drives,<br />
processes, and web servers) and add them to the system definition.<br />
For this to work correctly, you must first enable the data sources<br />
used by the auto-find process.<br />
Note: It is preferable to define system components while adding a<br />
profile monitor. When you add a profile monitor to a machine,<br />
<strong>OneSight</strong> prompts you to add any missing system components that<br />
are tracked by that monitor.<br />
The process that automatically finds system components can use<br />
SNMP, Process monitor, Perfmon (remote or local) and the UNIX<br />
Remote Agent to identify processes and devices. Refer to Adding a<br />
Data Source in Chapter 6.<br />
612 <strong>OneSight</strong> <strong>Administrator</strong> <strong>Guide</strong>
Adding System Components<br />
To automatically add system components to an existing system<br />
definition:<br />
1. Open the System Editor.<br />
Chapter 7: Configuring Systems 613
Adding System Components<br />
2. Click Discover Components. The Discover Components<br />
Configuration dialog box opens where you specify what<br />
methods should be used to find out about the components<br />
present on the selected computer system.<br />
Check All – Selects all discovery methods.<br />
Uncheck All – Deselects all discovery methods.<br />
Discover Components Using – Select the discovery methods that<br />
you want to use to discover components.<br />
Advanced – Displays the Advanced Discovery Editor for<br />
selecting the component types to find. This may be necessary<br />
when you have a component type that only works for Solaris<br />
and a Windows system is doing discovery.<br />
614 <strong>OneSight</strong> <strong>Administrator</strong> <strong>Guide</strong>
Adding System Components<br />
3. Click Advanced if you want to select which components to<br />
discovery.<br />
4. Select the components that you do not want to discover and<br />
click the right arrows to add them to the Ignore component types<br />
list.<br />
5. Click OK when you are done.<br />
6. Select one or more methods to use to find out about the<br />
components present on the selected computer system. The<br />
Setup Discovery dialog box is displayed.<br />
Chapter 7: Configuring Systems 615
Adding System Components<br />
Note: When discovery is performed, <strong>OneSight</strong> notes the type of<br />
system. The next time you discover, only those methods<br />
appropriate for the type of system are available in the Discover<br />
Components dialog box. For example, if the system is a<br />
Windows system, UNIX or Virtual Agent will not be listed. To<br />
reset the dialog box to show all methods, set the Operating<br />
System field to Unknown.<br />
Use options in the Find Components Configuration dialog box<br />
to configure the data sources to be used to find out about the<br />
components on the selected computer systems.<br />
SNMP – SNMP finds interfaces by using RFC 1213 (MIB II). To<br />
use SNMP to find processes and hardware, the system must<br />
support the Host Resources MIB.<br />
Community – Specify the SNMP community string used for<br />
the machine you want SNMP to examine. For many devices,<br />
the default community string is public.<br />
Timeout seconds – Specifies the amount of time (in seconds)<br />
to wait for an SNMP reply. If Timeout Retries is greater than<br />
0 and a reply is not received, a retry attempt is made. For<br />
616 <strong>OneSight</strong> <strong>Administrator</strong> <strong>Guide</strong>
Adding System Components<br />
each subsequent retry, the timeout value is doubled. For<br />
example, if Timeout Seconds is 5 and Timeout Retries is 2,<br />
the first request attempt will occur after 5 seconds, the<br />
second attempt will occur after 10 seconds, and the third<br />
attempt will occur after 20 seconds. In this example, the total<br />
timeout period equals 35 seconds. If there is no response<br />
after this time, a Sample Failure is triggered.<br />
If Timeout Retries is 0, a Sample Failure is triggered when a<br />
reply is not received in this amount of time.<br />
Timeout retries – Sets the upper limit for the number of times<br />
an SNMP request is retried. For example, if Timeout Retries<br />
is set to 3, the SNMP request will be sent up to four times (the<br />
initial try plus three retries).<br />
Port – Specifies the port number used on this system by the<br />
SNMP agent. Typically, this is port 161.<br />
Version – Specifies the SNMP version.<br />
Virtual Agent Connection Settings<br />
Connection Method – Select the connection method to use for<br />
the Virtual Agent.<br />
Port – Specify the port to use for connecting.<br />
Prompt – Specify the command line prompt for the host<br />
machine. If you do not specify a command line prompt,<br />
<strong>OneSight</strong> will attempt to infer the prompt by parsing the<br />
screen output.<br />
Charset – Specifies the character set to use. Select a character<br />
set from the list.<br />
ISO-8859-1 – Latin alphabet for Western European<br />
languages such as Basque, Catalan, Danish, Dutch,<br />
Chapter 7: Configuring Systems 617
Adding System Components<br />
English, Faeroese, Finnish, French, German, Icelandic,<br />
Irish, Italian, Norwegian, Portuguese, Rhaeto-Romanic,<br />
Scottish, Spanish, Swedish, Albanian, Afrikaans, and<br />
Swahili.<br />
ISO-8859-13 – Baltic Rim languages.<br />
ISO-8859-15 – Latin alphabet for Western European<br />
languages.<br />
ISO-8859-2 – Central and Eastern European languages that<br />
use a Roman alphabet, including Polish, Czech, Slovak,<br />
Slovenian, and Hungarian.<br />
ISO-8859-4 – Latin alphabet for Estonian, Latvian,<br />
Lithuanian, Greenlandic, and Sami.<br />
ISO-8859-5 – Most Slavic languages that use a Cyrillic<br />
alphabet including Belarusian, Bulgarian, Macedonian,<br />
Russian, Serbian, and Ukranian.<br />
ISO-8859-7 – Greek.<br />
ISO-8859-9 – Latin alphabet for Western European<br />
languages, similar to ISO 8859-1 with the Icelandic<br />
letters replaced with Turkish letters. It is also used for<br />
Kurdish.<br />
K018-R – Cyrillic<br />
US-ASCII – United States.<br />
UTF-16 – Unicode 16 bit.<br />
UTF-16BE – Unicode big-endian.<br />
UTF-16LE – Unicode little-endian.<br />
UTF-8 – Unicode 8 bit mostly used for HTML.<br />
618 <strong>OneSight</strong> <strong>Administrator</strong> <strong>Guide</strong>
Adding System Components<br />
Windows 1250 – Microsoft Windows Code Page for<br />
Central European Latin alphabet languages.<br />
Windows 1251 – Microsoft Windows Code Page for<br />
Russian and other Cyrillic languages.<br />
Windows 1252 – Microsoft Windows Code Page for<br />
Western European languages.<br />
Windows 1253 – Microsoft Windows Code Page for<br />
Greek.<br />
Windows 1254 – Microsoft Windows Code Page for<br />
Turkish.<br />
Windows 1257 – Microsoft Windows Code Page for<br />
Baltic.<br />
Cp500 – EBCDIC 500 VI.<br />
Operating System – Specify the type of operating system.<br />
Authentication<br />
User Name – Specify a user name to log into an account on<br />
the host system.<br />
Password – Specify the password required to log into the<br />
User Name account on the system.<br />
Private Key File – Enter the name of the private key file.<br />
Advanced<br />
Login Timeout (ms) – Specify the number of milliseconds to<br />
wait before timing out when logging in.<br />
Discovery Timeout (ms) – Specify the number of milliseconds<br />
to wait before timing out when doing discovery.<br />
Chapter 7: Configuring Systems 619
Adding System Components<br />
Login Procedure – Select the state machine containing the<br />
XML for logging in. This is useful, for example, when you<br />
are logging into one machine and then logging in to another<br />
machine. Refer to “Configuring State Machines,” in Chapter<br />
5 for more information.<br />
Windows NT<br />
User name – Enter the user name for a system account that<br />
has rights to read the NT Windows Registry.<br />
Password – Specify the password required by the system<br />
when logging in with the user name specified in the User<br />
Name box.<br />
Domain – Specify the domain name of the Windows NT<br />
machine.<br />
JMX<br />
JMX App name – The name of the JMX application. Valid<br />
entries are those listed or a user-created name in the Data<br />
Collector’s OSDC.properties file.<br />
Port – The port number of the JMX application’s JNDI server.<br />
Authorization Required – Select true to enter authentication<br />
information.<br />
User Name – The username for accessing the JNDI server.<br />
Password – The password for accessing the JNDI server.<br />
Trust Store Filename – Enter the client-side trust store path<br />
and file name. This file should be in the datacollector<br />
directory.<br />
Trust Store Password – Enter the trust store file password.<br />
620 <strong>OneSight</strong> <strong>Administrator</strong> <strong>Guide</strong>
Adding System Components<br />
Key Store Filename – Enter the client-side key store path and<br />
file name. This file should be in the datacollector directory.<br />
Key Store Password – Enter the key store file password.<br />
7. Enter the discovery configuration information and click OK.<br />
8. When the process completes, click OK.<br />
To automatically find system components when<br />
you add a new system:<br />
1. Click the Configure menu.<br />
2. Select Systems.<br />
Chapter 7: Configuring Systems 621
Adding System Components<br />
3. Click Add to open the Add System dialog box.<br />
4. Specify the machine name or IP address of the system to be<br />
added and click OK.<br />
5. Click Discover Components to open the Discover Components<br />
Configuration dialog box where you specify what methods<br />
should be used to find out about the components present on the<br />
selected computer system.<br />
622 <strong>OneSight</strong> <strong>Administrator</strong> <strong>Guide</strong>
Adding System Components<br />
6. Select one or more methods to use to find out about the<br />
components present on the selected computer system. The<br />
Setup Discovery dialog box is displayed.<br />
7. Enter the discovery configuration information and click OK.<br />
8. When the process completes, click OK.<br />
Discovering Multiple Systems<br />
You can discover the components to monitor on multiple systems at<br />
one time. This is useful after you have imported multiple systems<br />
into <strong>OneSight</strong>. Existing components that are not detected by<br />
discovery are not removed during this process.<br />
Note: the systems being discovered must have the same type of<br />
operating system. For example, they must be all Windows machines<br />
or all Linux machines.<br />
To discover multiple systems:<br />
1. Click the Configure menu.<br />
2. Select Systems.<br />
Chapter 7: Configuring Systems 623
Adding System Components<br />
3. Click Multiple System Discover.<br />
4. Select one or more methods to use to find out about the<br />
components present on the systems and click OK. The Setup<br />
Discovery dialog box is displayed.<br />
624 <strong>OneSight</strong> <strong>Administrator</strong> <strong>Guide</strong>
Adding System Components<br />
5. Enter the properties for discovery. These properties will be used<br />
for each system and saved for each system. Click OK.<br />
6. Click OK when discovery is finished.<br />
Modifying the Location of Multiple Systems<br />
You can change the location of multiple systems at one time. You<br />
can change a maximum of 100 systems, 100 monitors, and 2000<br />
metrics.<br />
To change the location of multiple systems:<br />
1. Click the Configure menu.<br />
2. Select Systems.<br />
3. Select Bulk Location Modification.<br />
This dialog box displays a list of configured systems and their<br />
locations. The list can optionally be filtered. Systems that are<br />
grayed out are in the selected location. This dialog box has the<br />
following options:<br />
Choose a Location To Apply To Multiple Systems – Select the<br />
location that you want to apply to the selected systems.<br />
Chapter 7: Configuring Systems 625
Adding System Components<br />
Show Systems Where contains – Select the<br />
type of filter and enter any specific text, if necessary. For<br />
example, you could search for all systems at the location<br />
Boston. In addition to plain text, you can enter a PERL<br />
expression in the contains field.<br />
– Displays the list of systems based on the filter<br />
selections.<br />
Note: Only the systems explicitly owned by your user group are<br />
listed. To change systems in a sub group of your user group you<br />
must log on as a user in the sub group.<br />
Check All – Checks all systems in the system list.<br />
Uncheck All – Unchecks all systems in the system list.<br />
Save Changes – Saves changes and redisplays the dialog box.<br />
4. Filter the list of displayed systems, if necessary.<br />
5. Select the location that you want to apply to the selected<br />
systems. Grayed out systems are already assigned to the<br />
selected location.<br />
6. Select or deselect systems using the check box in front of the<br />
system name or using the Check All and Uncheck All buttons.<br />
7. Click Save Changes to apply the location to the selected<br />
systems.<br />
8. Repeat these steps as necessary.<br />
9. Click Close when you are done.<br />
626 <strong>OneSight</strong> <strong>Administrator</strong> <strong>Guide</strong>
Adding System Components<br />
Modifying System Components<br />
To modify a system component:<br />
Use this method to update information about a system component in<br />
an existing system definition.<br />
1. Open the System Editor.<br />
2. In the Components box, click the name of the component that<br />
you want to modify.<br />
3. Use settings on the Properties tabs to configure the <strong>OneSight</strong><br />
profile metric data sources for the selected system component.<br />
4. Click OK to update the system definition and return to the<br />
System Editor. Click the Cancel button to close the System<br />
Editor.<br />
Removing System Components<br />
Use this method to remove a system component from an existing<br />
system definition. To remove system components:<br />
1. Open the System Editor.<br />
2. In the Components box, click the name of the component that<br />
you want to remove.<br />
3. Click Remove and confirm that you want to delete this<br />
component definition.<br />
Chapter 7: Configuring Systems 627
Changing Passwords<br />
Changing Passwords<br />
System Passwords<br />
When you configure System monitors in <strong>OneSight</strong>, you can specify<br />
User Name, Domain, and Password information for each system by<br />
selecting Password from the Configure tab. If passwords for the<br />
systems being monitored change periodically, the password<br />
information in the <strong>OneSight</strong> System monitor configurations need to<br />
be updated to have the current passwords.<br />
You can use the Configure Password options to change the<br />
passwords defined in <strong>OneSight</strong> System configuration settings rather<br />
than opening each System configuration individually.<br />
In addition, you can copy passwords from one Windows system to a<br />
another.<br />
Domain/User Name – Select the domain name/user name from the<br />
list. The list contains the domain names and user names specified in<br />
<strong>OneSight</strong> System configurations. The System List displays the<br />
<strong>OneSight</strong> System configurations that use the selected Domain/User<br />
Name.<br />
628 <strong>OneSight</strong> <strong>Administrator</strong> <strong>Guide</strong>
Changing Passwords<br />
System List – Shows the <strong>OneSight</strong> System configurations that use<br />
the selected Domain/User Name.<br />
User Name – The System configuration User name.<br />
New Password – Enter the new Password to use in the System<br />
configurations. The Password characters appear as asterisks for<br />
security.<br />
Confirm Password – Enter the Password again to confirm it.<br />
Domain – The System configuration Domain.<br />
Copy Password – Displays the Change Password dialog box for<br />
copying a password from one Windows system to another.<br />
Visual Script Passwords<br />
When you configure Oracle Test for Web Applications Transaction<br />
monitors in <strong>OneSight</strong>, you can specify Realm, Username, and<br />
Password information for visual scripts. If passwords for the scripts<br />
change periodically, the password information in the Oracle Test<br />
for Web Applications Transaction monitor configurations need to<br />
be updated to have the current passwords.<br />
Chapter 7: Configuring Systems 629
Changing Passwords<br />
You can use the Configure Password options to change the<br />
passwords defined in Oracle Test for Web Applications Transaction<br />
monitor configuration settings rather than opening each monitor<br />
configuration individually.<br />
Domain/User Name – Select the domain name/user name from the<br />
list. The list contains the domain names and user names specified in<br />
Oracle Test for Web Applications Transaction monitor<br />
configurations.<br />
Realm – Displays the full Uniform Resource Locator (URL) for the<br />
Web application that requires a user name and password.<br />
New Password – Enter the new Password. The Password characters<br />
appear as asterisks for security.<br />
Confirm Password – Enter the Password again to confirm it.<br />
630 <strong>OneSight</strong> <strong>Administrator</strong> <strong>Guide</strong>
Changing Passwords<br />
URL Script Passwords<br />
When you configure URL monitors in <strong>OneSight</strong>, you can specify<br />
user name and password information for URLs that require<br />
authentication. Use this dialog box to change the password for all<br />
URL monitors that are configured with the same user name.<br />
User Name – Select the user whose password you want to change.<br />
New Password – Enter the new password for this user.<br />
Confirm Password – Re-enter the new password for this user.<br />
Virtual Agent Passwords<br />
You can change the password for all virtual agents using the same<br />
connection method and user name.<br />
Chapter 7: Configuring Systems 631
Changing Passwords<br />
Connection Method – Select the protocol used to connect.<br />
User Name – Select the user name whose password you want to<br />
change.<br />
System List – Shows the <strong>OneSight</strong> System configurations that use<br />
the selected connection method and user name.<br />
New Password – Enter the new password to use. The password<br />
characters appear as asterisks for security.<br />
Confirm Password – Enter the password again to confirm it.<br />
632 <strong>OneSight</strong> <strong>Administrator</strong> <strong>Guide</strong>
C h a p t e r 8<br />
Creating Action Plans<br />
An action plan consists of a sequence of actions that are triggered<br />
when an alert occurs. These actions tell <strong>OneSight</strong> how to respond<br />
should a problem arise with the health of your e-business system.<br />
For example, you can create an action plan that sends an e-mail<br />
notification to a member of your team when a specified threshold is<br />
crossed. The recipient of the mail has the opportunity to retire the<br />
alert, given what is known about the problem. If the recipient of the<br />
e-mail action does not respond before the escalation timeout period<br />
has expired, the action plan automatically performs the next action<br />
in the plan. Once an action is configured, it can be used by any<br />
monitor group or profile.<br />
633
Creating a New Action Plan<br />
The Action Plans page displays a list of all currently defined action<br />
plans. To access an existing plan, select a name from the list and<br />
click Modify. To create a new action plan click Add.<br />
To determine whether an action plan is in use by a monitored<br />
component or whether the plan has been scheduled, check the<br />
Action Plan Symbols:<br />
Action plan is configured but not in use by a monitor group or<br />
monitored component.<br />
Action plan is scheduled but not in use by a monitored<br />
component.<br />
Action plan is in use by one or more monitored components. An<br />
action plan in this state can be modified; however, it cannot be<br />
renamed or removed.<br />
Action plan is scheduled and in use by one or more monitored<br />
components. An action plan in this state can be modified;<br />
however, it cannot be renamed or removed.<br />
<strong>OneSight</strong> provides default action plans for use when configuring<br />
monitors and profiles. These action plans are named to allow you to<br />
quickly associate your monitors with action plan of the same name<br />
and type. While these action plans are provided for you, they are<br />
not preconfigured with any specific actions. To use these action<br />
plans, or any new action plans you configure, you must add the<br />
necessary actions to each plan you intend to use and configure them<br />
accordingly.<br />
Each action in an action plan is associated with a time interval. For<br />
example, you can have an action plan that has two time intervals,<br />
one for work hours and one for after hours and weekends. The<br />
actions that will occur if the action plan is triggered can be different<br />
for each time interval. A default time interval of 24x7 is<br />
automatically added to new action plans but can be deleted.<br />
634 <strong>OneSight</strong> <strong>Administrator</strong> <strong>Guide</strong>
Creating a New Action Plan<br />
Creating a New Action Plan<br />
To create a new action plan:<br />
1. Click the Configure menu, then click Action Plans.<br />
Chapter 8: Creating Action Plans 635
Creating a New Action Plan<br />
2. On the Action Plans page, click Add.<br />
The Action Plan Manager opens when you click Add or Modify<br />
on the Action Plans page. The Action Plan Manager enables<br />
you to configure action plans for specific alerts. An action plan<br />
consists of a sequence of responses that are triggered when an<br />
alert occurs.<br />
Name – Displays the action plan name.<br />
Schedules for this Action Plan – Displays the time intervals used<br />
by this action plan. Time intervals are created by selecting Time<br />
Intervals on the Configure tab. Refer to Chapter 14 for more<br />
information.<br />
Actions for this Schedule – Displays the sequence of actions to<br />
be taken when this action plan is triggered by an alert during the<br />
selected time interval.<br />
636 <strong>OneSight</strong> <strong>Administrator</strong> <strong>Guide</strong>
Creating a New Action Plan<br />
3. In the Action Plan - Add dialog box, enter a name for the new<br />
plan in the Name box.<br />
4. Click Add in the Schedules for this Action Plan section to add<br />
more time intervals.<br />
This dialog box lists all time intervals that have been<br />
configured that are not being used in the plan.<br />
5. Select the time interval you want to add and click OK.<br />
Chapter 8: Creating Action Plans 637
Adding Actions to the Plan<br />
6. Select the time interval to which you want to add actions, and<br />
click Add in the Actions for this Schedule section.<br />
Adding Actions to the Plan<br />
To add actions to an action plan:<br />
1. In the Global Action Manager, select an action to be added to<br />
the new plan and click OK.<br />
638 <strong>OneSight</strong> <strong>Administrator</strong> <strong>Guide</strong>
Adding Actions to the Plan<br />
To create a new action for this plan, click Add in the Global<br />
Action Manager, then create a new action.<br />
You can add or modify actions at any time; additions made to<br />
the list of actions affect all action plans, except those plans<br />
currently displayed as in use on the <strong>OneSight</strong> Console. The<br />
following parameters must be configured for each action:<br />
Name – Displays the common name for this action. This name<br />
is used to identify this action throughout the <strong>OneSight</strong> system.<br />
Note: Actions cannot be duplicated using the same name. To<br />
create a duplicate action, add a new action to the list using a<br />
different name.<br />
Action Type – Displays the current action type.<br />
Message Template – Displays the list of message templates. By<br />
default, <strong>OneSight</strong> selects the message template most<br />
appropriate for the specified action type. You can also create<br />
your own custom message templates. See Adding Message<br />
Templates for details.<br />
Note: The %DescriptionByOID% substitution variable can be<br />
used in the SNMP Trap message template to generate an OID<br />
Chapter 8: Creating Action Plans 639
Adding Actions to the Plan<br />
for each valid message template variable. For example,<br />
%Monitor%, %Metric%, etc. Specific mappings are in the<br />
<strong>OneSight</strong>.MIB file. In the default template, a maximum length of<br />
1100 has been specified for the %DescriptionBy OID% value.<br />
In some circumstances the trap message may be discarded due<br />
to excessive length. Refer to<br />
http://support.microsoft.com/kb/233401/en-us for details.<br />
Modify – Displays the Modify Alert Message Template dialog<br />
box for modifying the selected message template.<br />
Escalation Timeout – Amount of time (in minutes) for this<br />
action to wait after executing before performing the next action<br />
in the Action Plan.<br />
Escalation time out for good state – when checked, use the<br />
escalation timeout for alerts associated with a return to good<br />
state.<br />
Reminder Interval – Amount of time (in minutes) to wait before<br />
repeating the action if the alert is still valid.<br />
Repeat for good state – when checked, applies to alerts<br />
associated with a return to good state.<br />
Total Counts – The total number of times to repeat this action.<br />
For example, if you have set up a 24x7 action plan to send<br />
email actions with the following actions and settings:<br />
Action 1: Escalation = 5, Reminder = 1, Total Counts = 20<br />
Action 2: Escalation = 5, Reminder = 5, Total Counts = 3<br />
Action 3: Escalation = 0, Reminder = 10, Total Counts = 3<br />
Action 4: Escalation = 0, Reminder = 0, Total Counts = 1<br />
The entire action plan will first execute the actions serially, that<br />
is, action 1 completes the first iteration, and subsequent actions<br />
occur as the escalation timeout expires for each action. Then<br />
640 <strong>OneSight</strong> <strong>Administrator</strong> <strong>Guide</strong>
Adding Actions to the Plan<br />
the remaining iterations for each action are executed according<br />
to the total counts and reminder intervals.<br />
For example:<br />
In Minute . . .<br />
the Following Actions Occur<br />
1 Action 1<br />
2 Action 1<br />
3 Action 1<br />
4 Action 1<br />
5 Action 1, Action 2<br />
6 Action 1<br />
7 Action 1<br />
8 Action 1<br />
9 Action 1<br />
10 Action 1, Action 2, Action 3, Action 4<br />
11 Action 1<br />
12 Action 1<br />
13 Action 1<br />
14 Action 1<br />
15 Action 1, Action 2<br />
16 Action 1<br />
Chapter 8: Creating Action Plans 641
Adding Actions to the Plan<br />
17 Action 1<br />
18 Action 1<br />
19 Action 1<br />
20 Action 1, Action 3<br />
21<br />
22<br />
23<br />
24<br />
25<br />
26<br />
27<br />
28<br />
29<br />
30 Action 3<br />
Modify – Displays the Modify Alert Message Template dialog<br />
box for editing the selected message template.<br />
Escalation time out for good state – Enables escalation when this<br />
action is used in a return to good state action plan.<br />
Repeat for good state – Enables repeat when this action is used<br />
in a return to good state action plan.<br />
2. When the fields for this action are completed, click Test to<br />
confirm the success of this action.<br />
642 <strong>OneSight</strong> <strong>Administrator</strong> <strong>Guide</strong>
Adding Actions to the Plan<br />
3. When the last action has been added to the action plan, click the<br />
Access Control tab to configure which user groups have access<br />
to this action plan.<br />
Owner – The user group for this action. An action can be<br />
directly owned by a single user group.<br />
User Group – Displays the user group names.<br />
Global Read – Gives read access to this user group and all of its<br />
sub user groups.<br />
Read – Gives read permission to the user group.<br />
Write – Gives write permission to the user group.<br />
Delete – Gives delete permission to the user group.<br />
4. Configure permissions and click OK in the Global Action<br />
Manager.<br />
Note: You must enable each action type in the Global Action<br />
Options dialog box before the action plan will perform<br />
properly.<br />
Chapter 8: Creating Action Plans 643
Configuring Global Action Options<br />
5. Click OK. The new plan appears in the Action Plans list.<br />
Configuring Global Action Options<br />
Use this dialog box to configure actions for the Global Actions<br />
list. Configured actions can be added to an Action Plan, which<br />
become alerts when problems occur with a component of your<br />
system.<br />
1. On the Action Plans page, click Global Actions.<br />
2. In the Global Action Manager, click Global Options.<br />
Before an action type is available for use in an action plan, it<br />
must be enabled in the Global Action Options dialog box. The<br />
exception is e-mail actions, which are enabled by default. To<br />
enable actions and notification types, click the Enable check<br />
box for the specified type and complete any configuration<br />
information for that action type.<br />
Action Types<br />
E-Mail – Displays configuration options for e-mail<br />
notifications.<br />
644 <strong>OneSight</strong> <strong>Administrator</strong> <strong>Guide</strong>
Configuring Global Action Options<br />
Incoming E-Mail – Displays configuration options for<br />
specifying the account that will be monitored for replies to e-<br />
mail replies to e-mail actions.<br />
Scripting – Displays configuration options for scripting<br />
actions. This panel also enables you to define environment<br />
variables and parameters for individual scripts.<br />
3. Select the enable check box for each of the action types you<br />
have configured.<br />
4. Complete the configuration for each action type and click OK to<br />
preserve your settings.<br />
Triggering An Email Action<br />
E-mail notification is one of the most direct methods for receiving<br />
up-to-date information regarding the health status of your e-<br />
business system. When you specify e-mail as a notification method,<br />
the recipient you define receives an e-mail message, including a<br />
subject and message, detailing the nature of the alert.<br />
Note: A mail server must be configured for the email action to<br />
work. For more information, see Configuring the Mail Server.<br />
In the Action Manager, when you click E-Mail in the Action Types<br />
list, the bottom portion of the dialog box displays options for<br />
configuring an e-mail action.<br />
Chapter 8: Creating Action Plans 645
Configuring Global Action Options<br />
To create a new action plan with an e-mail action:<br />
1. Click the Configure menu, then click Action Plans.<br />
646 <strong>OneSight</strong> <strong>Administrator</strong> <strong>Guide</strong>
Configuring Global Action Options<br />
2. On the Action Plans page, click Add to add a new action plan or<br />
select one of the default action plans and click Modify. If you<br />
choose to add a new action plan, enter a name for the new plan<br />
in the Name box in the Action Plan dialog box.<br />
3. Select the time interval to which you want to add actions. By<br />
default, the Actions List is empty. Click Add to begin adding<br />
actions to the plan.<br />
Chapter 8: Creating Action Plans 647
Configuring Global Action Options<br />
4. In the Global Action Manager, click Add to add a new action to<br />
this action plan.<br />
5. In the Action Manager - Add dialog box, enter a name for this<br />
action, for example, E-mail Fred.<br />
6. Select E-mail as the Action Type.<br />
Use the following options to specify how the E-Mail<br />
Notification action is configured:<br />
General Tab<br />
Name – Displays the common name for this action. This name<br />
is used to identify this action throughout the Empirix <strong>OneSight</strong><br />
system.<br />
Action Type – Displays the current action type.<br />
Message Template – Displays the list of message templates. By<br />
default, <strong>OneSight</strong> selects the message template most<br />
appropriate for the specified action type. You can also create<br />
your own custom message templates. See Adding Message<br />
Templates for details.<br />
648 <strong>OneSight</strong> <strong>Administrator</strong> <strong>Guide</strong>
Configuring Global Action Options<br />
Modify – Displays the Modify Alert Message Template dialog<br />
box for modifying the selected message template.<br />
Escalation Timeout – Time (in minutes) before this action<br />
performs the next action in the list.<br />
Note: This box is required for creating actions. Enter the<br />
amount of time appropriate to the type of action you are<br />
configuring. Entering zero (0) in this box causes this action and<br />
the action following to execute simultaneously.<br />
Escalation time out for good state – when checked, use the<br />
escalation timeout for alerts associated with a return to good<br />
state.<br />
Reminder Interval – Amount of time (in minutes) to wait before<br />
repeating the action if the alert is still valid.<br />
Repeat for good state – when checked, applies to alerts<br />
associated with a return to good state.<br />
Total Counts – The total number of times to repeat this action.<br />
Test – Performs a test of this action as configured. You must<br />
enable this action type in Global Options before a test of this<br />
action will succeed. If your test produces a 501 (syntax) error,<br />
you may have a problem with your <strong>OneSight</strong> server name.<br />
E-Mail Configuration<br />
Address – Check this option to enter the e-mail address for the<br />
recipient of this notification. The address must be a complete e-<br />
mail address (for example, name@domain.com). Specify multiple<br />
e-mail addresses, separating the addresses by a comma or a<br />
space.<br />
System User – Check this option to select the email recipient<br />
from the list of <strong>OneSight</strong> users.<br />
Chapter 8: Creating Action Plans 649
Configuring Global Action Options<br />
An example e-mail notification is as follows:<br />
Subject: CPU overloaded, long run queue (user_nt)<br />
<strong>OneSight</strong> Warning Alert.<br />
CPU overloaded, long run queue: Value was 16<br />
processes, threshold is 4<br />
processes (4/4/00 6:17 PM)<br />
Component: user_nt<br />
Event: CPU overloaded, long run queue<br />
Metric: Processes: Run Queue Length<br />
Monitor: Windows NT 4 (user_nt)<br />
Monitor Group: User Monitor Group<br />
Description: Number of processes in the run queue<br />
Access Control Tab<br />
The Access Control tab lets you specify which user groups can<br />
read, write, or delete this action.<br />
Owner – The user group for this action. An action can be<br />
directly owned by a single user group.<br />
User Group – Displays the user group names.<br />
Global Read – Gives read access to this user group and all of its<br />
sub user groups.<br />
Read – Gives read permission to the user group.<br />
Write – Gives write permission to the user group.<br />
Delete – Gives delete permission to the user group.<br />
7. From the Message Template list, select a message template for<br />
the action. By default, <strong>OneSight</strong> selects the message template<br />
most appropriate for the specified action type. You can also<br />
create your own custom message templates. See Adding<br />
Message Templates later in this chapter for details.<br />
8. Enter an Escalation Timeout. This is the amount of time you<br />
want <strong>OneSight</strong> to wait before performing the next action in the<br />
650 <strong>OneSight</strong> <strong>Administrator</strong> <strong>Guide</strong>
Configuring Global Action Options<br />
action plan. Since this action plan has only one step, you can<br />
type in 0.<br />
9. Enter a reminder interval. This is the amount of time you want<br />
<strong>OneSight</strong> to wait before repeating this action.<br />
10. Enter the total counts. This is the number of times to repeat this<br />
action.<br />
11. Under E-Mail Configuration, either select Address to enter the<br />
e-mail address of the person(s) to notify when the action is<br />
executed, separating email addresses with a space,. Or select<br />
System User to choose the user from the list of <strong>OneSight</strong> users.<br />
12. Click Test to confirm that the information you entered will<br />
create a successful action.<br />
Note: The settings in the Global Options for this action type<br />
must be defined before a test of this action will succeed.<br />
13. Click OK to close the next two dialog boxes. You will now be<br />
able to pick this action plan when you want to associate an alert<br />
with an action plan.<br />
Replying to an E-mail Alert<br />
You can configure <strong>OneSight</strong> to accept incoming e-mail responses to<br />
e-mail alert notifications. The responses will go to an email account<br />
that is enabled and configured by creating an Incoming E-Mail<br />
Global Action Option as described later in this chapter.<br />
This allows you to acknowledge an alert, suspend or retire an action<br />
plan, and include a note about what you are doing. If subsequent<br />
email alerts happen later in the Action Plan’s escalation, these notes<br />
can be included. They can also be seen in the console. The Admin<br />
Email Template includes the %AlertNotes% variable to make this<br />
happen.<br />
Chapter 8: Creating Action Plans 651
Configuring Global Action Options<br />
%AlertNotes% is filled in for escalations after the<br />
acknowledgement. If you are not escalating, the variable will be<br />
blank. For example, if you had the following action plan:<br />
Email Eric. Wait 5 minutes. Email Stan.<br />
If Eric acknowledges the alert before it is emailed to Stan,<br />
%AlertNotes% contains the acknowledgement.<br />
Email actions that allow incoming email are tracked using an<br />
identifier in the subject of the e-mail. For example, Action ID: 412.<br />
When you reply to an e-mail alert, the following reply commands<br />
can be used and must begin the body of the email. Reply commands<br />
are case-sensitive.<br />
ACK – Acknowledge the alert<br />
ESC – Escalates the action to the first non-delay action that follows<br />
the e-mail action that was replied to. If the escalation has occurred,<br />
no action is taken.<br />
RET – Retire the action plan<br />
SUS – Suspend the action plan<br />
For example: ACK “I’ll take a look at it now. Mbrown”<br />
The list of reply commands is determined the possible options for<br />
that action plan. For example, you cannot escalate if there is no<br />
follow-up action to escalate to in the action plan. You cannot<br />
resume an action plan from an e-mail reply.<br />
Acknowledging an alert that is no longer outstanding has no effect.<br />
Suspending or retiring an action plan does nothing when the alert is<br />
already retired.<br />
All inbound actions will be included in the Audit reports of the<br />
type, ―E-Mail Reply.‖ The activities will be: alert acknowledged,<br />
retire action plan, suspend action plan, and escalate action.<br />
652 <strong>OneSight</strong> <strong>Administrator</strong> <strong>Guide</strong>
Configuring Global Action Options<br />
Valid incoming replies are deleted after they are processed. Invalid<br />
replies are left on the server. If an incoming reply is no longer valid<br />
by the time it is received, it is written to the Audit log with the<br />
message, ―E-Mail reply ignored – request no longer valid at the<br />
time of receipt for E-Mail reply (0).‖<br />
Validating Email Connections<br />
E-mail servers that check the host name using RFC 810 will not<br />
accept connections to machines with a name containing an<br />
underscore. If the machine name of the <strong>OneSight</strong> server includes an<br />
underscore, you may have problems associated with e-mail servers<br />
under the following conditions:<br />
If you change the mail server specification in the Global Action<br />
Options dialog box.<br />
If you configure a Mail monitor for an e-mail server that enforces<br />
RFC 810.<br />
Most e-mail servers do not enforce this RFC. To check for this<br />
problem on <strong>OneSight</strong> servers with names that include an<br />
underscore:<br />
Test your Mail monitor when you create it.<br />
Test your e-mail action when you create it.<br />
SMTP daemons that do not accept this host name return a 501<br />
(syntax error) message when a connection is attempted. If you see<br />
an error of this type, you can reconfigure the monitored component<br />
or the e-mail server or you can install <strong>OneSight</strong> on a machine that<br />
has a name without an underscore.<br />
RFC 810 – RFC 810 states that the host name must be ―text string up<br />
to 24 characters drawn from the alphabet (A-Z), digits (0-9), and the<br />
minus sign (-) and period (.). No blank or space characters are<br />
permitted as part of a name. No distinction is made between upper<br />
Chapter 8: Creating Action Plans 653
Configuring Global Action Options<br />
and lower case. The first character must be a letter. The last<br />
character must not be a minus sign or period.‖<br />
Adding/Modifying Message Templates<br />
The message content for Empirix <strong>OneSight</strong> alerts is configured<br />
using text template files. Empirix <strong>OneSight</strong> is shipped with default<br />
message template files for the various Alert types (e.g., e-mail,<br />
pager, SNMP trap), but you can add your own message templates in<br />
<strong>OneSight</strong> to further customize your alert notifications. This can be<br />
useful for the following reasons:<br />
You can customize alert content to generate messages containing<br />
only the information that is meaningful to the alert notification<br />
recipient. Alert messages can be customized for each configured<br />
action, so a single alert condition can now be configured to<br />
trigger, for instance, different e-mail text for each recipient of the<br />
alert notification.<br />
You can customize alert content so that it is formatted optimally<br />
for the intended alert devices (e.g., email, pager, phones, etc).<br />
You can customize e-mail alerts to include direct links to the<br />
Empirix <strong>OneSight</strong> Status and Reports pages. This can be useful<br />
for <strong>OneSight</strong> <strong>Administrator</strong>s and Operators.<br />
<strong>OneSight</strong> selects an appropriate default template based on the type<br />
of action you are configuring.<br />
Customization of alert message text is accomplished using<br />
<strong>OneSight</strong> defined substitution variables. These same substitution<br />
variables can also be passed to Scripting Actions in both the<br />
Parameters and Environment Settings fields.<br />
654 <strong>OneSight</strong> <strong>Administrator</strong> <strong>Guide</strong>
Configuring Global Action Options<br />
Adding a New Alert Message Template<br />
To create a new Message Template:<br />
1. Click the Configure menu.<br />
2. Select Alert Message Template.<br />
This dialog box lists existing alert message templates and lets<br />
you add, modify, and remove them.<br />
Add – Displays the Add Alert Message Template dialog box for<br />
adding a new alert message template.<br />
Modify – Displays the Modify Alert Message Template dialog<br />
box for modifying the selected alert message template.<br />
Remove – Deletes the selected alert message template.<br />
Used By – Displays a list of the actions that are using the<br />
selected alert message template.<br />
Name – Displays the name of the alert message template.<br />
Chapter 8: Creating Action Plans 655
Configuring Global Action Options<br />
Description – Displays the description of the alert message<br />
template.<br />
3. Click Add.<br />
Name – Enter the name of the Message Template. This name<br />
appears in the Message Template drop-down list, so it should<br />
be a brief (40 character) description of the template.<br />
Description – Enter a description of the Message Template. The<br />
description is currently ignored by <strong>OneSight</strong>, but it is useful for<br />
documenting the purpose of your template.<br />
Subject – This section is used for the subject content in e-mail<br />
actions. This section can be a mixture of text and substitution<br />
variables. For example, %DescriptionShort%, displays a short<br />
description of the alert condition. Refer to the “Message<br />
656 <strong>OneSight</strong> <strong>Administrator</strong> <strong>Guide</strong>
Configuring Global Action Options<br />
Template Variables” section later in this chapter for a list of<br />
available substitution variables.<br />
Body – This is the actual content of your actions. This section<br />
can be a mixture of text and substitution variables. For example<br />
to display the alert priority, a long description, and links to the<br />
status details page, you would enter the following:<br />
<strong>OneSight</strong> %Priority% Alert<br />
%DescriptionLong%<br />
Current status: %statuslink%<br />
Refer to the “Message Template Variables” section later in this<br />
chapter for a list of available substitution variables.<br />
Note: To send HTML-based emails, include either an or<br />
tag in the body of the message, preferably in the<br />
body section. <strong>OneSight</strong> will then set the headers so that email<br />
recipients using an HTML capable email client, will be able to<br />
view alerts in that format.<br />
4. Enter the content of the alert message template and click OK.<br />
Modifying an Alert Message Template<br />
Warning: If you modify an existing template that was provided by<br />
Empirix, Inc., the changes will be lost following an upgrade to a<br />
future version of <strong>OneSight</strong>. Your custom Message Templates will<br />
always be preserved following an upgrade.<br />
To modify a Message Template:<br />
1. Click the Configure menu.<br />
2. Select Alert Message Template.<br />
Chapter 8: Creating Action Plans 657
Configuring Global Action Options<br />
3. Select the alert message template that you want to change and<br />
click Modify.<br />
4. Make any changes and click OK.<br />
Message Template Variables<br />
The Message Template substitution variables are defined below.<br />
These variables are recognized in the Message Template Files<br />
because they are surrounded by the percent (―%‖) character.<br />
Additionally, you can specify a maximum length for each variable<br />
by appending a colon (―:‖) character and maximum length value to<br />
the end of the variable name. For example,<br />
%DescriptionLong:48% will limit the extended description of the<br />
alert to 48 characters.<br />
Note: Depending on the context in which the variables are used,<br />
they may not get resolved. For example, %systemname% may not<br />
658 <strong>OneSight</strong> <strong>Administrator</strong> <strong>Guide</strong>
Configuring Global Action Options<br />
resolve when at a monitor group level since there may be any<br />
number of system names.<br />
%AlertName% – The name of the alert condition. Example: ―Slow<br />
URL‖.<br />
%AlertNotes% – Contains runtime acknowledged notes. After an<br />
alert is acknowledged, escalated email actions can optionally<br />
include %AlertNotes%.<br />
%AlertSummary% – The summary of the alert condition, as<br />
generated by <strong>OneSight</strong>. Example: ―Slow URL: Value was 11.701<br />
seconds, threshold is 8.0 seconds (4/4/01 1:52 PM)‖.<br />
%AlertText% – The text of the alert as received from the agent.<br />
%AlertThreshold% – The numeric threshold value that triggered the<br />
alert. Example: ―8.0 seconds‖.<br />
%AlertType% – The type of the alert, as defined by <strong>OneSight</strong>.<br />
Example: ―Greater Than Threshold (Notify Once)‖<br />
%AlertValue% – The numeric value of the alert, or ―N/A‖ for non<br />
threshold alerts. Example: ―11.701 seconds‖.<br />
%Attribute->attribute% – Attribute is the name of the attribute whose<br />
value you want to interrogate. For example, if you have an attribute<br />
named Application with a value of Card Services, then<br />
%Attribute->Application% resolves to Card Services if the<br />
alerting Monitor contains this Attribute.<br />
%ChartLink% – A http link to the <strong>OneSight</strong> Metric Performance<br />
Report for the metric that generated the alert. This variable can be<br />
useful for e-mail actions sent to <strong>OneSight</strong> <strong>Administrator</strong>s and<br />
Operators.<br />
%Component% – The name of the component that generated the<br />
alert. Example: ―Disk C:‖.<br />
Chapter 8: Creating Action Plans 659
Configuring Global Action Options<br />
%ConfigAlertNotes% – Contains the configuration notes for the alert<br />
as specified in the Notes tab of the Alert Editor.<br />
%ConfigLink% – A http link to the <strong>OneSight</strong> Metric Configuration<br />
Report for the metric that generated the alert. This variable can be<br />
useful for e-mail actions sent to <strong>OneSight</strong> <strong>Administrator</strong>s and<br />
Operators.<br />
%CurrentClip% – For <strong>OneSight</strong> Voice Engine scripts, attaches the<br />
voice clip of the current run to an email.<br />
%DateLong% – The locale-specific date the alert occurred, in long<br />
format. Example: ―Wednesday, April 4, 2001‖.<br />
%DateShort% – The locale-specific date the alert occurred, in short<br />
format (mm/dd/yy). Example: ―4/4/01‖.<br />
%DescriptionLong% – An extended description of the alert<br />
condition, as generated by <strong>OneSight</strong>.<br />
%DescriptionShort% – A short description of the alert condition, as<br />
generated by <strong>OneSight</strong>. This variable is useful for the Subject line<br />
of an e-mail action.<br />
%InsertFile:filename% – Filename is the path and name of the file to<br />
be inserted into the message. For example, you could use this<br />
variable to include the output results of a prior action. A script<br />
action could write to an output file and a subsequent email action<br />
could include the contents of the file.<br />
%IntelliSearch% – Including this variable in your template will<br />
invoke the IntelliSearch algorithm against the alerting Monitor. The<br />
format is as follows:<br />
IntelliSearch[:numberOfEntries[CWG][:StringSizeLimit]]<br />
660 <strong>OneSight</strong> <strong>Administrator</strong> <strong>Guide</strong>
Configuring Global Action Options<br />
where:<br />
numberOfEntries specifies how many monitors are potentially<br />
returned<br />
C specifies Monitors in Critical State<br />
W specifies Monitors in Warning State<br />
G specifies Monitors in Good State<br />
StringSizeLimit is the maximum length of this variable's result<br />
For example, %IntelliSearch:5WC:2500% will allow 5 items that<br />
are in critical or warning state and will (in total) be less than 2500<br />
characters in length.<br />
%Location% – The location of the Data Collector that sends out the<br />
alerts.<br />
%Metric% – The name of the metric that generated the alert.<br />
Example: ―Disk: % Space Available‖<br />
Note: For SNMP dedicated monitors, ―SNMP‖ is displayed.<br />
%MetricDescription% – The description of the metric that generated<br />
the alert.<br />
%Monitor% – The name of the monitor that generated the alert.<br />
Example: ―URL (http://www.empirix.com)‖.<br />
%Network% – The network of the Data Collector that sends out the<br />
alerts.<br />
%PlanName% – The name of the <strong>OneSight</strong> Action Plan that<br />
generated the alert. Example: ―Email KenD‖.<br />
%Priority% – The priority of the alert. Example: ―Warning‖.<br />
Chapter 8: Creating Action Plans 661
Configuring Global Action Options<br />
%_property% – Allows access to any monitor property. Substitute<br />
the word property for the actual property name. For example, some<br />
<strong>OneSight</strong> Voice Engine and Voice Watch properties are:<br />
%_HIMServerName% – Returns the CallMaster server name.<br />
%_HIMPath% – Returns the path to the <strong>OneSight</strong> Admin and<br />
Detail .asp pages included with the CallMaster installation.<br />
%_HIMSID% – Returns the scenario ID.<br />
%_HIMSCID% – Returns the script ID.<br />
%_CPServerName% – Returns the Voice Watch server name.<br />
%_CPUserName% – Returns the User ID of the Voice Watch<br />
service account.<br />
%_CPPassword% – Returns the password of the Voice Watch<br />
service account.<br />
%Region% – The region of the Data Collector that sends out the<br />
alerts.<br />
%StatusLink% – A http link to the <strong>OneSight</strong> Status Details Page for<br />
the metric that generated the alert. This variable can be useful for e-<br />
mail actions sent to <strong>OneSight</strong> <strong>Administrator</strong>s and Operators.<br />
%SystemName% – The name of the system that generated the alert.<br />
Example: ―JBK_P3‖.<br />
%TimeLong% – The locale-specific time the alert occurred, in long<br />
format, including the time zone. Example: ―1:52:16 PM PDT‖.<br />
%TimeShort% – The locale-specific time the alert occurred, in short<br />
format. Example: ―1:52 PM‖.<br />
%UserGroup% – The name of the user group.<br />
662 <strong>OneSight</strong> <strong>Administrator</strong> <strong>Guide</strong>
Configuring Global Action Options<br />
%WebApplication% – The name of the Monitor Group that generated<br />
the alert. Example: ―Business Partner Extranet‖. If multiple<br />
Monitor Groups use this metric, the result is a comma delimited list.<br />
Triggering a Scripting Action<br />
In the Action Manager dialog box, when you click Scripting in the<br />
Action Types list, the bottom portion of the dialog box displays<br />
options for configuring a Scripting action.<br />
Note: If you are running a script on a remote machine, that machine<br />
must have either a Data Collector or Remote Agent installed.<br />
To add a scripting action:<br />
1. On the Action Plans page, click Global Actions.<br />
2. In the Global Action List Manager, click New.<br />
3. In the Action Manager - Add dialog box, enter a name for the<br />
action in the Name box.<br />
Chapter 8: Creating Action Plans 663
Configuring Global Action Options<br />
4. From the Action Type list, select Scripting.<br />
Use the following options to specify how the Scripting action is<br />
configured:<br />
Name – Displays the common name for this action. This name<br />
is used to identify this action throughout the <strong>OneSight</strong> system.<br />
Action Type – Displays the current action type.<br />
Escalation Timeout – Time (in minutes) before this action<br />
performs the next action in the list.<br />
Escalation time out for good state – when checked, use the<br />
escalation timeout for alerts associated with a return to good<br />
state.<br />
Reminder Interval – Amount of time (in minutes) to wait before<br />
repeating the action if the alert is still valid.<br />
Repeat for good state – when checked, applies to alerts<br />
associated with a return to good state.<br />
664 <strong>OneSight</strong> <strong>Administrator</strong> <strong>Guide</strong>
Configuring Global Action Options<br />
Total Counts – The total number of times to repeat this action.<br />
Note: This box is required for creating actions. Enter the<br />
amount of time appropriate to the type of action you are<br />
configuring. Entering zero (0) in this box causes this action and<br />
the action following to execute simultaneously.<br />
Test – Performs a test of this action as configured. You must<br />
enable this action type in Global Options before a test of this<br />
action will succeed.<br />
Path – Enter a path, including the script name, for this script.<br />
The path can either be absolute or relative to the machine on<br />
which the script is executed. For example:<br />
F:\scripts\script.bat<br />
If you specifically call the command engine, for example:<br />
C:\winnt\system32\cmd.exe, you must add ―/c‖ at the<br />
beginning of the parameters value as shown in the second<br />
example below.<br />
Note: If you are using the %Monitor% variable and you have<br />
created monitors with spaces in the name, run the batch file<br />
using the command engine as described above, and place quotes<br />
around each parameter. If you do not, parameters may not be<br />
passed correctly.<br />
For UNIX systems, enter the shell path. For example: /bin/sh<br />
Parameters – Parameters entered into this field are appended to<br />
the script command. For example, entering ―-edaf‖ is equivalent<br />
to a command line entry such as: F:\scripts\script.bat –<br />
edaf<br />
If you specifically call the command engine, ―/c‖ must be added<br />
to the beginning of the parameter value. For example: /c<br />
F:\scripts\script.bat -edaf<br />
Chapter 8: Creating Action Plans 665
Configuring Global Action Options<br />
For UNIX systems, specify the location of the Shell script. For<br />
example: /user/myname/script.sh<br />
<strong>OneSight</strong> Message Template Variables can also be included as<br />
script parameters.<br />
Environment Settings – This field is used to pass an<br />
environment setting to your host system. To use this box, set<br />
the environment variables the same way that you set them on<br />
the respective systems. If more than one environment variable<br />
needs to be set, separate them using an ampersand (&).<br />
For example:<br />
UNIX – PATH=/bin:/usr/bin&LIBPATH=/lib:/usr/lib<br />
NT –<br />
PATH=c:\winnt\system32;c:\winnt&LIBPATH=c:\winnt\lib<br />
Notes: For best results, do not include a space before or after<br />
the ampersand (&) when entering multiple settings.<br />
If the script continues to fail, try adding<br />
COMSPEC=c:\winnt\system32\cmd.exe to the NT Environment<br />
settings.<br />
<strong>OneSight</strong> Message Template Variables can also be included as<br />
values for environment variables.<br />
Machine Name – Enter the name of the machine on which the<br />
script will execute. The machine name can either be qualified<br />
(sunsolaris.company.com) or unqualified (sunsolaris). A<br />
Remote Agent or Data Collector must be running on this<br />
machine.<br />
You can specify the %SystemName% message template variable<br />
for the machine name. The c variable will resolve to the system<br />
associated with the alert that triggered the script action.<br />
666 <strong>OneSight</strong> <strong>Administrator</strong> <strong>Guide</strong>
Configuring Global Action Options<br />
Access Control Tab<br />
The Access Control tab lets you specify which user groups can<br />
read, write, or delete this action.<br />
Owner – The user group for this action. An action can be<br />
directly owned by a single user group.<br />
User Group – Displays the user group names.<br />
Global Read – Gives read access to this user group and all of its<br />
sub user groups.<br />
Read – Gives read permission to the user group.<br />
Write – Gives write permission to the user group.<br />
Delete – Gives delete permission to the user group.<br />
5. Enter an escalation timeout value.<br />
6. Enter a reminder interval. This is the amount of time you want<br />
<strong>OneSight</strong> to wait before repeating the action.<br />
7. Enter the total counts. This is the number of times to repeat the<br />
action.<br />
8. In the Scripting Configuration section, enter the correct path for<br />
this script.<br />
9. In the Parameters box, enter any parameters necessary for this<br />
script. You can also include Message Template Variables as<br />
script parameters.<br />
10. In the Environment Settings box, enter any NT or UNIX<br />
environment variables exactly as you would enter them on a<br />
command line. You can also include Message Template<br />
Variables as values for environment variables.<br />
Chapter 8: Creating Action Plans 667
Configuring Global Action Options<br />
11. Enter the Machine Name on which the script will be executed.<br />
12. Click Test to confirm that the information you entered will<br />
create a successful action.<br />
Note: The settings in the Global Options for this action type<br />
must be defined before a test of this action will succeed.<br />
13. Click OK.<br />
Triggering an SNMP Action<br />
The Simple Network Management Protocol (SNMP) action type<br />
exists to integrate the Empirix <strong>OneSight</strong> Console with other systems<br />
or frameworks that can receive SNMP traps. The SNMP type enables<br />
you to configure an SNMP trap so that <strong>OneSight</strong> alerts and profiles<br />
can be sent by other systems.<br />
To ensure proper communication, a MIB (Management Information<br />
Base) file is provided to describe the SNMP objects used by<br />
<strong>OneSight</strong>. This file can be copied and loaded on remote systems.<br />
The MIB serves two important purposes:<br />
To allows traps to be configured before they are received.<br />
To allow you to view additional information regarding each trap<br />
type, including a description of the alert that triggers the trap and<br />
the priority level of the trap.<br />
In the Action Manager, when you click SNMP in the Action Types<br />
list, the bottom portion of the dialog box displays options for<br />
configuring an SNMP action.<br />
668 <strong>OneSight</strong> <strong>Administrator</strong> <strong>Guide</strong>
Configuring Global Action Options<br />
To add an SNMP action:<br />
1. On the Action Plans page, click Global Actions.<br />
2. In the Global Action List Manager, click New.<br />
3. In the Action Manager - Add dialog box, enter a name for the<br />
action in the Name box.<br />
Chapter 8: Creating Action Plans 669
Configuring Global Action Options<br />
4. From the Action Type list box, choose the SNMP action type.<br />
Use the following options to specify how the SNMP action is<br />
configured:<br />
Name – Displays the common name for this action. This name<br />
is used to identify this action throughout the <strong>OneSight</strong> system.<br />
Action Type – Displays the current notification type.<br />
Message Template – Displays the list of message templates. By<br />
default, <strong>OneSight</strong> selects the message template most<br />
appropriate for the specified action type. You can also create<br />
your own custom message templates. See Adding Message<br />
Templates for details.<br />
Modify – Displays the Modify Alert Message Template dialog<br />
box for modifying the selected message template.<br />
Escalation Timeout – Time (in minutes) before this action<br />
performs the next action in the list.<br />
670 <strong>OneSight</strong> <strong>Administrator</strong> <strong>Guide</strong>
Configuring Global Action Options<br />
Note: This box is required for creating actions. Enter the<br />
amount of time appropriate to the type of action you are<br />
configuring. Entering zero (0) in this box causes this action and<br />
the action following to execute simultaneously.<br />
Escalation time out for good state – when checked, use the<br />
escalation timeout for alerts associated with a return to good<br />
state.<br />
Reminder Interval – Amount of time (in minutes) to wait before<br />
repeating the action if the alert is still valid.<br />
Repeat for good state – when checked, applies to alerts<br />
associated with a return to good state.<br />
Total Counts – The total number of times to repeat this action.<br />
Test – Performs a test of this action as configured. You must<br />
enable this action type in Global Options before a test of this<br />
action will succeed.<br />
Destination Host – Displays the destination host name or IP<br />
address to which the trap is sent.<br />
Trap Source – Displays the host name or IP address from which<br />
the trap was sent. By default, the server on which <strong>OneSight</strong> is<br />
running is displayed.<br />
Community – The community string is the SNMP community<br />
string authorized by the destination trap listener. The default<br />
SNMP community string for <strong>OneSight</strong> is public.<br />
Port – The standard port for SNMP traps is 162. Change the<br />
default port number in this box.<br />
Charset – This field is used for internationalization. If<br />
necessary, select the appropriate character set.<br />
Chapter 8: Creating Action Plans 671
Configuring Global Action Options<br />
ISO-8859-1 – Latin alphabet for Western European languages<br />
such as Basque, Catalan, Danish, Dutch, English, Faeroese,<br />
Finnish, French, German, Icelandic, Irish, Italian, Norwegian,<br />
Portuguese, Rhaeto-Romanic, Scottish, Spanish, Swedish,<br />
Albanian, Afrikaans, and Swahili.<br />
ISO-8859-13 – Baltic Rim languages.<br />
ISO-8859-15 – Latin alphabet for Western European<br />
languages.<br />
ISO-8859-2 – Central and Eastern European languages that<br />
use a Roman alphabet, including Polish, Czech, Slovak,<br />
Slovenian, and Hungarian.<br />
ISO-8859-4 – Latin alphabet for Estonian, Latvian,<br />
Lithuanian, Greenlandic, and Sami.<br />
ISO-8859-5 – Most Slavic languages that use a Cyrillic<br />
alphabet including Belarusian, Bulgarian, Macedonian,<br />
Russian, Serbian, and Ukranian.<br />
ISO-8859-7 – Greek.<br />
ISO-8859-9 – Latin alphabet for Western European languages,<br />
similar to ISO 8859-1 with the Icelandic letters replaced with<br />
Turkish letters. It is also used for Kurdish.<br />
K018-R – Cyrillic<br />
US-ASCII – United States.<br />
UTF-16 – Unicode 16 bit.<br />
UTF-16BE – Unicode big-endian.<br />
UTF-16LE – Unicode little-endian.<br />
UTF-8 – Unicode 8 bit mostly used for HTML.<br />
672 <strong>OneSight</strong> <strong>Administrator</strong> <strong>Guide</strong>
Configuring Global Action Options<br />
Windows 1250 – Microsoft Windows Code Page for Central<br />
European Latin alphabet languages.<br />
Windows 1251 – Microsoft Windows Code Page for Russian<br />
and other Cyrillic languages.<br />
Windows 1252 – Microsoft Windows Code Page for Western<br />
European languages.<br />
Windows 1253 – Microsoft Windows Code Page for Greek.<br />
Windows 1254 – Microsoft Windows Code Page for Turkish.<br />
Windows 1257 – Microsoft Windows Code Page for Baltic.<br />
Cp500 – EBCDIC 500 VI.<br />
Specific Type – Displays a priority level for SNMP traps. These<br />
types (with the exception of Automatic and <strong>OneSight</strong> User) are<br />
named to correspond with industry-accepted priority levels for<br />
SNMP traps.<br />
Note: An Empirix MIB can be imported into applications that<br />
process traps (such as your network management system) from<br />
the <strong>OneSight</strong> installation directory<br />
(empirix/onesight/mibs/onesight.mib). This MIB contains the<br />
appropriate information for <strong>OneSight</strong> trap types. Importing this<br />
MIB allows you to configure these types in your network<br />
management system.<br />
The following list describes the items in the Specific Type list:<br />
Automatic – This option associates the trap level specified<br />
with corresponding <strong>OneSight</strong> warning levels.<br />
<strong>OneSight</strong> – Critical – Defines this SNMP action as <strong>OneSight</strong><br />
Critical.<br />
Chapter 8: Creating Action Plans 673
Configuring Global Action Options<br />
<strong>OneSight</strong> – Major – Defines this SNMP action as <strong>OneSight</strong><br />
Major.<br />
<strong>OneSight</strong> – Minor – Defines this SNMP action as <strong>OneSight</strong><br />
Minor.<br />
<strong>OneSight</strong> – Warning – Defines this SNMP action as <strong>OneSight</strong><br />
Warning.<br />
<strong>OneSight</strong> – Normal – Defines this SNMP action as <strong>OneSight</strong><br />
Normal.<br />
<strong>OneSight</strong> – User – This option is reserved for a user-defined<br />
mapping of SNMP trap priority levels. User-defined<br />
information is added using the User Text box.<br />
User Text – Displays user-defined text when the Specific Type<br />
is <strong>OneSight</strong> User.<br />
Access Control Tab<br />
The Access Control tab lets you specify which user groups can<br />
read, write, or delete this action.<br />
Owner – The user group for this action. An action can be<br />
directly owned by a single user group.<br />
User Group – Displays the user group names.<br />
Global Read – Gives read access to this user group and all of its<br />
sub user groups.<br />
Read – Gives read permission to the user group.<br />
Write – Gives write permission to the user group.<br />
Delete – Gives delete permission to the user group.<br />
674 <strong>OneSight</strong> <strong>Administrator</strong> <strong>Guide</strong>
Configuring Global Action Options<br />
5. From the Message Template list, select a message template for<br />
the action. By default, <strong>OneSight</strong> selects the message template<br />
most appropriate for the specified action type. You can also<br />
create your own custom message templates. See Adding<br />
Message Templates for details.<br />
6. In the Escalation Timeout field, enter the amount of time (in<br />
minutes) for this action to exist before escalating to the next<br />
action in the action plan.<br />
7. Enter a reminder interval. This is the amount of time you want<br />
<strong>OneSight</strong> to wait before repeating this action.<br />
8. Enter the total counts. This is the number of times to repeat this<br />
action.<br />
9. In the SNMP Configuration section, enter the destination host<br />
and trap source for this action.<br />
10. From the Specific Type list, select the appropriate type for this<br />
action.<br />
11. If the Specific Type is <strong>OneSight</strong> User, enter a message for the<br />
user in the User Text box.<br />
12. Click Test to confirm that the information you entered will<br />
create a successful action.<br />
Note: The settings in the Global Options for this action type<br />
must be defined before a test of this action will succeed.<br />
13. Click OK.<br />
Triggering an SNMP Set Action<br />
The Simple Network Management Protocol (SNMP) Set action type<br />
lets you perform an SNMP set operation, setting a particular MIB<br />
Object ID (OID) to a specified value. For this action to work,<br />
Chapter 8: Creating Action Plans 675
Configuring Global Action Options<br />
change the SNMP community string rights to Read-Write in the<br />
SNMP Services Panel and restart the service.<br />
In the Action Manager, when you click SNMP Set in the Action<br />
Types list, the bottom portion of the dialog box displays options for<br />
configuring an SNMP Set action.<br />
To add an SNMP Set action:<br />
1. On the Action Plans page, click Global Actions.<br />
2. In the Global Action List Manager, click New.<br />
3. In the Action Manager - Add dialog box, enter a name for the<br />
action in the Name box.<br />
676 <strong>OneSight</strong> <strong>Administrator</strong> <strong>Guide</strong>
Configuring Global Action Options<br />
4. From the Action Type list box, choose the SNMP Set action<br />
type.<br />
Use the following options to specify how the SNMP action is<br />
configured:<br />
Name – Displays the common name for this action. This name<br />
is used to identify this action throughout the <strong>OneSight</strong> system.<br />
Action Type – Displays the current notification type.<br />
Escalation Timeout – Time (in minutes) before this action<br />
performs the next action in the list.<br />
Note: This box is required for creating actions. Enter the<br />
amount of time appropriate to the type of action you are<br />
configuring. Entering zero (0) in this box causes this action and<br />
the action following to execute simultaneously.<br />
Escalation time out for good state – when checked, use the<br />
escalation timeout for alerts associated with a return to good<br />
state.<br />
Chapter 8: Creating Action Plans 677
Configuring Global Action Options<br />
Reminder Interval – Amount of time (in minutes) to wait before<br />
repeating the action if the alert is still valid.<br />
Repeat for good state – when checked, applies to alerts<br />
associated with a return to good state.<br />
Total Counts – The total number of times to repeat this action.<br />
Test – Performs a test of this action as configured. You must<br />
enable this action type in Global Options before a test of this<br />
action will succeed.<br />
SNMP Set Configuration<br />
Host – The system where the specified SNMP Object ID’s<br />
value will be set. You can use the %SystemName% message<br />
template variable to specify the host.<br />
Port – The port on the specified host.<br />
Community – The community string is the SNMP community<br />
string authorized by the destination trap listener. The default<br />
SNMP community string for <strong>OneSight</strong> is public.<br />
OID – The OID that you want to set.<br />
Value – The value to set the SNMP Object ID’s value to. You<br />
can also use message template variables to specify the value.<br />
Data Type – The type of data.<br />
Access Control Tab<br />
The Access Control tab lets you specify which user groups can<br />
read, write, or delete this action.<br />
Owner – The user group for this action. An action can be<br />
directly owned by a single user group.<br />
678 <strong>OneSight</strong> <strong>Administrator</strong> <strong>Guide</strong>
Configuring Global Action Options<br />
User Group – Displays the user group names.<br />
Global Read – Gives read access to this user group and all of its<br />
sub user groups.<br />
Read – Gives read permission to the user group.<br />
Write – Gives write permission to the user group.<br />
Delete – Gives delete permission to the user group.<br />
5. In the Escalation Timeout field, enter the amount of time (in<br />
minutes) for this action to exist before escalating to the next<br />
action in the action plan.<br />
6. Enter a reminder interval. This is the amount of time you want<br />
<strong>OneSight</strong> to wait before repeating this action.<br />
7. Enter the total counts. This is the number of times to repeat this<br />
action.<br />
8. In the SNMP Set Configuration section, enter the host.<br />
9. Enter or click Browse to select the OID.<br />
10. Enter the value to which you want to set the OID.<br />
11. Select the type of data.<br />
12. Click Test to confirm that the information you entered will<br />
create a successful action.<br />
Note: The settings in the Global Options for this action type<br />
must be defined before a test of this action will succeed. In<br />
addition, the SNMP community string rights in the SNMP<br />
Services Panel must be changed to Read-Write and the service<br />
must be restarted.<br />
13. Click OK.<br />
Chapter 8: Creating Action Plans 679
Configuring Global Action Options<br />
Triggering a Delay Action<br />
The Delay action type lets you make the wait between actions more<br />
explicit. This action adds a delay period where nothing is done.<br />
To add a Delay action:<br />
1. On the Action Plans page, click Global Actions.<br />
2. In the Global Action List Manager, click New.<br />
3. In the Action Manager - Add dialog box, enter a name for the<br />
action in the Name box.<br />
680 <strong>OneSight</strong> <strong>Administrator</strong> <strong>Guide</strong>
Configuring Global Action Options<br />
4. From the Action Type list box, choose the Delay action type.<br />
Use the following options to specify how the Delay action is<br />
configured:<br />
Name – Displays the common name for this action. This name<br />
is used to identify this action throughout the <strong>OneSight</strong> system.<br />
Action Type – Displays the current notification type.<br />
Escalation Timeout – Time (in minutes) before this action<br />
performs the next action in the list.<br />
Note: This box is required for creating actions. Enter the<br />
amount of time appropriate to the type of action you are<br />
configuring. Entering zero (0) in this box causes this action and<br />
the action following to execute simultaneously.<br />
Escalation time out for good state – when checked, use the<br />
escalation timeout for alerts associated with a return to good<br />
state.<br />
Reminder Interval – Amount of time (in minutes) to wait before<br />
repeating the action if the alert is still valid.<br />
Chapter 8: Creating Action Plans 681
Configuring Global Action Options<br />
Repeat for good state – when checked, applies to alerts<br />
associated with a return to good state.<br />
Total Counts – The total number of times to repeat this action.<br />
Test – Performs a test of this action as configured.<br />
Access Control Tab<br />
The Access Control tab lets you specify which user groups can<br />
read, write, or delete this action.<br />
Owner – The user group for this action. An action can be<br />
directly owned by a single user group.<br />
User Group – Displays the user group names.<br />
Global Read – Gives read access to this user group and all of its<br />
sub user groups.<br />
Read – Gives read permission to the user group.<br />
Write – Gives write permission to the user group.<br />
Delete – Gives delete permission to the user group.<br />
5. In the Escalation Timeout field, enter the amount of time (in<br />
minutes) for this action to exist before escalating to the next<br />
action in the action plan.<br />
6. Enter a reminder interval. This is the amount of time you want<br />
<strong>OneSight</strong> to wait before repeating this action.<br />
7. Enter the total counts. This is the number of times to repeat this<br />
action.<br />
682 <strong>OneSight</strong> <strong>Administrator</strong> <strong>Guide</strong>
Configuring Global Action Options<br />
8. Click Test to confirm that the information you entered will<br />
create a successful action.<br />
9. Click OK.<br />
Triggering a Monitor Action<br />
The Monitor action lets you enable or disable a monitor based on an<br />
event. For example, you could start a monitor that does additional<br />
checks when a problem occurs, or you could disable a monitor that<br />
should not be running under certain conditions.<br />
In the Action Manager, when you click Monitor in the Action<br />
Types list, the bottom portion of the dialog box displays options for<br />
configuring a Monitor action.<br />
To add Monitor action:<br />
1. On the Action Plans page, click Global Actions.<br />
2. In the Global Action List Manager, click New.<br />
Chapter 8: Creating Action Plans 683
Configuring Global Action Options<br />
3. In the Action Manager - Add dialog box, enter a name for the<br />
action in the Name box.<br />
4. From the Action Type list box, choose the Monitor action type.<br />
Use the following options to specify how the Monitor action is<br />
configured:<br />
Name – Displays the common name for this action. This name<br />
is used to identify this action throughout the <strong>OneSight</strong> system.<br />
Action Type – Displays the current notification type.<br />
Escalation Timeout – Time (in minutes) before this action<br />
performs the next action in the list.<br />
Note: This box is required for creating actions. Enter the<br />
amount of time appropriate to the type of action you are<br />
configuring. Entering zero (0) in this box causes this action and<br />
the action following to execute simultaneously.<br />
684 <strong>OneSight</strong> <strong>Administrator</strong> <strong>Guide</strong>
Configuring Global Action Options<br />
Escalation time out for good state – when checked, use the<br />
escalation timeout for alerts associated with a return to good<br />
state.<br />
Reminder Interval – Amount of time (in minutes) to wait before<br />
repeating the action if the alert is still valid.<br />
Repeat for good state – when checked, applies to alerts<br />
associated with a return to good state.<br />
Total Counts – The total number of times to repeat this action.<br />
Test – Performs a test of this action as configured. You must<br />
enable this action type in Global Options before a test of this<br />
action will succeed.<br />
Monitor Configuration<br />
– Select the monitor or monitor group that<br />
you want to enable or disable.<br />
Enable – Select this option to start the selected monitors<br />
when this action occurs. Deselect this option to stop the<br />
selected monitors when this action occurs.<br />
Access Control Tab<br />
The Access Control tab lets you specify which user groups can<br />
read, write, or delete this action.<br />
Owner – The user group for this action. An action can be<br />
directly owned by a single user group.<br />
User Group – Displays the user group names.<br />
Global Read – Gives read access to this user group and all of its<br />
sub user groups.<br />
Read – Gives read permission to the user group.<br />
Chapter 8: Creating Action Plans 685
Configuring Global Action Options<br />
Write – Gives write permission to the user group.<br />
Delete – Gives delete permission to the user group.<br />
5. In the Escalation Timeout field, enter the amount of time (in<br />
minutes) for this action to exist before escalating to the next<br />
action in the action plan.<br />
6. Enter a reminder interval. This is the amount of time you want<br />
<strong>OneSight</strong> to wait before repeating this action.<br />
7. Enter the total counts. This is the number of times to repeat this<br />
action.<br />
8. In the Monitor Configuration section select the monitor or<br />
monitor group that you want to start or stop as a result of this<br />
action.<br />
9. Select enable to start the monitor or monitor group. Deselect<br />
enable to stop the monitor or monitor group as a result of this<br />
action.<br />
10. Click Test to confirm that the information you entered will<br />
create a successful action.<br />
11. Click OK.<br />
Triggering a Socket Connection Action<br />
The Socket Connection action lets you open a socket and send a<br />
message.<br />
In the Action Manager, when you click Socket Connection in the<br />
Action Types list, the bottom portion of the dialog box displays<br />
options for configuring a Socket Connection action.<br />
686 <strong>OneSight</strong> <strong>Administrator</strong> <strong>Guide</strong>
Configuring Global Action Options<br />
To add a Socket Connection action:<br />
1. On the Action Plans page, click Global Actions.<br />
2. In the Global Action List Manager, click New.<br />
3. In the Action Manager - Add dialog box, enter a name for the<br />
action in the Name box.<br />
Chapter 8: Creating Action Plans 687
Configuring Global Action Options<br />
4. From the Action Type list box, choose the Socket Connection<br />
action type.<br />
Use the following options to specify how the Socket<br />
Connection action is configured:<br />
Name – Displays the common name for this action. This name<br />
is used to identify this action throughout the <strong>OneSight</strong> system.<br />
Action Type – Displays the current notification type.<br />
Escalation Timeout – Time (in minutes) before this action<br />
performs the next action in the list.<br />
Note: This box is required for creating actions. Enter the<br />
amount of time appropriate to the type of action you are<br />
configuring. Entering zero (0) in this box causes this action and<br />
the action following to execute simultaneously.<br />
Escalation time out for good state – when checked, use the<br />
escalation timeout for alerts associated with a return to good<br />
state.<br />
688 <strong>OneSight</strong> <strong>Administrator</strong> <strong>Guide</strong>
Configuring Global Action Options<br />
Reminder Interval – Amount of time (in minutes) to wait before<br />
repeating the action if the alert is still valid.<br />
Repeat for good state – when checked, applies to alerts<br />
associated with a return to good state.<br />
Total Counts – The total number of times to repeat this action.<br />
Test – Performs a test of this action as configured. You must<br />
enable this action type in Global Options before a test of this<br />
action will succeed.<br />
Socket Connection Configuration<br />
Remote Host – Enter the remote host to which you want to<br />
send a message.<br />
Port – Enter the port.<br />
Text to Send – Enter the text to send.<br />
Access Control Tab<br />
The Access Control tab lets you specify which user groups can<br />
read, write, or delete this action.<br />
Owner – The user group for this action. An action can be<br />
directly owned by a single user group.<br />
User Group – Displays the user group names.<br />
Global Read – Gives read access to this user group and all of its<br />
sub user groups.<br />
Read – Gives read permission to the user group.<br />
Write – Gives write permission to the user group.<br />
Delete – Gives delete permission to the user group.<br />
Chapter 8: Creating Action Plans 689
Configuring Global Action Options<br />
5. In the Escalation Timeout field, enter the amount of time (in<br />
minutes) for this action to exist before escalating to the next<br />
action in the action plan.<br />
6. Enter a reminder interval. This is the amount of time you want<br />
<strong>OneSight</strong> to wait before repeating this action.<br />
7. Enter the total counts. This is the number of times to repeat this<br />
action.<br />
8. In the Socket Connection Configuration section enter the<br />
remote host.<br />
9. Enter the port to use.<br />
10. Enter the text to send.<br />
11. Click Test to confirm that the information you entered will<br />
create a successful action.<br />
12. Click OK.<br />
Triggering a HTTP Post/Get Action<br />
The HTTP Post/Get action lets do a Get or Post using HTTP<br />
Protocol.<br />
In the Action Manager, when you click HTTP Post/Get in the<br />
Action Types list, the bottom portion of the dialog box displays<br />
options for configuring an HTTP Post/Get action.<br />
690 <strong>OneSight</strong> <strong>Administrator</strong> <strong>Guide</strong>
Configuring Global Action Options<br />
To add an HTTP Post/Get action:<br />
1. On the Action Plans page, click Global Actions.<br />
2. In the Global Action List Manager, click New.<br />
3. In the Action Manager - Add dialog box, enter a name for the<br />
action in the Name box.<br />
Chapter 8: Creating Action Plans 691
Configuring Global Action Options<br />
4. From the Action Type list box, choose the HTTP Post/Get action<br />
type.<br />
Use the following options to specify how the HTTP Post/Get<br />
action is configured:<br />
Name – Displays the common name for this action. This name<br />
is used to identify this action throughout the <strong>OneSight</strong> system.<br />
Action Type – Displays the current notification type.<br />
Escalation Timeout – Time (in minutes) before this action<br />
performs the next action in the list.<br />
Note: This box is required for creating actions. Enter the<br />
amount of time appropriate to the type of action you are<br />
configuring. Entering zero (0) in this box causes this action and<br />
the action following to execute simultaneously.<br />
Escalation time out for good state – when checked, use the<br />
escalation timeout for alerts associated with a return to good<br />
state.<br />
Reminder Interval – Amount of time (in minutes) to wait before<br />
repeating the action if the alert is still valid.<br />
692 <strong>OneSight</strong> <strong>Administrator</strong> <strong>Guide</strong>
Configuring Global Action Options<br />
Repeat for good state – when checked, applies to alerts<br />
associated with a return to good state.<br />
Total Counts – The total number of times to repeat this action.<br />
Test – Performs a test of this action as configured. You must<br />
enable this action type in Global Options before a test of this<br />
action will succeed.<br />
HTTP Post/Get Configuration<br />
Web URL – Enter the URL of the web site.<br />
Type of request – Select whether you want to do a get or post.<br />
Message to Post – This field is available when the type of<br />
request is Post. Enter the message to post.<br />
Note: name/value pairs can be defined by name=value,<br />
separated by an ampersand (&). For example,<br />
param_from=onesight¶m_msg=timeout. The<br />
name/value pairs posted can be processed by the remote<br />
server which receives the post.<br />
Access Control Tab<br />
The Access Control tab lets you specify which user groups can<br />
read, write, or delete this action.<br />
Owner – The user group for this action. An action can be<br />
directly owned by a single user group.<br />
User Group – Displays the user group names.<br />
Global Read – Gives read access to this user group and all of its<br />
sub user groups.<br />
Read – Gives read permission to the user group.<br />
Chapter 8: Creating Action Plans 693
Configuring Global Action Options<br />
Write – Gives write permission to the user group.<br />
Delete – Gives delete permission to the user group.<br />
5. In the Escalation Timeout field, enter the amount of time (in<br />
minutes) for this action to exist before escalating to the next<br />
action in the action plan.<br />
6. Enter a reminder interval. This is the amount of time you want<br />
<strong>OneSight</strong> to wait before repeating this action.<br />
7. Enter the total counts. This is the number of times to repeat this<br />
action.<br />
8. In the HTTP Post/Get Configuration section enter the URL to do<br />
a post or get against.<br />
9. Select the type of request.<br />
10. For a post action, enter the message to post.<br />
Note: name/value pairs can be defined by name=value,<br />
separated by an ampersand (&). For example,<br />
param_from=onesight¶m_msg=timeout. The name/value<br />
pairs posted can be processed by the remote server which<br />
receives the post.<br />
11. Click Test to confirm that the information you entered will<br />
create a successful action.<br />
12. Click OK.<br />
Triggering a Syslog Action<br />
The Syslog action lets you log a message to a Syslog deamon.<br />
Note that the syslog on a Unix/Linux machine does not accept<br />
remote syslogs by default. You must change the configuration to<br />
694 <strong>OneSight</strong> <strong>Administrator</strong> <strong>Guide</strong>
Configuring Global Action Options<br />
enable it. Different Unix/Linux implementations may require<br />
different steps to enable remote syslogs. Following is an example:<br />
Vi /etc/syslog-ng/syslog-ng.conf<br />
Uncomment the following line to make it listen on port 514:<br />
#udp(ip(“10.12.34.110”) port(514));<br />
Restart the syslog-ng service:<br />
Syslog-ng –f /etc/syslog-ng/syslog-ng.conf<br />
In the Action Manager, when you click Syslog in the Action Types<br />
list, the bottom portion of the dialog box displays options for<br />
configuring a Syslog action.<br />
To add a Syslog action:<br />
1. On the Action Plans page, click Global Actions.<br />
2. In the Global Action List Manager, click New.<br />
Chapter 8: Creating Action Plans 695
Configuring Global Action Options<br />
3. In the Action Manager - Add dialog box, enter a name for the<br />
action in the Name box.<br />
4. From the Action Type list box, choose the Syslog action type.<br />
Use the following options to specify how the Syslog action is<br />
configured:<br />
Name – Displays the common name for this action. This name<br />
is used to identify this action throughout the <strong>OneSight</strong> system.<br />
Action Type – Displays the current notification type.<br />
Escalation Timeout – Time (in minutes) before this action<br />
performs the next action in the list.<br />
Note: This box is required for creating actions. Enter the<br />
amount of time appropriate to the type of action you are<br />
configuring. Entering zero (0) in this box causes this action and<br />
the action following to execute simultaneously.<br />
Escalation time out for good state – when checked, use the<br />
escalation timeout for alerts associated with a return to good<br />
state.<br />
696 <strong>OneSight</strong> <strong>Administrator</strong> <strong>Guide</strong>
Configuring Global Action Options<br />
Reminder Interval – Amount of time (in minutes) to wait before<br />
repeating the action if the alert is still valid.<br />
Repeat for good state – when checked, applies to alerts<br />
associated with a return to good state.<br />
Total Counts – The total number of times to repeat this action.<br />
Test – Performs a test of this action as configured. You must<br />
enable this action type in Global Options before a test of this<br />
action will succeed.<br />
Syslog Configuration<br />
Syslog Host – Enter the name or IP address of the machine<br />
where the syslog deamon is running.<br />
Message to Send – Enter the message to log. Note that<br />
substitution variables cannot be used here.<br />
Access Control Tab<br />
The Access Control tab lets you specify which user groups can<br />
read, write, or delete this action.<br />
Owner – The user group for this action. An action can be<br />
directly owned by a single user group.<br />
User Group – Displays the user group names.<br />
Global Read – Gives read access to this user group and all of its<br />
sub user groups.<br />
Read – Gives read permission to the user group.<br />
Write – Gives write permission to the user group.<br />
Delete – Gives delete permission to the user group.<br />
Chapter 8: Creating Action Plans 697
Configuring Global Action Options<br />
5. In the Escalation Timeout field, enter the amount of time (in<br />
minutes) for this action to exist before escalating to the next<br />
action in the action plan.<br />
6. Enter a reminder interval. This is the amount of time you want<br />
<strong>OneSight</strong> to wait before repeating this action.<br />
7. Enter the total counts. This is the number of times to repeat this<br />
action.<br />
8. In the Syslog Configuration section enter the name or IP<br />
address of the machine where the syslog deamon is running.<br />
9. Enter the message to log.<br />
10. Click Test to confirm that the information you entered will<br />
create a successful action.<br />
11. Click OK.<br />
Configuring Global Action Options<br />
The Global Action Manager displays currently configured actions.<br />
Use this dialog box to configure individual actions or responses for<br />
use within your e-business system. The actions you configure are<br />
used to perform specific tasks—such as e-mail alerts, or scripting<br />
actions—when associated with action plans, profiles, and monitor<br />
group health.<br />
698 <strong>OneSight</strong> <strong>Administrator</strong> <strong>Guide</strong>
Configuring Global Action Options<br />
Note: When you change a global action, this affects all action plans<br />
that use it.<br />
Clicking New or Modify from the Global Action Manager displays<br />
the Action Manager for that action type. From the Action Manager,<br />
actions can be created or modified to accomplish specific results.<br />
You can make modifications to actions at any time; changes made<br />
to the configuration of actions affect all action plans, except the<br />
plans currently in use by the <strong>OneSight</strong> Console.<br />
Chapter 8: Creating Action Plans 699
Configuring Global Action Options<br />
Use this dialog box to configure properties that affect all actions.<br />
The Global Action Options dialog box includes tabs for global<br />
options such as e-mail and scripting.<br />
Before an action type is available for use in an action plan, it must<br />
be enabled in the Global Action Options dialog box. The exception<br />
is e-mail actions, which are enabled by default. To enable actions<br />
and notification types, click the Enable check box for the specified<br />
type and complete any configuration information for that action<br />
type.<br />
Configuring Global Email Actions<br />
To configure global e-mail options:<br />
1. On the Action Plans page, click Global Actions.<br />
2. On the Global Action Manager page, click Global Options.<br />
3. In the Global Actions Options dialog box, click the E-Mail tab.<br />
Configure properties for all e-mail actions. From this tab you<br />
can define the primary and backup e-mail servers, identify the<br />
sender address for e-mail notifications, enable message<br />
700 <strong>OneSight</strong> <strong>Administrator</strong> <strong>Guide</strong>
Configuring Global Action Options<br />
consolidation for e-mail notifications, and disable e-mail<br />
messaging, if necessary (e-mail notifications are enabled by<br />
default).<br />
Enable E-mail Notification – E-mail actions are enabled by<br />
default. To disable e-mail actions, clear this check box.<br />
Require User Authentication – SMTP authentication will be<br />
required.<br />
Servers Settings<br />
E-Mail Server – Displays the machine name of the primary host<br />
server for e-mail. For example: mailhost.company.com. For more<br />
information, see Configuring the Mail Server.<br />
Backup E-Mail Server – Displays the machine name of the<br />
backup host server for e-mail. For example:<br />
backup.company.com. For more information, see Configuring the<br />
Mail Server.<br />
Identification Settings<br />
Sender’s Address – Defines the address to be displayed when<br />
an e-mail notification arrives at the destination address. For<br />
instance, defining the Sender’s Address as<br />
<strong>OneSight</strong>_team@company.com quickly alerts the recipient that<br />
the message is about the health of the system.<br />
Account Name – Type the name of the user account to which<br />
the message will be sent (for example, mailtest). This should<br />
be the account name for the e-mail address that you specified<br />
in the Sender’s Address box. This field is only available<br />
when Require User Authentication is selected.<br />
Password – Enter the password for SMTP authentication.<br />
This field is only available when Require User<br />
Authentication is selected.<br />
Chapter 8: Creating Action Plans 701
Configuring Global Action Options<br />
This server requires a secure connection (SSL) – Select this<br />
checkbox if the server requires an encrypted connection. The<br />
target email server must be using SSL and you must place the<br />
mail server trust certificate into the .keystore file in the<br />
<strong>OneSight</strong> installation directory. This field is only available<br />
when Require User Authentication is selected.<br />
Message Consolidation Settings<br />
Enable Consolidation – Consolidates e-mail actions that are<br />
configured to use the same e-mail address (for example, any e-<br />
mail action type addressed to: it_manager@company.com).<br />
Multiple actions may be triggered due to a cascading system<br />
failure or a recurring problem. Select this option to reduce the<br />
number of e-mail notifications delivered during a critical<br />
period. Since a single action can be used by multiple action<br />
plans, the frequency of notifications is potentially high.<br />
When the Enable Consolidation check box is cleared, the<br />
recipient receives a notification each time an action is triggered<br />
by the system. When Enable Consolidation check box is<br />
selected, the recipient receives the first notification, then<br />
<strong>OneSight</strong> consolidates all notifications for the interval time<br />
specified in the Consolidation Interval box, and notifies the<br />
recipient each time the interval time has expired. The body of<br />
the message includes the highest priority notification received<br />
during this interval.<br />
An example consolidation message is:<br />
Subject: CPU overloaded, long run queue (user_nt)<br />
<strong>OneSight</strong> Warning Alert.<br />
CPU overloaded, long run queue: Value was 16<br />
processes, threshold is 4<br />
processes (4/4/00 6:17 PM)<br />
Component: user_nt<br />
Event: CPU overloaded, long run queue<br />
Metric: Processes: Run Queue Length<br />
Monitor: Windows NT 4 (user_nt)<br />
702 <strong>OneSight</strong> <strong>Administrator</strong> <strong>Guide</strong>
Configuring Global Action Options<br />
Monitor Group: User Monitor Group<br />
Description: Number of processes in the run queue<br />
Note: Selecting this check box sets message consolidation for<br />
all e-mail notifications. If a cascading system failure occurs, e-<br />
mail notifications will still be sent; however, they will be<br />
consolidated for the interval specified. To disable e-mail<br />
notifications entirely during a critical period, clear the Enable<br />
E-Mail Notification check box.<br />
Consolidation Interval (minutes) – Displays the amount of time<br />
(in minutes) that messages are consolidated before being sent to<br />
the recipient. The first notification is delivered prior to the<br />
consolidation time period. When the time period expires, a<br />
single (consolidated) notification is delivered, and the<br />
consolidation interval is reset.<br />
Note: To ensure that the most important notifications are<br />
delivered, even with message consolidation turned on, <strong>OneSight</strong><br />
will interrupt the consolidation interval if a higher priority alert<br />
is encountered during the consolidation period.<br />
4. To enable e-mail notifications, select the Enable E-mail<br />
Notification check box.<br />
5. Under Servers, enter the machine names of the primary and<br />
backup e-mail servers.<br />
6. Under Identification, enter the return address in the Sender’s<br />
Address field. This e-mail address may be used for reply mail,<br />
as well as to alert the recipient of either the nature of the<br />
message or the source of the message generation (for example,<br />
<strong>OneSight</strong>_mgr@company.com).<br />
7. Under Message Consolidation, select the Enable Consolidation<br />
check box to activate this feature. Selecting this check box<br />
enables the <strong>OneSight</strong> system to manage the number of potential<br />
messages a recipient receives as a result of a given alert. Set the<br />
consolidation interval as appropriate.<br />
Chapter 8: Creating Action Plans 703
Configuring Global Action Options<br />
8. Click OK to preserve these settings.<br />
Configuring the Mail Server<br />
A mail server must be configured for email notification to work.<br />
Note: If you configure the mail server specification on a <strong>OneSight</strong><br />
server with a name that that includes an underscore (for example,<br />
onesight_server), you should confirm that that e-mail alerts<br />
continue to function after making this change. If your server<br />
validates host names according to RFC 810 (most servers do not), a<br />
<strong>OneSight</strong> server name containing an underscore may be rejected.<br />
To configure the mail server, complete the following steps:<br />
1. On the Configure Action Plans page, click Global Actions.<br />
2. One the Global Action Manager page, click Global Options.<br />
3. In the Global Action Options dialog box, click the E-Mail tab.<br />
4. Under Servers, enter the domain names of the primary and<br />
backup SMTP mail servers to use when sending e-mail.<br />
Note: When specifying the primary or backup mail servers, use<br />
the SMTP port designated by your company. If you do not<br />
specify a port number, the default SMTP port number (port 25)<br />
is used. If you are unsure of your company’s mail server<br />
domain names or SMTP port number, contact your System<br />
<strong>Administrator</strong>.<br />
5. Click OK to preserve these settings.<br />
To use an SMTP port other than the standard port used for mail,<br />
complete the following steps:<br />
1. In the Global Action Options dialog box, click the E-Mail tab.<br />
704 <strong>OneSight</strong> <strong>Administrator</strong> <strong>Guide</strong>
Configuring Global Action Options<br />
2. Under Servers, specify the port number following the server<br />
name (separated by a colon), where is the nonstandard<br />
port. For example: mailhost.company.com:<br />
3. If you are using the default SMTP port 25, you do not need to<br />
specify it in this box.<br />
4. Click OK to preserve these settings.<br />
Configuring Global Incoming E-Mail Options<br />
Use the Incoming E-Mail tab to configure the e-mail account that<br />
will be monitored for replies to e-mail actions. <strong>OneSight</strong> will not<br />
monitor the e-mail server if there are no outstanding action plans.<br />
If <strong>OneSight</strong> cannot connect to the email server, it will write a<br />
message to the <strong>OneSight</strong> log.<br />
Note: If you are using Microsoft Outlook, line breaks may be<br />
removed, resulting in poorly formatted alert text. To make Outlook<br />
stop removing extra line breaks:<br />
1. Select Options from the Tools menu in Outlook.<br />
2. Click the E-mail Options button on the Preferences tab.<br />
3. Uncheck Remove extra line breaks in plain text messages.<br />
Chapter 8: Creating Action Plans 705
Configuring Global Action Options<br />
4. Click OK.<br />
Accept e-mail responses – Select this check box to enable incoming<br />
e-mail actions.<br />
E-Mail Server (POP) – Enter the e-mail server. For example,<br />
server.empirix.com. To specify an alternate port for the server,<br />
append the port number to the server name. For example,<br />
server.empirix.com:995.<br />
Account Name – Enter the user name of the account.<br />
Password – Enter the password for the account.<br />
This server requires a secure connections (SSL) – Select this check<br />
box if the server requires a secure connection.<br />
Configuring Global Scripting Options<br />
Use the Scripting tab to configure properties that affect all scripting<br />
actions.<br />
706 <strong>OneSight</strong> <strong>Administrator</strong> <strong>Guide</strong>
Modifying An Action Plan<br />
Enable Scripting Actions – Select this check box to enable scripting<br />
actions for the <strong>OneSight</strong> system.<br />
Modifying An Action Plan<br />
An action plan specifies a sequence of actions that you want<br />
<strong>OneSight</strong> to perform if a monitor detects a problem that triggers an<br />
alert. To modify an existing action plan, complete the following<br />
steps:<br />
1. On the Action Plans page, highlight an existing plan, and then<br />
click Modify.<br />
Chapter 8: Creating Action Plans 707
Modifying An Action Plan<br />
2. In the Action Plans - Modify dialog box, change the name for<br />
the plan, if necessary.<br />
Note: If an action plan is in use by a monitored web component,<br />
the value in the Name box cannot be edited.<br />
3. Click Add in the Schedules for this Action Plan section to add<br />
more time intervals to the plan, or select a time interval and<br />
click Remove to delete the time interval from the plan.<br />
4. Select a time interval and click Add in the Actions for this<br />
Schedule section to include additional actions in the plan or<br />
click Modify to edit an existing action.<br />
Caution: When you edit an existing action, this change applies<br />
to every action plan with which it is associated.<br />
5. Click Remove to delete an action from the list.<br />
6. When you are finished modifying the action plan, click OK in<br />
the Global Action List Manager.<br />
7. In the Action Plan - Modify dialog box, use the arrow buttons to<br />
reorder the actions in the plan, if necessary.<br />
8. Click OK. The modified plan appears in the Action Plans list.<br />
Modifying an Email Action<br />
To modify an email action:<br />
1. On the Action Plans page, click Global Actions.<br />
708 <strong>OneSight</strong> <strong>Administrator</strong> <strong>Guide</strong>
Modifying An Action Plan<br />
2. In the Global Action List Manager, select an e-mail action and<br />
click Modify.<br />
3. In the Action Manager - Modify dialog box, change the name<br />
for the action in the Name box if appropriate.<br />
4. From the Message Template list, select a message template for<br />
the action. By default, <strong>OneSight</strong> selects the message template<br />
most appropriate for the specified action type. You can also<br />
create your own custom message templates. See Adding<br />
Message Templates for details.<br />
5. Enter an escalation timeout value.<br />
6. Enter a reminder interval and total count.<br />
7. Under E-Mail Configuration, either select Address to enter the<br />
e-mail address of the person(s) to notify when the action is<br />
executed, separating email addresses with a space,. Or select<br />
System User to choose the user from the list of <strong>OneSight</strong> users.<br />
8. Click Test to confirm that the information you entered will<br />
create a successful action.<br />
Note: The settings in the Global Options for this action type<br />
must be defined before a test of this action will succeed.<br />
Chapter 8: Creating Action Plans 709
Modifying An Action Plan<br />
9. Click OK.<br />
Modifying a Scripting Action<br />
Note: If you are running a script on a remote machine, that machine<br />
must have either a Data Collector or Remote Agent installed.<br />
To modify a scripting action:<br />
1. On the Action Plans page, click Global Actions.<br />
2. In the Global Actions List Manager, select an existing scripting<br />
action and click Modify.<br />
3. In the Action Manager - Modify dialog box, modify the name<br />
for the action in the Name box, if necessary.<br />
4. Enter a value in the Escalation Timeout box.<br />
5. Enter reminder interval and total count.<br />
6. In the Scripting Configuration section, modify the path field if<br />
necessary.<br />
710 <strong>OneSight</strong> <strong>Administrator</strong> <strong>Guide</strong>
Modifying An Action Plan<br />
7. In the Parameters field, modify any parameters necessary for<br />
this script. You can also include Message Template Variables<br />
as script parameters.<br />
8. In the Environment Settings field, modify the environment<br />
variables as necessary. You can also include Message<br />
Template Variables as values for environment variables.<br />
9. Click Test to confirm that the information you entered will<br />
create a successful action.<br />
Note: The settings in the Global Options for this action type<br />
must be defined before a test of this action will succeed.<br />
10. Click OK.<br />
Modifying an SNMP Action<br />
To modify an SNMP action:<br />
1. On the Action Plans page, click Global Actions.<br />
Chapter 8: Creating Action Plans 711
Modifying An Action Plan<br />
2. In the Global Actions List Manager, select an existing SNMP<br />
action and click Modify.<br />
3. In the Action Manager - Modify dialog box, change the name<br />
for the action in the Name box, if necessary.<br />
4. From the Message Template list, select a message template for<br />
the action. By default, <strong>OneSight</strong> selects the message template<br />
most appropriate for the specified action type. You can also<br />
create your own custom message templates. See Adding<br />
Message Templates for details.<br />
5. In the Escalation Timeout box, enter the amount of time (in<br />
minutes) for this action to exist before escalating to the next<br />
action in the Action Plan.<br />
6. Enter a reminder interval and total count.<br />
7. In the SNMP Configuration section, enter the new destination<br />
host and trap source for this action, as required.<br />
8. In the Specific Type box, select the action type for this action.<br />
712 <strong>OneSight</strong> <strong>Administrator</strong> <strong>Guide</strong>
Modifying An Action Plan<br />
9. If the Specific Type is <strong>OneSight</strong> User, enter a message for the<br />
user in the User Text box.<br />
10. Click Test to confirm that the information you entered will<br />
create a successful action.<br />
Note: The settings in the Global Options for this action type<br />
must be defined before a test of this action will succeed.<br />
11. Click OK.<br />
Modifying an SNMP Set Action<br />
To modify an SNMP set action:<br />
1. On the Action Plans page, click Global Actions.<br />
2. In the Global Actions List Manager, select an existing SNMP set<br />
action and click Modify.<br />
Chapter 8: Creating Action Plans 713
Modifying An Action Plan<br />
3. In the Action Manager - Modify dialog box, change the name<br />
for the action in the Name box, if necessary.<br />
4. In the Escalation Timeout box, enter the amount of time (in<br />
minutes) for this action to exist before escalating to the next<br />
action in the Action Plan.<br />
5. Enter a reminder interval and total count.<br />
6. In the SNMP Set Configuration section, enter the host and port,<br />
as required.<br />
7. Enter or select the new OID, value and data type.<br />
8. Click Test to confirm that the information you entered will<br />
create a successful action.<br />
Note: The settings in the Global Options for this action type<br />
must be defined before a test of this action will succeed. In<br />
addition, the SNMP community string rights in the SNMP<br />
Services Panel must be changed to Read-Write and the service<br />
must be restarted.<br />
9. Click OK.<br />
Modifying a Delay Action<br />
To modify a delay action:<br />
1. On the Action Plans page, click Global Actions.<br />
714 <strong>OneSight</strong> <strong>Administrator</strong> <strong>Guide</strong>
Modifying An Action Plan<br />
2. In the Global Action List Manager, select an delay action and<br />
click Modify.<br />
3. In the Action Manager - Modify dialog box, change the name<br />
for the action in the Name box if appropriate.<br />
4. Enter an escalation timeout value.<br />
5. Enter a reminder interval and total count.<br />
6. Click Test to confirm that the information you entered will<br />
create a successful action.<br />
7. Click OK.<br />
Modifying a Monitor Action<br />
To modify a monitor action:<br />
1. On the Action Plans page, click Global Actions.<br />
Chapter 8: Creating Action Plans 715
Modifying An Action Plan<br />
2. In the Global Action List Manager, select an e-mail action and<br />
click Modify.<br />
3. In the Action Manager - Modify dialog box, change the name<br />
for the action in the Name box if appropriate.<br />
4. From the Message Template list, select a message template for<br />
the action. By default, <strong>OneSight</strong> selects the message template<br />
most appropriate for the specified action type. You can also<br />
create your own custom message templates. See Adding<br />
Message Templates for details.<br />
5. Enter an escalation timeout value.<br />
6. Enter a reminder interval and total count.<br />
7. Under Monitor Configuration section, select or deselect a<br />
monitor or monitor group.<br />
8. Click Test to confirm that the information you entered will<br />
create a successful action.<br />
716 <strong>OneSight</strong> <strong>Administrator</strong> <strong>Guide</strong>
Modifying An Action Plan<br />
9. Click OK.<br />
Modifying a Socket Connection Action<br />
To modify a socket connection action:<br />
1. On the Action Plans page, click Global Actions.<br />
2. In the Global Action List Manager, select a socket connection<br />
action and click Modify.<br />
3. In the Action Manager - Modify dialog box, change the name<br />
for the action in the Name box if appropriate.<br />
4. Enter an escalation timeout value.<br />
5. Enter a reminder interval and total count.<br />
6. Under Socket Connection Configuration section, enter the name<br />
or IP address of the remote host.<br />
7. Enter the port.<br />
8. Enter the text to send.<br />
Chapter 8: Creating Action Plans 717
Modifying An Action Plan<br />
9. Click Test to confirm that the information you entered will<br />
create a successful action.<br />
10. Click OK.<br />
Modifying an HTTP Post/Get Action<br />
To modify an HTTP Post/Get action:<br />
1. On the Action Plans page, click Global Actions.<br />
2. In the Global Action List Manager, select an HTTP Post/Get<br />
action and click Modify.<br />
3. In the Action Manager - Modify dialog box, change the name<br />
for the action in the Name box if appropriate.<br />
4. Enter an escalation timeout value.<br />
5. Enter a reminder interval and total count.<br />
6. Under HTTP Post/Get Configuration section, enter the URL.<br />
7. Select the type of request.<br />
718 <strong>OneSight</strong> <strong>Administrator</strong> <strong>Guide</strong>
Modifying An Action Plan<br />
8. For post requests, enter the message to post.<br />
Note: name/value pairs can be defined by name=value,<br />
separated by an ampersand (&). For example,<br />
param_from=onesight¶m_msg=timeout. The name/value<br />
pairs posted can be processed by the remote server which<br />
receives the post.<br />
9. Click Test to confirm that the information you entered will<br />
create a successful action.<br />
10. Click OK.<br />
Modifying a Syslog Action<br />
To modify a syslog action:<br />
1. On the Action Plans page, click Global Actions.<br />
2. In the Global Action List Manager, select a syslog action and<br />
click Modify.<br />
3. In the Action Manager - Modify dialog box, change the name<br />
for the action in the Name box if appropriate.<br />
4. Enter an escalation timeout value.<br />
Chapter 8: Creating Action Plans 719
Retiring an Action Plan<br />
5. Enter a reminder interval and total count.<br />
6. Under Syslog Configuration section, enter the name or IP<br />
address of the host.<br />
7. Enter the message to send.<br />
8. Click Test to confirm that the information you entered will<br />
create a successful action.<br />
9. Click OK.<br />
Retiring an Action Plan<br />
When you manually terminate the action plan and click Retire, you<br />
can add a note as part of the retirement process. This feature allows<br />
you to add your own information to the action plan’s historical<br />
record. You can review this text in the Action Plan History report.<br />
Action Plans Not Associated With an Alert<br />
You can schedule action plans for specific actions that are not<br />
associated with an alert. For example, if you want to launch a script<br />
to reboot a server on a regularly scheduled basis, or if you want a<br />
schedule so that you receive a page confirming that the <strong>OneSight</strong><br />
server is running, you can set up an action plan and then schedule it.<br />
720 <strong>OneSight</strong> <strong>Administrator</strong> <strong>Guide</strong>
Action Plans Not Associated With an Alert<br />
To schedule an action plan click the Schedule button on the Action<br />
Plan page.<br />
Use this dialog box to disable a scheduled action plan, run an action<br />
plan only once, or schedule a repeated action.<br />
Begin at – The list of options for beginning action plans consists of<br />
a 24-hour range in fifteen minute increments.<br />
Do once – To configure a single action plan occurrence, click this<br />
button and specify a date.<br />
Repeat – To configure a regularly scheduled action plan, click this<br />
button and configure the time that the action plan should be<br />
scheduled. You can schedule an action plan that occurs every day,<br />
every week, or every month.<br />
Every Hour – select a minute of the hour for the hourly action<br />
plan.<br />
Every Day – no additional detail is required.<br />
Every Week on day – select a day (Sunday through Saturday) for<br />
the weekly action plan.<br />
Every Month on day – select a day (1 through 31) for the monthly<br />
action plan.<br />
Chapter 8: Creating Action Plans 721
Action Plans Not Associated With an Alert<br />
[This page intentionally left blank.]<br />
722 <strong>OneSight</strong> <strong>Administrator</strong> <strong>Guide</strong>
C h a p t e r 9<br />
Configuring Downtime<br />
After you set up monitors and action plans, configuring downtime<br />
prevents the generation of unnecessary alerts. Setting up your<br />
downtime information also provides more accurate reporting and<br />
status information.<br />
Configuring scheduled downtime results in the following:<br />
No alerts will be triggered if the component is unavailable.<br />
Action plans in progress for a component when a downtime<br />
begins will be retired.<br />
<strong>OneSight</strong> Console Status page information will indicate that a<br />
component is currently in a scheduled downtime.<br />
Reports that measure availability and performance over time<br />
include a separate category, Scheduled Downtime, to distinguish<br />
downtime from those periods that the system was unavailable due<br />
to an unexpected problem.<br />
Downtime schedules cannot be modified or deleted for systems that<br />
are currently in a scheduled downtime. Only downtime schedules<br />
that have not started or have expired can be modified or deleted.<br />
Running downtimes can be cancelled. Downtimes that have not<br />
started or have expired cannot be cancelled.<br />
Items Available for Downtime Scheduling<br />
The items available for downtime scheduling include any<br />
configured web component, arranged in the hierarchy reflected in<br />
723
Items Available for Downtime Scheduling<br />
your monitor groups. You can schedule downtime for an individual<br />
monitor or an individual component using a profile monitor. You<br />
can also schedule downtime for all monitors belonging to the same<br />
monitor group, or for all monitor groups.<br />
If you have multiple monitors with the same host name or IP<br />
address on a specific machine, it is easier to schedule downtime for<br />
a system. This way, all of the monitors associated with this system<br />
will have the same scheduled downtime.<br />
You can schedule downtime in three ways:<br />
By Monitor – Use this tab to apply downtime schedules to a<br />
monitor group or individual monitors.<br />
By System – Use this tab to apply systems to downtime schedules.<br />
By Downtime – Use this tab to apply monitors to downtime<br />
schedules.<br />
On the By Monitor tab, the list of currently scheduled downtimes can<br />
differ for any item selected in the upper portion of this dialog box.<br />
A specific monitor may have a several downtime schedules. For<br />
example, there may be a system-wide downtime scheduled monthly, a<br />
monitor group downtime scheduled weekly, and a monitor downtime<br />
scheduled daily. However, you must modify a downtime at the same<br />
monitor group level that you configured it.<br />
A global downtime cannot be modified for a specific monitor. A<br />
global downtime can be modified only when the All Monitor<br />
Groups option is selected.<br />
A downtime associated with an entire monitor group cannot be<br />
modified for a specific monitor. A monitor group downtime can<br />
be modified only when the monitor group is selected.<br />
724 <strong>OneSight</strong> <strong>Administrator</strong> <strong>Guide</strong>
Items Available for Downtime Scheduling<br />
On the By System tab, the list of currently scheduled downtimes can<br />
differ for any item selected in the upper portion of this dialog box.<br />
The downtime list shows the status of the downtimes:<br />
Not run<br />
Active<br />
Expired<br />
A specific system or all systems may have a several downtime<br />
schedules with different start and end times. For example, there may<br />
be a system-wide downtime scheduled monthly, a system downtime<br />
scheduled weekly, and a system downtime scheduled daily. However,<br />
you must modify a downtime at the same system level that you<br />
configured it.<br />
An all systems downtime cannot be modified for a specific<br />
monitor or system. An all systems downtime can be modified<br />
only when the All Systems option is selected.<br />
A downtime associated with a system cannot be modified for a<br />
specific monitor. A system downtime can be modified only when<br />
the system is selected.<br />
Scheduling Downtime by Monitor<br />
To schedule downtime by monitor:<br />
1. Click the Configure menu.<br />
Chapter 9: Configuring Downtime 725
Items Available for Downtime Scheduling<br />
2. Select Downtime.<br />
3. Select an item and click Add or Modify to edit downtime<br />
information for the selected monitor groups or monitors.<br />
726 <strong>OneSight</strong> <strong>Administrator</strong> <strong>Guide</strong>
Items Available for Downtime Scheduling<br />
Note: You cannot modify the downtime configuration of a<br />
system that is in a currently scheduled downtime. However, you<br />
can cancel the current running downtime.<br />
Name – Enter a name for the downtime schedule or keep the<br />
default name.<br />
Sample during downtime – When selected, sampling will<br />
continue during downtime. When not selected, sampling will<br />
stop during downtime.<br />
Do once – To configure a single downtime event, select this<br />
option.<br />
Start Date – Specify the start date on which you want<br />
downtime to begin or click the calendar to select a date.<br />
Downtime cannot be configured in the past.<br />
Start Time (hh:mm) – Enter the start time.<br />
Chapter 9: Configuring Downtime 727
Items Available for Downtime Scheduling<br />
End Date – Specify the end date on which you want<br />
downtime to end or click the calendar to select a date.<br />
End Time (hh:mm) – Enter the end time.<br />
Repeat – To configure a regularly scheduled downtime, click<br />
this button and configure the time that the downtime will occur.<br />
You can schedule a downtime event that occurs every hour,<br />
day, week, bi-weekly, monthly, or on the last day of the month.<br />
Every – Select the frequency with which you want to<br />
schedule downtime.<br />
Start Time (hh:mm) – Enter the time to start downtime for all<br />
frequencies except hourly.<br />
End Time (hh:mm) – Select this option to enter the time to<br />
stop downtime. This is for downtimes that need to stop at a<br />
particular time, not after a specified duration.<br />
Duration – Select this option to enter the length of the<br />
downtime in hours and minutes. This is for downtimes that<br />
do not need to stop at a particular time.<br />
on day – Select a day (Sunday through Saturday) for the<br />
weekly, and bi-weekly downtime. For the bi-weekly<br />
downtime, the schedule starts on the next selected day. For<br />
example, if you create the schedule on Monday and select<br />
Tuesday as the downtime day, the downtime starts tomorrow.<br />
on day – Select a day for the monthly downtime. The options<br />
are 1 through 31 and first, second, third, fourth, or last<br />
Monday, Tuesday, Thursday, Friday, Saturday, or Sunday.<br />
on minute - Select a minute of the hour for the hourly<br />
downtime.<br />
728 <strong>OneSight</strong> <strong>Administrator</strong> <strong>Guide</strong>
Items Available for Downtime Scheduling<br />
Notes for this downtime – Enter relevant information for this<br />
downtime, such as the reason for the downtime.<br />
4. Enter the downtime information and click OK.<br />
Scheduling Downtime by System<br />
To schedule downtime by system:<br />
1. Click the Configure menu.<br />
Chapter 9: Configuring Downtime 729
Items Available for Downtime Scheduling<br />
2. Select Downtime.<br />
3. Click the By System tab.<br />
4. Select All systems or the system to which you want to add a<br />
downtime schedule.<br />
5. Click Add or Modify to display the Downtime Schedule dialog<br />
box to add a new downtime schedule or modify and existing<br />
schedule.<br />
6. Enter the downtime schedule information and click OK.<br />
Scheduling Downtime by Downtime<br />
To schedule downtime by downtime:<br />
1. Click the Configure menu.<br />
2. Select Downtime.<br />
730 <strong>OneSight</strong> <strong>Administrator</strong> <strong>Guide</strong>
Items Available for Downtime Scheduling<br />
3. Click the By Downtime tab.<br />
4. In the upper portion of the dialog box select the downtime<br />
schedule to which you want to apply monitors.<br />
Chapter 9: Configuring Downtime 731
Items Available for Downtime Scheduling<br />
5. Click Add in the Monitors using this downtime section.<br />
6. Select the monitors you want to view using the monitors where<br />
and contains fields and click Show.<br />
7. Select the monitors that you want to apply to this downtime and<br />
click OK.<br />
8. Click Add or Modify in the Downtimes schedules portion of the<br />
dialog box to add a new downtime schedule or modify an<br />
existing schedule. If you modify an existing schedule the<br />
changes apply to all monitors using the schedule.<br />
732 <strong>OneSight</strong> <strong>Administrator</strong> <strong>Guide</strong>
Putting a Monitor Immediately Into Downtime<br />
Putting a Monitor Immediately Into Downtime<br />
You can put a monitor into downtime for a specified period of time<br />
starting immediately. Select Start Downtime from the popup menu<br />
on the Status Detail page or the Alert page.<br />
Pre-Defined – Select this button to pick downtime from a predefined<br />
list: 5, 10, or 30 minutes.<br />
Other – Select this button to enter the number of minutes for the<br />
downtime.<br />
Sample during downtime – When selected, sampling will continue<br />
during downtime. When not selected, sampling will stop during<br />
downtime.<br />
Notes for this downtime – Enter relevant information for this<br />
downtime, such as the reason for the downtime.<br />
Chapter 9: Configuring Downtime 733
Putting a Monitor Immediately Into Downtime<br />
[This page intentionally left blank.]<br />
734 <strong>OneSight</strong> <strong>Administrator</strong> <strong>Guide</strong>
C h a p t e r 10<br />
Configuring Attributes and Views<br />
The Attributes tab of the Attribute editor lists the custom Attribute<br />
Sets and Attribute Values that are defined in <strong>OneSight</strong>. You can<br />
add or remove Attribute Sets or Attribute Values that can be used to<br />
sort the monitors on the status page.<br />
The Assignment tab of the Attribute editor lets you add and remove<br />
attributes across multiple monitors, monitor groups, systems, and<br />
profiles.<br />
The Saved Status Groupings tab lists all of the configured status<br />
groupings that are defined in <strong>OneSight</strong>. These status groupings can<br />
be used on the status page to group monitors. They can also be<br />
configured as the default status grouping for the user.<br />
Attributes can also be used to create Attribute Matrix Views for<br />
viewing on the reports tab. An Attribute Matrix View is a high-level<br />
business view of your application using two attribute sets to create a<br />
table.<br />
In addition, you can create image-based custom status views that<br />
can reflect the geographical location of distributed applications.<br />
Configuring Attributes<br />
Adding Attributes Sets and Values<br />
To add attributes sets and values:<br />
1. Click the Configure menu.<br />
735
Configuring Attributes<br />
2. Select Attributes to open the Attribute dialog box.<br />
Use these options to define and manage <strong>OneSight</strong> attribute sets<br />
and attribute values.<br />
Attribute Sets – The Attribute Sets list shows the names of the<br />
custom attribute sets that have been defined in <strong>OneSight</strong>. The<br />
names added to this list will appear in the Group by select list<br />
on the <strong>OneSight</strong> status page. When you group the status page<br />
by an Attribute Set, the <strong>OneSight</strong> status lists only the monitors,<br />
monitor groups, systems, and profiles that are configured with<br />
an Attribute Value from that Attribute Set.<br />
In addition to custom Attribute Set names, the following names<br />
can also appear in the “Group by” list on the status page:<br />
<br />
Action Plan<br />
Location<br />
736 <strong>OneSight</strong> <strong>Administrator</strong> <strong>Guide</strong>
Configuring Attributes<br />
Monitor Type<br />
Profile<br />
System<br />
These Attribute Sets are added automatically by <strong>OneSight</strong> when<br />
monitors are configured and are not editable in the Attributes<br />
configuration.<br />
Add – Opens a dialog box for defining a new Attribute Set<br />
name.<br />
Modify – Opens a dialog box for changing the selected attribute<br />
set.<br />
Remove– Deletes the currently selected Attribute Set from the<br />
list. A dialog box appears asking to confirm the deletion.<br />
Removing an Attribute Set also deletes the associated Attribute<br />
values. The Attribute Set name is removed from the Group by<br />
list on the status page. The attribute values are also removed<br />
from the monitor group, monitor, system, and profile<br />
configurations.<br />
Used by – Displays a list of monitor groups, monitors, profiles,<br />
systems, and saved status groupings that are using this attribute<br />
set.<br />
Attribute Value Name – Shows the list of Attribute Value names<br />
for the currently selected Attribute Set. Attribute Values can be<br />
assigned to monitor groups, monitors, systems, and profiles.<br />
Add– Opens a dialog box for defining a new Attribute Value<br />
name.<br />
Modify – Opens a dialog box for changing the selected attribute<br />
value.<br />
Chapter 10: Configuring Attributes and Views 737
Configuring Attributes<br />
Remove– Deletes the currently selected Attribute Value name<br />
from the Attribute Set. A dialog box appears asking to confirm<br />
the deletion. Removing an Attribute Value also deletes the<br />
value from the monitor group, monitor, system, and profile<br />
configurations.<br />
Used by – Displays a list of monitor groups, monitors, profiles,<br />
and systems that are using this attribute value.<br />
3. Click Add above the Attribute Sets list.<br />
Use the Add Attribute Set dialog box to add a new Attribute Set<br />
Name to the list of attributes that are defined in <strong>OneSight</strong>. Set<br />
names appear in the Group by option list on the <strong>OneSight</strong> status<br />
page.<br />
Attribute Set Name – Specify a name for the attribute set.<br />
738 <strong>OneSight</strong> <strong>Administrator</strong> <strong>Guide</strong>
Configuring Attributes<br />
Access Control Tab – Use this tab to specify which user groups<br />
have access to this attribute set.<br />
Owner – The user group for this attribute set. An attribute set can<br />
be directly owned by a single user group.<br />
User Group – Displays the user group names.<br />
Global Read – Gives read access to this user group and all of<br />
its sub user groups.<br />
Read – Gives read permission to the user group.<br />
Write – Gives write permission to the user group.<br />
Delete – Gives delete permission to the user group.<br />
4. Define a name for the set.<br />
5. Specify access control permissions and click OK.<br />
6. Make sure the attribute set is selected and click Add above the<br />
attribute values list.<br />
Use the Add Attribute Value dialog box to add a new Attribute<br />
Value Name to the list of attributes values in the selected<br />
Attribute Set. Attribute Values can be added to monitor groups,<br />
monitors, systems, and profiles and are used to group items on<br />
the <strong>OneSight</strong> status page.<br />
Chapter 10: Configuring Attributes and Views 739
Configuring Attributes<br />
Attribute Set Name – Displays the Attribute Set to which the<br />
attribute value will be added.<br />
Attribute Value Name – Specify the name of the Attribute Value<br />
to add to the Attribute Set.<br />
7. Define a name for the value and click OK.<br />
8. In one or more monitor, monitor group, profile, or system<br />
configurations, click the Attributes tab.<br />
9. Click Add.<br />
10. Select the Attribute value to apply to the monitor, monitor<br />
group, profile, or system configuration.<br />
11. Click the Status tab.<br />
12. On the Status page, select an Attribute Set name from the Group<br />
by list. Only those monitors, monitor groups, profiles, or<br />
systems that have an attribute value from that set will appear on<br />
the status page.<br />
Removing Attributes Sets and Values<br />
To remove attributes sets and values:<br />
1. Click the Configure menu.<br />
2. Click Attributes to open the Attribute Editor.<br />
3. Select an attribute set or value.<br />
4. Click Remove above the selected item.<br />
5. Click Yes to confirm.<br />
740 <strong>OneSight</strong> <strong>Administrator</strong> <strong>Guide</strong>
Assigning Attributes to Objects<br />
Assigning Attributes to Objects<br />
To assign attributes to multiple monitors, monitor groups, systems,<br />
and profiles:<br />
1. Click the Configure menu.<br />
2. Select Attributes to open the Attribute Editor.<br />
3. Click the Assignment tab.<br />
Attribute Set – Select the attribute set containing the attributes<br />
value that you want to assign.<br />
Attribute Value – Select the attribute value that you want to<br />
assign.<br />
Show – Lists the objects of the type that you selected.<br />
– Select the type of objects that you want to assign<br />
this attribute value to and click Show. For monitor object types<br />
you can filter the list so that not all monitors are listed.<br />
Chapter 10: Configuring Attributes and Views 741
Configuring Saved Status Groupings<br />
Check All – Selects all of the objects that are listed.<br />
Uncheck All – Deselects all of the objects that are listed.<br />
Check box – Select or deselect objects.<br />
Name – Displays the object name.<br />
4. Select the type of object that you want to assign this attribute<br />
value to. For monitor object types, you can also select the<br />
criteria of the monitors you want to list.<br />
5. Click Show.<br />
6. Select the objects that you want to assign this attribute value to.<br />
Click Check All to select all of the objects in the list. Click<br />
Uncheck All to deselect all of the objects in the list.<br />
Note: If, at this point, you change the selected attribute set,<br />
attribute value, or filtering criteria, you will be asked if you<br />
want to save the previous changes if those changes have not<br />
been saved.<br />
7. Click Close.<br />
Configuring Saved Status Groupings<br />
Adding a Saved Status Grouping<br />
To add a status grouping:<br />
1. Click the Configure menu.<br />
2. Select Attributes to open the Attribute Editor.<br />
742 <strong>OneSight</strong> <strong>Administrator</strong> <strong>Guide</strong>
Configuring Saved Status Groupings<br />
3. Click the Saved Status Groupings tab.<br />
Add – Opens a dialog box for adding a new status grouping.<br />
Modify – Opens a dialog box for modifying the selected status<br />
grouping.<br />
Remove – Deletes the selected status grouping.<br />
Used by – Displays a list of users that are using this status<br />
grouping.<br />
Name – Lists the status groupings that are currently configured.<br />
User Group – Lists the user group.<br />
Chapter 10: Configuring Attributes and Views 743
Configuring Saved Status Groupings<br />
4. Click the Add button.<br />
Status Grouping Name – Enter a name for the status grouping.<br />
Primary Attribute Set – Select the first attributes set to group by.<br />
Second Attribute Set – Select the second attribute set to group<br />
by.<br />
Third Attribute Set – Select the third attribute set to group by.<br />
Fourth Attribute Set –Select the fourth attribute set to group by.<br />
5. Enter a name for the status grouping.<br />
6. Select the attributes by which you want to group.<br />
744 <strong>OneSight</strong> <strong>Administrator</strong> <strong>Guide</strong>
Configuring Saved Status Groupings<br />
7. Click the Access Control tab to control which user groups have<br />
access to this status grouping.<br />
Use this tab to specify which user groups have access to this<br />
status grouping.<br />
User Group – Displays the user group names.<br />
Owner – The user group for this status grouping. A status<br />
grouping can be directly owned by a user group.<br />
Global Read – Gives read access to this user group and all of its<br />
sub user groups.<br />
Read – Gives read permission to the user group.<br />
Write – Gives write permission to the user group.<br />
Delete – Gives delete permission to the user group.<br />
Chapter 10: Configuring Attributes and Views 745
Configuring Saved Status Groupings<br />
8. Configure permissions and click OK.<br />
9. Click Close to exit the Attribute Editor.<br />
10. On the Status page, select an Status Grouping from the Group by<br />
list.<br />
Modifying a Saved Status Grouping<br />
To modify a status grouping:<br />
1. Click the Configure menu.<br />
2. Select Attributes to open the Attribute Editor.<br />
3. Click the Saved Status Grouping tab.<br />
4. Select the status grouping you want to change and click Modify.<br />
5. Make any changes and click OK.<br />
6. Click Close.<br />
Deleting a Saved Status Grouping<br />
To delete a saved status grouping:<br />
1. Click the Configure menu.<br />
2. Select Attributes to open the Attribute Editor.<br />
3. Click the Saved Status Grouping tab.<br />
4. Select the status grouping that you want to delete and click<br />
Remove.<br />
5. Click Close to exit the Attribute Editor.<br />
746 <strong>OneSight</strong> <strong>Administrator</strong> <strong>Guide</strong>
Configuring Attribute Matrix Views<br />
Configuring Attribute Matrix Views<br />
Attribute Matrix Views let you create a customized status page by<br />
using two sets of attributes to create a table. Attribute Matrix Views<br />
are also available in the Add Report menu on the Reports tab.<br />
The example below uses two attribute sets, application and<br />
communication. Application has three values: billing, shopping, and<br />
service. Communication has four attribute values: agent, kiosk,<br />
voice, and web. Custom icons have been assigned to each of the<br />
communication attributes.<br />
Each icon represents one or more monitors that have both the<br />
application and communication attributes. The unspecified column<br />
contains monitors that do not have a communication attribute, but<br />
do have an application attribute. Monitors that do not have either<br />
attribute set are not displayed.<br />
Clicking a row or column header displays detailed monitor status<br />
for that respective row or column. Clicking any icon shows detailed<br />
monitor status for the included monitors.<br />
Chapter 10: Configuring Attributes and Views 747
Configuring Attribute Matrix Views<br />
Adding Attribute Matrix Views<br />
To add an Attribute Matrix View:<br />
1. Click the Configure menu.<br />
2. Click Attribute Matrix Views.<br />
Add – Displays the Attribute Matrix View – Add dialog box for<br />
adding an Attribute Matrix View.<br />
Modify – Displays the Attribute Matrix View – Modify dialog<br />
box for changing the selected Attribute Matrix View.<br />
Remove – Deletes the selected Attribute Matrix View.<br />
748 <strong>OneSight</strong> <strong>Administrator</strong> <strong>Guide</strong>
Configuring Attribute Matrix Views<br />
Name – Displays the Attribute Matrix View name.<br />
Description – Displays the Attribute Matrix View’s description.<br />
3. Click Add.<br />
Name – Enter a name for the Attribute Matrix View. This name<br />
will be listed in the Attribute Matrix Views menu item in the Add<br />
Report menu on the Reports tab.<br />
Title – Enter the title of the report.<br />
Description – Enter a description of the report. The description<br />
is displayed under the report title.<br />
Chapter 10: Configuring Attributes and Views 749
Configuring Attribute Matrix Views<br />
Select Tab – Use this tab to select the attributes to use for the x<br />
and y axis and to configure custom icons to display in the<br />
Attribute Matrix View report.<br />
Row Attribute Group – Select the attribute group to use for the<br />
row.<br />
Column Attribute Group – Select the attribute group to use for<br />
the column.<br />
Modify – Displays the Status Icon – Modify dialog box for<br />
changing the default status icons.<br />
Set All To Default – Sets all status icons to the default icons.<br />
Name – Displays the name of the attribute value.<br />
Icon – Displays the icons assigned to the attribute value.<br />
Access Control Tab – Use this tab to specify which user groups<br />
have access to this Attribute Matrix View.<br />
User Group – Displays the user group names.<br />
Owner – The user group for this Attribute Matrix View. An<br />
Attribute Matrix View can be directly owned by a user<br />
group.<br />
Global Read – Gives read access to this user group and all of<br />
its sub user groups.<br />
Read – Gives read permission to the user group.<br />
Write – Gives write permission to the user group.<br />
Delete – Gives delete permission to the user group.<br />
4. Select the attribute to use for the rows.<br />
750 <strong>OneSight</strong> <strong>Administrator</strong> <strong>Guide</strong>
Configuring Attribute Matrix Views<br />
5. Select the attribute to use for the columns.<br />
6. Change the icons, if necessary, by clicking Modify.<br />
This dialog box lets you change the icons that are displayed in<br />
the report so that they are meaningful in the context of your<br />
report.<br />
Icon Set – Select the icon set that you want to use for the status<br />
icons. Select Default to reset the icon set.<br />
URL – Enter the location of the icon file that you want to use for<br />
each state. The files must be located in the<br />
\Empirix\<strong>OneSight</strong>\webapps\ROOT\images directory on the<br />
<strong>OneSight</strong> installation drive. File names are case sensitive.<br />
7. Click OK.<br />
8. Click OK. You can view this Attribute Matrix View by selecting<br />
it from the Attribute Matrix Views menu option in the Add Report<br />
menu on the Reports tab.<br />
Modifying Attribute Matrix Views<br />
To modify an Attribute Matrix View:<br />
1. Click the Configure menu.<br />
2. Click Attribute Matrix Views.<br />
Chapter 10: Configuring Attributes and Views 751
Configuring Attribute Matrix Views<br />
3. Select the Attribute Matrix View that you want to change, and<br />
click Modify.<br />
4. Make any changes.<br />
5. Click OK.<br />
752 <strong>OneSight</strong> <strong>Administrator</strong> <strong>Guide</strong>
Configuring Custom Status Views<br />
Deleting Attribute Matrix Views<br />
To delete an Attribute Matrix View:<br />
1. Click the Configure menu.<br />
2. Click Attribute Matrix Views.<br />
3. Select the Attribute Matrix View that you want to delete, and<br />
click Remove.<br />
4. Click OK when asked to confirm.<br />
Configuring Custom Status Views<br />
Custom Status Views allow you to create a customized view<br />
representing status however you want to visualize it.. For example:<br />
Geographically – you can overlay status icons on a map image.<br />
NOC View – you can overlay status icons on a network diagram<br />
image.<br />
Hybrid – you can include <strong>OneSight</strong> pages such as status and<br />
reports onto a status map, along with URL links.<br />
Custom Reports – you can overlay metric values onto a<br />
background images such as a spreadsheet.<br />
To build a Custom Status View, you create items that you position<br />
on a canvas using drag and drop. The following types of items can<br />
be added to a Custom Status View:<br />
monitors and monitor groups – displays a status icon of the monitor<br />
or monitor group.<br />
Chapter 10: Configuring Attributes and Views 753
Configuring Custom Status Views<br />
text – text can be used to label information on the Custom Status<br />
View or can be used as a link to another location, such as another<br />
Custom Status View. Text can be formatted using a .css file.<br />
images – any browser supported image can be used including .gif,<br />
.jpg, .bmp, and .png.<br />
area – areas are typically used to provide a clickable area. For<br />
example, on a map of the United States you could create an area<br />
in each state that linked to state-specific information.<br />
frame – frames are used to include a URL, RSS feed, or other<br />
<strong>OneSight</strong> content such as an Attribute Matrix View.<br />
Custom Status Views are available from the main Status menu and<br />
in the Reports menu, where they can be included in Dashboard<br />
reports.<br />
Refer to the example at the end of this section for a step-by-step<br />
walkthrough of creating a Custom Status View.<br />
Adding a Custom Status View<br />
To add a Custom Status View:<br />
1. Click the Configure menu.<br />
754 <strong>OneSight</strong> <strong>Administrator</strong> <strong>Guide</strong>
Configuring Custom Status Views<br />
2. Select Custom Status Views.<br />
Add – Displays the Custom Status View – Add dialog box for<br />
adding a new Custom Status View.<br />
Modify – Displays the Custom Status View – Modify dialog box<br />
for changing the selected Custom Status View.<br />
Remove – Deletes the selected Custom Status View.<br />
Chapter 10: Configuring Attributes and Views 755
Configuring Custom Status Views<br />
3. Click Add.<br />
Name – Enter a name for the Custom Status View.<br />
Description – Enter a description of the Custom Status View.<br />
Width – Enter the width of the status map in pixels.<br />
Height – Enter the height of the status map in pixels.<br />
Adjusting the width or height resizes the canvas area.<br />
Map Definition Pane<br />
Add – Displays the Custom Status View Item – Add dialog<br />
box for adding a new item.<br />
Modify – Displays the Custom Status View Item – Modify<br />
dialog box for modifying the selected item.<br />
756 <strong>OneSight</strong> <strong>Administrator</strong> <strong>Guide</strong>
Configuring Custom Status Views<br />
Remove – Removes the selected item.<br />
Select All – Selects all items in the item list. This is useful<br />
when you want to reposition a group of items simultaneously.<br />
Select None – Deselects all items in the item list.<br />
– Lists all items. The order that the items are<br />
listed determines the Z-order, that is which items can be<br />
placed on top of other items. Items can be placed on items<br />
that are below them on the list. Note that frame items cannot<br />
have items placed on top of them regardless of where they<br />
are in the list. You can select more than one item to move<br />
items simultaneously.<br />
Canvas Pane – The canvas is where you compose the Custom<br />
Status View. Click on the item you want to move in the item list<br />
then drag it to the desired location.<br />
If you need fine grained control when positioning items, you<br />
can use the arrow keys on the keyboard to move items one pixel<br />
at a time. These keys function differently depending on the<br />
browser you are using:<br />
Internet Explorer – click the item you want to move using the<br />
mouse, then use the arrow keys to adjust the item’s position.<br />
Firefox – first, click a blank area on the canvas, then click the<br />
item you want to move. Use the arrow keys to adjust the<br />
item’s position.<br />
Chapter 10: Configuring Attributes and Views 757
Configuring Custom Status Views<br />
4. Click on an item in the item list that you want to add to<br />
highlight it on the canvas. Click and drag it to the desired<br />
location. Continue this procedure until you are done. Refer to<br />
“Creating custom Status View Items” for information on<br />
creating new items. The following example shows monitors on<br />
a map of the United States.<br />
5. Click OK.<br />
6. Click OK to exit the Custom Status Views dialog box. You can<br />
view the Custom Status View by selecting it from the Status<br />
menu or you can add it to a Dashboard report.<br />
Creating Custom Status View Items<br />
Before you can create a Custom Status View, you must create the<br />
items that you are going to use in it. The following sections explain<br />
how to create the various types of items.<br />
Creating a Report Item<br />
You can add a Gauge report or Metric Performance report to your<br />
Custom Status View.<br />
When you select gauge as the item type, a mini-gauge is added to<br />
the Custom Status View. The gauge has a white rectangle around it.<br />
758 <strong>OneSight</strong> <strong>Administrator</strong> <strong>Guide</strong>
Configuring Custom Status Views<br />
To eliminate the white rectangle when place the report behind an<br />
image that has been made semi-transparent using the Opacity<br />
setting for the image.<br />
1. Click Add on the Map Definition tab.<br />
2. Select Report as the item type.<br />
Item Type – Select the type of item you want to add.<br />
Name – Enter a name for the item. If you do not enter a name,<br />
<strong>OneSight</strong> will automatically create a name, when possible.<br />
CSS Style – Enter any valid CSS attribute pair, separated by<br />
semicolons. For example, font-size : 24px; fontfamily:Rockwell;<br />
This field is automatically generated for<br />
Frame and Area items when you enter the height and width. If<br />
you are adding a gauge report, the width must be less than<br />
365px or the graph will get truncated. The height must be no<br />
less than 220 px.<br />
Note: CSS is not validated.<br />
Chapter 10: Configuring Attributes and Views 759
Configuring Custom Status Views<br />
Show – Lets you filter the list of monitor groups or monitors<br />
that are displayed on this page.<br />
Name – Lists the names of the monitor groups or monitors<br />
based on the filtering criteria. Select the monitor group or<br />
monitor for which you want to create an item.<br />
Report for Metric – Displays the selected metric. This is the<br />
metric that will be reported on.<br />
Report Type – Select the type of report you want to add, Gauge<br />
or Metric Performance.<br />
Note: If you are adding a gauge report, the width in the CSS<br />
Style field must be less than 365px or the graph will get<br />
truncated. The height must be no less than 220px.<br />
Text – Enter the text that you want to display next to the<br />
gumball or click Show Metric Value to select a metric whose<br />
value you want to display. The Text field is automatically filled<br />
in when you select a metric value. Use the monlight_blank.gif<br />
icon to only display the value.<br />
Preview – Displays the item in a separate window.<br />
3. Enter a name for the item or let <strong>OneSight</strong> create a name.<br />
4. Select how you want to filter the monitor list and click Show.<br />
5. Select the metric that you want to report on.<br />
6. Select the type of report you want to add.<br />
7. Click Preview to view the item and click OK when you are done.<br />
Creating a Monitor Group or Monitor Item<br />
The Monitor Group and Monitor items show a rolled-up view of<br />
their status.<br />
760 <strong>OneSight</strong> <strong>Administrator</strong> <strong>Guide</strong>
Configuring Custom Status Views<br />
1. Click Add on the Map Definition tab.<br />
2. Select Monitor Group or Monitor as the item type.<br />
Item Type – Select the type of item you want to add.<br />
Name – Enter a name for the item. If you do not enter a name,<br />
<strong>OneSight</strong> will automatically create a name, when possible.<br />
Hover Text – Enter the text you want displayed when you<br />
mouse-over the item. For monitors only, you can also enter the<br />
%hover% variable. It displays the same hover text that is<br />
supplied on the top-level status page for monitors. It is<br />
automatically entered into this field for monitors that are<br />
automatically named.<br />
Drill Down URL – Enter the URL of the page you want to display<br />
when you click on the item. For monitor groups and monitors<br />
only, you can also enter the %drilldown% variable. For monitor<br />
groups, the variable resolves to the selected monitor group’s<br />
detailed status page. For monitors, it resolves to the selected<br />
Chapter 10: Configuring Attributes and Views 761
Configuring Custom Status Views<br />
monitor’s Intellisearch page. It is automatically entered into this<br />
field for monitor groups and monitors.<br />
For monitors, the %drilldown_monitorgroup% variable drills<br />
into the first monitor group of the monitor.<br />
Note: To link to another Custom Status View, use the URL that<br />
is displayed when you view the Custom Status Map from the<br />
main View menu.<br />
CSS Style – Enter any valid CSS attribute pair, separated by<br />
semicolons. For example, font-size : 24px; fontfamily:Rockwell;<br />
This field is automatically generated for<br />
Frame and Area items when you enter the height and width.<br />
Note: CSS is not validated.<br />
Show – Lets you filter the list of monitor groups or monitors<br />
that are displayed on this page.<br />
Name – Lists the names of the monitor groups or monitors<br />
based on the filtering criteria. Select the monitor group or<br />
monitor for which you want to create an item.<br />
Icon Set – Select the icon set that you want to use for the status<br />
icons. Select Default to reset the icon set.<br />
New Icon Set – Displays the Add Icon Set dialog box for<br />
creating a custom set of icons to use for the status display.<br />
Remove Icon Set – Deletes the selected custom icon set. Default<br />
icon sets cannot be deleted.<br />
URL of Good State Icon – Enter the location of the icon you<br />
want to use when the monitor group or monitor is in a good<br />
state or click Browse to navigate to the image.<br />
URL of Warning State Icon – Enter the location of the icon you<br />
want to use when the monitor group or monitor is in a warning<br />
state or click Browse to navigate to the image.<br />
762 <strong>OneSight</strong> <strong>Administrator</strong> <strong>Guide</strong>
Configuring Custom Status Views<br />
URL of Critical State Icon – Enter the location of the icon you<br />
want to use when the monitor group or monitor is in a critical<br />
state or click Browse to navigate to the image.<br />
URL of Other States Icon – Enter the location of the icon you<br />
want to use when the monitor group or monitor is in a state<br />
other than good, warning, or critical, or click Browse to<br />
navigate to the image.<br />
Status Icon Tips – Following are some tips for using status<br />
icons.<br />
To create conditional “special effect,” such as a popup,<br />
specify alternative images for the status icons.<br />
To make your status icons stand out on a colored background<br />
images, set the opacity of the background images to between<br />
20-50%.<br />
Use the pin_.png status icon images when adding a<br />
monitor or monitor group status of a map for pushpin look.<br />
Use the monlight_blank.gif status icon images to show nothing<br />
when appropriate.<br />
Show Metric Value – This option is only available for monitor<br />
items. A dialog box is displayed that lets you select the metric<br />
value that you want to display. The text field is automatically<br />
filled in with the appropriate values in the<br />
%value:componentID:metricID% variable.<br />
Text – Enter the text that you want to display next to the<br />
gumball or click Show Metric Value to select a metric whose<br />
value you want to display. The Text field is automatically filled<br />
in when you select a metric value. Use the monlight_blank.gif<br />
icon to only display the value.<br />
Preview – Displays the item in a separate window.<br />
3. Enter a name for the item or let <strong>OneSight</strong> create a name.<br />
Chapter 10: Configuring Attributes and Views 763
Configuring Custom Status Views<br />
4. Enter text you want displayed when you mouse-over the item.<br />
5. Enter the URL that you want displayed when you click on the<br />
item. If you leave this field blank and have let <strong>OneSight</strong><br />
generate the item name, <strong>OneSight</strong> defaults to the Monitor<br />
Group’s detailed status page or the Monitor’s IntelliSearch<br />
page.<br />
6. Optionally enter the CSS style that you want to use.<br />
7. Select the monitor group or monitor that you want to use. To<br />
change the default list of monitor groups, select the filtering<br />
criteria and click Show.<br />
8. Change the default icons or create a new icon set, if necessary.<br />
To create a new icon set:<br />
1. Click New Icon Set to display the Add Icon Set dialog<br />
box.<br />
Name – Enter the name of the new icon set. The name<br />
will be displayed in the Icon Set drop down on the<br />
Custom Status View Item – Add dialog box.<br />
URL of Good State Icon – Enter the path and name of the<br />
image to use for the good state icon or click Browse to<br />
select it from the Browse Status Images Directory<br />
dialog box. This field is optional.<br />
URL of Warning State Icon – Enter the path and name of<br />
the image to use for the warning state icon or click<br />
764 <strong>OneSight</strong> <strong>Administrator</strong> <strong>Guide</strong>
Configuring Custom Status Views<br />
Browse to select it from the Browse Status Images<br />
Directory dialog box. This field is optional.<br />
URL of Critical State Icon – Enter the path and name of<br />
the image to use for the critical state icon or click<br />
Browse to select it from the Browse Status Images<br />
Directory dialog box. This field is optional.<br />
URL of Other States Icon – Enter the path and name of<br />
the image to use for the other states icon or click<br />
Browse to select it from the Browse Status Images<br />
Directory dialog box. This field is required.<br />
2. Click Browse beside each state icon line to display the<br />
Browse Status Images Directory dialog box.<br />
3. Select the image that you want to use and click OK.<br />
4. Repeat for each status type. Note that you must select<br />
an image for the URL of Other States Icon field; all other<br />
status icon fields can be left blank.<br />
5. Click OK.<br />
9. Enter the text you want to display next to the icon. For monitor<br />
items you can also click Show Metric Value to select a metric<br />
whose value you want to display in place of text. The Text field<br />
is automatically filled in with the<br />
%value:componentID:metricID% variable.<br />
10. Click Preview to view the item and click OK when you are done.<br />
Creating a Text Item<br />
Text items are useful for both labels and links.<br />
1. Click Add on the Map Definitions tab.<br />
Chapter 10: Configuring Attributes and Views 765
Configuring Custom Status Views<br />
2. Select Text as the item type.<br />
Item Type – Select the type of item you want to add.<br />
Name – Enter a name for the item. If you do not enter a name,<br />
<strong>OneSight</strong> will automatically create a name.<br />
Hover Text – Enter the text you want displayed when you<br />
mouse-over the item<br />
Drill Down URL – Enter the URL of the page you want to display<br />
when you click on the item.<br />
Note: To link to another Custom Status View, use the URL that<br />
is displayed when you view the Custom Status Map from the<br />
main View menu.<br />
CSS Style – Enter any valid CSS attribute pair, separated by<br />
semicolons. For example, font-size : 24px; fontfamily:Rockwell;<br />
This field is automatically generated for<br />
Frame and Area items when you enter the height and width.<br />
Note: CSS is not validated.<br />
Text – Enter the text.<br />
Preview – Displays the item in a separate window.<br />
3. Enter a name for the item or let <strong>OneSight</strong> create a name.<br />
766 <strong>OneSight</strong> <strong>Administrator</strong> <strong>Guide</strong>
Configuring Custom Status Views<br />
4. Enter the text you want to display when you mouse-over the<br />
item.<br />
5. Enter the URL you want displayed when you click on the item.<br />
6. Enter the CSS style to apply to the text.<br />
7. Enter the text.<br />
8. Click Preview to view the item and click OK when you are done.<br />
Creating an Image Item<br />
An image item can be any valid browser image file that you want to<br />
display in the Custom Status view. <strong>OneSight</strong> provides a library of<br />
images that you can use including over 300 geographical maps,<br />
gumballs, pins, flags, etc. In addition, you can import any browser<br />
supported images into <strong>OneSight</strong>.<br />
Images cannot be larger than the overall Custom Status View.<br />
1. Click Add on the Map Definition tab.<br />
2. Select Image as the item type.<br />
Item Type – Select the type of item you want to add.<br />
Name – Enter a name for the item. If you do not enter a name,<br />
<strong>OneSight</strong> will automatically create a name.<br />
Chapter 10: Configuring Attributes and Views 767
Configuring Custom Status Views<br />
Hover Text – Enter the text you want displayed when you<br />
mouse-over the item.<br />
Drill Down URL – Enter the URL of the page you want to display<br />
when you click on the item.<br />
Note: To link to another Custom Status View, use the URL that<br />
is displayed when you view the Custom Status Map from the<br />
main View menu.<br />
CSS Style – Enter any valid CSS attribute pair, separated by<br />
semicolons. For example, font-size : 24px; fontfamily:Rockwell;<br />
This field is automatically generated for<br />
Frame and Area items when you enter the height and width.<br />
Note: CSS is not validated.<br />
Image URL – Enter the name and location of the image you want<br />
to use.<br />
Image Opacity – Select the percentage of opacity for the image.<br />
The image will soften with a lower opacity value. This is useful<br />
when placing images on top of one another. For example,<br />
pushpins will be easier to see on a color background image with<br />
a lower opacity. It can also be useful for making an item<br />
transparent.<br />
Browse – Displays the Browse Status Images Directory for<br />
selecting the image you want to use.<br />
Preview – Displays the item in a separate window.<br />
3. Enter a name for the item or let <strong>OneSight</strong> create a name.<br />
4. Enter the text you want to display when you mouse-over the<br />
item.<br />
5. Enter the URL that you want to display when you click on the<br />
item.<br />
768 <strong>OneSight</strong> <strong>Administrator</strong> <strong>Guide</strong>
Configuring Custom Status Views<br />
6. Enter the CSS style to use.<br />
7. Images must be located in the statusImages directory. Click<br />
Browse to select an image.<br />
Import – Displays the Import Status Image File dialog box for<br />
importing an image into <strong>OneSight</strong>. The file is imported into the<br />
statusImages/imports directory.<br />
Select the image you want to use. If it is not listed here, you can<br />
import it.<br />
Chapter 10: Configuring Attributes and Views 769
Configuring Custom Status Views<br />
8. Expand the tree and select the image you want to use and click<br />
OK or click Import to select and import an image into <strong>OneSight</strong>.<br />
Image URL – Enter the name and location of the image you want<br />
to import or click Browse to navigate to it.<br />
9. Enter the name and location of the image you want to import or<br />
click Browse to navigate to it and click OK.<br />
10. Click Preview to view the item and click OK.<br />
Creating a Area Item<br />
An area item is typically used to create a hot spot on the status<br />
view. For example, you could create hot spots on a map that link to<br />
information specific to those locations.<br />
1. Click Add on the Map Definition tab.<br />
770 <strong>OneSight</strong> <strong>Administrator</strong> <strong>Guide</strong>
Configuring Custom Status Views<br />
2. Select Area as the item type.<br />
Item Type – Select the type of item you want to add.<br />
Name – Enter a name for the item. If you do not enter a name,<br />
<strong>OneSight</strong> will automatically create a name.<br />
Hover Text – Enter the text you want displayed when you<br />
mouse-over the item.<br />
Drill Down URL – Enter the URL of the page you want to display<br />
when you click on the item.<br />
Note: To link to another Custom Status View, use the URL that<br />
is displayed when you view the Custom Status Map from the<br />
main View menu.<br />
CSS Style – Enter any valid CSS attribute pair, separated by<br />
semicolons. This field is automatically generated for Frame and<br />
Area items when you enter the height and width.<br />
Note: CSS is not validated.<br />
Width – Enter the width of the area in pixels.<br />
Height – Enter the height of the area in pixels.<br />
Preview – Displays the item in a separate window.<br />
3. Enter a name for the item or let <strong>OneSight</strong> create a name.<br />
Chapter 10: Configuring Attributes and Views 771
Configuring Custom Status Views<br />
4. Enter the height and width of the area. The CSS Style field is<br />
automatically generated.<br />
5. Click Preview to view the item and click OK when you are done.<br />
Creating a Frame Item<br />
A frame item is a URL page, with a set width and height., that is<br />
displayed in the Custom Status view. Following is a list of some of<br />
the things that you can put in a frame that contributes to the Status<br />
View in a meaningful way:<br />
<strong>OneSight</strong> At-A-Glance display<br />
<strong>OneSight</strong> Attribute Matrix View<br />
Custom Report<br />
Mini-Gauge Report<br />
RSS Feeds<br />
Weather widgets, etc.<br />
1. Click Add on the Map Definition tab.<br />
2. Select Frame as the item type.<br />
Item Type – Select the type of item you want to add.<br />
772 <strong>OneSight</strong> <strong>Administrator</strong> <strong>Guide</strong>
Configuring Custom Status Views<br />
Name – Enter a name for the item. If you do not enter a name,<br />
<strong>OneSight</strong> will automatically create a name.<br />
Hover Text – Enter the text you want displayed when you<br />
mouse-over the item.<br />
Drill Down URL – Enter the URL of the page you want to display<br />
when you click on the item.<br />
CSS Style – Enter any valid CSS attribute pair, separated by<br />
semicolons. For example, font-size : 24px; fontfamily:Rockwell;<br />
This field is automatically generated for<br />
Frame and Area items when you enter the height and width.<br />
Note: CSS is not validated.<br />
Frame URL – Enter the URL of the content you want to display.<br />
To use an Attribute Matrix View, display the view from the<br />
Status Menu, change status_view to status_attr in the URL<br />
and use this value. Doing this removes extraneous menu<br />
content. To use a <strong>OneSight</strong> report, display the report, refresh<br />
the UI to get the URL, change report.jsp to<br />
report_window.jsp in the URL and use this value. To include<br />
a mini-gauge report, change 1062 to 1061.<br />
The Attribute Matrix URL is “/status_attr.jsp” and the<br />
At=A=Glance URL is “/status_console.jsp.”<br />
Width – Enter the width of the frame in pixels.<br />
Height – Enter the height of the frame in pixels.<br />
Preview – Displays the item in a separate window.<br />
3. Enter a name for the item or let <strong>OneSight</strong> create a name.<br />
4. Enter the width and height of the item. The CSS Style field is<br />
automatically generated.<br />
5. Click Preview to view the item and click OK when you are done.<br />
Chapter 10: Configuring Attributes and Views 773
Configuring Custom Status Views<br />
Modifying Items<br />
To modify an item:<br />
1. Click the Configure menu.<br />
2. Select Custom Status Views.<br />
3. Select the Custom Status View containing the item you want to<br />
modify and click Modify.<br />
4. Select the item and click Modify to display the Custom Status<br />
View – Modify dialog box.<br />
5. Make any changes and click OK.<br />
Deleting Items<br />
To delete an item.<br />
1. Click the Configure menu.<br />
2. Select Custom Status Views.<br />
3. Select the Custom Status View containing the item you want to<br />
delete and click Modify.<br />
4. Select the item and click Remove.<br />
5. Click Yes when asked to confirm the deletion.<br />
Modifying a Custom Status View<br />
To modify a Custom Status View:<br />
1. Click the Configure menu.<br />
2. Select Custom Status Views.<br />
774 <strong>OneSight</strong> <strong>Administrator</strong> <strong>Guide</strong>
Configuring Custom Status Views<br />
3. Select the Custom Status View that you want to change and<br />
click Modify.<br />
4. Make any changes and click OK.<br />
Deleting a Custom Status View<br />
To delete a Custom Status View:<br />
1. Click the Configure menu.<br />
2. Select Custom Status Views.<br />
3. Select the Custom Status View that you want to delete and click<br />
Remove.<br />
4. Click Yes when asked to confirm the deletion.<br />
Custom Status View Example<br />
This example shows call queue monitors overlaid onto a map of the<br />
United States, their status indicated by the color or the push pin.<br />
One location displays a gauge report. An Attribute Matrix view is<br />
included showing the status of each location. The Current Average<br />
Queue value for all locations is displayed via a Compound Monitor.<br />
A link to a Custom Status View of Europe is also included.<br />
This example assumes that the following items have already been<br />
configured in <strong>OneSight</strong>:<br />
Four monitors, one for each call center<br />
A compound monitor for displaying the current average queue<br />
value<br />
Application and site attributes<br />
An Attribute Matrix View showing the status of each location<br />
Chapter 10: Configuring Attributes and Views 775
Configuring Custom Status Views<br />
The outer glow image has been imported into <strong>OneSight</strong><br />
1. Click Custom Status Views from the Configure page.<br />
776 <strong>OneSight</strong> <strong>Administrator</strong> <strong>Guide</strong>
Configuring Custom Status Views<br />
2. Click Add.<br />
3. Enter “Call Queues” in the Name field.<br />
4. Click Add to begin adding items. First we will add the<br />
background map image. Select Image in the Item Type field.<br />
Chapter 10: Configuring Attributes and Views 777
Configuring Custom Status Views<br />
5. Click Browse to select the image from the image library.<br />
Expand the tree and select the USA6c.gif file.<br />
6. Click OK. The Name and Image URL fields are automatically<br />
populated. Select 30 in the Image Opacity field. This will soften<br />
the background so that the monitor icons can be seen. The CSS<br />
Style field is automatically populated.<br />
778 <strong>OneSight</strong> <strong>Administrator</strong> <strong>Guide</strong>
Configuring Custom Status Views<br />
7. Click OK. Select USA6c.gif in the list to highlight it on the<br />
canvas, then click and drag it to position it.<br />
8. Next we will add the monitor groups. Click Add.<br />
9. Select Monitor Group or Monitor in the Item Type field. Select the<br />
Green River Call Queue monitor. The Hover Text and Drill Down<br />
URL fields are automatically populated.<br />
Chapter 10: Configuring Attributes and Views 779
Configuring Custom Status Views<br />
10. Next we will change the icons from the default icons to push<br />
pins. In the URL of Good State Icon line, click Browse. Select the<br />
pin_green.png file.<br />
780 <strong>OneSight</strong> <strong>Administrator</strong> <strong>Guide</strong>
Configuring Custom Status Views<br />
11. Click OK. Repeat this process for the remaining three state<br />
icons, selecting, pin_yellow.png, pin_red.png, and pin_grey.png.<br />
Chapter 10: Configuring Attributes and Views 781
Configuring Custom Status Views<br />
12. Click OK. The image is displayed in the top left-hand corner of<br />
the canvas. Select Green River Call Queue from the list and click<br />
and drag the pin to it’s appropriate location.<br />
782 <strong>OneSight</strong> <strong>Administrator</strong> <strong>Guide</strong>
Configuring Custom Status Views<br />
13. Repeat steps 8-12 for the remaining three monitors: Pittsburgh<br />
Call Queue, LA Call Queue, and Atlanta Call Queue.<br />
Chapter 10: Configuring Attributes and Views 783
Configuring Custom Status Views<br />
14. Next we will add the bubble that will contain the gauge report.<br />
Click Add. Select Image in the Item Type field. Click Browse.<br />
Select the Outer Glow – Grey .png file from the imports directory.<br />
This example assumes that you have imported this image. All<br />
imported images reside in the imports directory.<br />
15. Click OK.<br />
784 <strong>OneSight</strong> <strong>Administrator</strong> <strong>Guide</strong>
Configuring Custom Status Views<br />
16. Click OK. Select the Outer Glow – Grey .png file from the list and<br />
move it to the desired location.<br />
17. Next we will add the Gauge report. Before we add the item, we<br />
need to get the report’s URL.<br />
18. Click OK to save the Custom Status View. Click Close to exit<br />
the Custom Status View dialog box.<br />
19. Click the Reports tab. Display the Gauge report for the<br />
Pittsburgh Call Queue monitor. Click Refresh to display the<br />
correct URL.<br />
Chapter 10: Configuring Attributes and Views 785
Configuring Custom Status Views<br />
20. Change reports.jsp to report_window.jsp.<br />
21. Change 1060 in the URL to 1061 and click Refresh. Copy this<br />
URL from the slash in front of report_window.jsp.<br />
22. Return to the Custom Status View configuration. Select Call<br />
Queues and click Modify.<br />
23. Click Add to add the gauge report item.<br />
24. Paste the URL into the Frame URL field. The Name field is<br />
automatically populated.<br />
786 <strong>OneSight</strong> <strong>Administrator</strong> <strong>Guide</strong>
Configuring Custom Status Views<br />
25. Enter 155 in the Width field and 120 in the Height field. The CSS<br />
Style field is automatically populated.<br />
26. Click OK. Click on report_window.jsp and use the arrows to<br />
move the item to the top of the list, then place the item in the<br />
bubble.<br />
27. Next we will add the Attribute Matrix View showing the status<br />
of the call queues. First we need to get the ID.<br />
Chapter 10: Configuring Attributes and Views 787
Configuring Custom Status Views<br />
28. Click OK. Click Close to exit the Custom Status View<br />
configuration.<br />
29. Display the Attribute Matrix View from the Status menu. Copy<br />
the ID portion of the URL.<br />
30. Return to the Custom Status View configuration. Click Add to<br />
add a new item.<br />
31. Select Frame in the Item Type field. Enter<br />
/Status_attr.jsp?id= and paste the ID that you just copied.<br />
The Name field is automatically populated. Enter 700 in the<br />
Width field and 100 in the Height field. The CSS Style field is<br />
automatically populated.<br />
788 <strong>OneSight</strong> <strong>Administrator</strong> <strong>Guide</strong>
Configuring Custom Status Views<br />
32. Click OK. The item is displayed at the top of the canvas.<br />
33. Next we will add a title for the Custom Status View. Click Add.<br />
34. Select Text from the Item Type field. Enter font-size: 48px;<br />
font-family: garamond; font-style: italic in the CSS<br />
Style field. Enter Call Queues in the Text field. The Name field<br />
is automatically populated.<br />
Chapter 10: Configuring Attributes and Views 789
Configuring Custom Status Views<br />
35. Click OK. Select Call Queues from the list and move it to the<br />
appropriate location.<br />
36. Next we will add a monitor that displays the value of the<br />
Current Average Queue. Click Add.<br />
37. Enter a name for the monitor. Select the monitor. Click Show<br />
Metric Value.<br />
38. Click OK. Enter Current Average Queue in front of the variable<br />
in the Text field to add a label.<br />
39. Click Browse next to the URL of Good State Icon field. Select the<br />
moonlight_blank.gif file since we do not want to display a status<br />
790 <strong>OneSight</strong> <strong>Administrator</strong> <strong>Guide</strong>
Configuring Custom Status Views<br />
icon. We only want to display the value. Repeat this step for the<br />
remaining three icons.<br />
Chapter 10: Configuring Attributes and Views 791
Configuring Custom Status Views<br />
40. Click OK. Select the item from the list and move it to the<br />
appropriate location.<br />
41. Next we will add a link to a Custom Status View of Europe that<br />
has already been created. First we need to get the URL. Click<br />
OK. Click Close to exit the Custom Status View configuration.<br />
42. Display the Custom Status View of Europe from the Status<br />
menu. Copy the URL from /Status-view.jsp to the end.<br />
43. Return to the Custom Status View configuration. Click Add to<br />
add the item.<br />
792 <strong>OneSight</strong> <strong>Administrator</strong> <strong>Guide</strong>
Configuring Custom Status Views<br />
44. Select Text from the Item Type field. Enter Jump to Europe in the<br />
Name field. Copy the URL into the Drill Down URL field. Enter<br />
font-size:14px; font-style: italic; in the CSS Style<br />
field. Enter Europe >> in the Text field.<br />
45. Click OK. Select the item from the list and move it to the<br />
bottom right of the screen.<br />
46. Click OK. Click Close. You can now view the Custom Status<br />
Map.<br />
Chapter 10: Configuring Attributes and Views 793
Configuring Custom Status Views<br />
47. Select Custom Status Views from the Status menu and select<br />
Call Queues.<br />
794 <strong>OneSight</strong> <strong>Administrator</strong> <strong>Guide</strong>
C h a p t e r 11<br />
Configuring Database Storage and<br />
Locations<br />
To configure database storage, click the Configure menu, then click<br />
Database.<br />
Use the Database Storage settings to specify the number of days to<br />
keep records in the <strong>OneSight</strong> database.<br />
Specifying When to Delete Database Records<br />
Use the settings on the Database Storage tab to specify when<br />
various records should be deleted from the <strong>OneSight</strong> database.<br />
Deleting records from the database affects the types of reports that<br />
you will be able run.<br />
Alerts – Select the number of days that data about monitored web<br />
component alerts should remain in the <strong>OneSight</strong> database. This<br />
795
Specifying When to Delete Database Records<br />
includes alerts that have action plans associated with them as well<br />
as those that have no response configured.<br />
Action Plans (Resolved) – Select the number of days that data about<br />
resolved action plans should remain in the <strong>OneSight</strong> database.<br />
Historical Data Settings – The Historical Data settings refer to the<br />
types of data stored in the <strong>OneSight</strong> database for every item within<br />
every web component that <strong>OneSight</strong> measures or tests.<br />
Historical Data Detail – Type in the number of days that the<br />
<strong>OneSight</strong> database should store information about every<br />
measurement and alert that transpires for everything that <strong>OneSight</strong><br />
is measuring. From a resource perspective, this is “expensive”<br />
information to store, so a lower number is best if you are concerned<br />
about capacity.<br />
Historical Data Hourly Summary – The <strong>OneSight</strong> database also<br />
stores, for every hour that <strong>OneSight</strong> is monitoring an item, a value<br />
that summarizes the measurements returned by that item. Select the<br />
number of days you want the <strong>OneSight</strong> database to store that type<br />
of information.<br />
Audit Data – Specifies the number of days of data to store for the<br />
Audit report. The Audit report provides an audit trail of <strong>OneSight</strong><br />
configuration activity. Specify the number of days you want the<br />
<strong>OneSight</strong> database to store that type of information.<br />
Log Files – Specifies the number of days to keep log files.<br />
Auxiliary data – Specifies how long to store auxiliary data. This data<br />
includes the saved HTML source from successful Oracle Test for<br />
Web Applications Transaction monitor runs if the Save HTML from<br />
successful runs check box on the General tab of the Oracle Test for<br />
Web Applications Transaction monitor configuration is checked,<br />
the saved HTML source from failing Oracle Test for Web<br />
Applications Transaction monitor runs if the Save HTML from<br />
failing runs check box on the General tab of the Oracle Test for<br />
796 <strong>OneSight</strong> <strong>Administrator</strong> <strong>Guide</strong>
Specifying When to Delete Database Records<br />
Web Applications Transaction monitor configuration is checked,<br />
the detail data from successful runs of VoiceWatch, and the detail<br />
data from failed runs of VoiceWatch.<br />
UC Data – Specifies how long to store unified communication data<br />
collected from monitors such as Avaya Call Manager, Cisco,<br />
Microsoft, etc.<br />
Enable Automatic Scheduled Database Backup – When selected,<br />
database backup occurs automatically based upon the defined<br />
schedule.<br />
These options let you specify the frequency of the automatic<br />
database backup.<br />
Begin at – Enter the time that you want to begin database backup in<br />
24-hour time in hh:mm format.<br />
every –Select how often you want to schedule a database backup.<br />
Hour on minute – select a minute of the hour for the hourly<br />
backup.<br />
Day – no additional detail is required.<br />
Week on day – select a day (Sunday through Saturday) for the<br />
weekly backup.<br />
Bi-Weekly on day – select a day for the bi-weekly backup. The<br />
schedule starts on the next selected day. For example, if you<br />
create the schedule on Monday and select Tuesday as the backup<br />
day, the backup schedule starts tomorrow.<br />
Every Month on day – select a day (1 through 31) for the monthly<br />
backup.<br />
Last day of month – no additional detail is required.<br />
Chapter 11: Configuring Database Storage and Locations 797
Configuring Locations<br />
OK – Click OK to save changes you have made to the above fields.<br />
Once you save your changes, you cannot return to <strong>OneSight</strong>’s<br />
default settings.<br />
Configuring Locations<br />
The Locations tab displays a list of the Data Collectors and Remote<br />
Agents that have been installed. Once installed you can configure<br />
how the Data Collector or Remote Agent should respond when it<br />
disconnects or reconnects. The Location Group tab lets you<br />
organize locations into groups by creating a location group and<br />
selecting the locations to include in the group.<br />
Use the Configure Locations settings to specify the Location and<br />
Location Group options.<br />
Locations Tab – Use the settings on the Locations tab to specify<br />
how to respond when a Data Collector location disconnects or<br />
reconnects.<br />
798 <strong>OneSight</strong> <strong>Administrator</strong> <strong>Guide</strong>
Configuring Locations<br />
Locations Group Tab – Use the settings on the Locations Group tab<br />
to add or remove location groups and specify which location(s)<br />
belong to which group(s).<br />
Locations – The list of remote Data Collector Locations. Data<br />
Collectors are a separately installable service that registers with the<br />
<strong>OneSight</strong> server to provide data collection services for specified<br />
agents. Data Collector locations can be identified by any userdefined<br />
name.<br />
Network – The network to which this location belongs. This field<br />
can be used when filtering reports.<br />
Region – The region to which this location belongs. This field can<br />
be used when filtering reports.<br />
When this Data Collector Location disconnects Respond by – Shows<br />
the action plan to use if the currently selected Data Collector<br />
Location disconnects.<br />
When this Data Collector Location reconnects Respond by – Shows<br />
the action plan to use if the currently selected Data Collector<br />
Location reconnects.<br />
Modify – Click Modify to change the selected locations’ responses.<br />
Remove – Click Remove to remove the selected location.<br />
Chapter 11: Configuring Database Storage and Locations 799
Configuring Locations<br />
Used By – Opens a dialog box that shows which data collectors(s)<br />
are connected to the location and which monitor groups and<br />
monitors are using the collector(s).<br />
800 <strong>OneSight</strong> <strong>Administrator</strong> <strong>Guide</strong>
Configuring Locations<br />
Modifying Locations<br />
Specify the action plan to use if the selected Data Collector<br />
Location disconnects or reconnects.<br />
Name – Displays the name of the data collector.<br />
When this Data Collector Location disconnects Respond by – Select<br />
the action plan to use to respond to a Data Collector Location<br />
disconnecting.<br />
When this Data Collector Location reconnects Respond by – Select<br />
the action plan to use to respond to a Data Collector Location<br />
reconnecting.<br />
You can select one of the existing action plans or configure Action<br />
Plans to use to respond to Data Collectors disconnecting or<br />
reconnecting.<br />
Network this Data Collector Location belongs to – Enter or select the<br />
network to which this location belongs. This information can be<br />
used when filtering reports.<br />
Chapter 11: Configuring Database Storage and Locations 801
Configuring Locations<br />
Region this Data Collector Location belongs to – Enter or select the<br />
region to which this location belongs. This information can be used<br />
when filtering reports.<br />
Adding Location Groups<br />
To add Location Groups:<br />
1. Click the Configure menu.<br />
2. Select Locations to open the Configure Locations page.<br />
3. Click the Location Groups tab.<br />
Location Groups – The list of Location Groups defined in<br />
<strong>OneSight</strong>. Location groups that are not being used by a user<br />
group will be shown as not in use. Use Add and Remove to<br />
customize the list.<br />
Add – Opens a dialog box for specifying a new location group<br />
name.<br />
802 <strong>OneSight</strong> <strong>Administrator</strong> <strong>Guide</strong>
Configuring Locations<br />
Remove – Click Remove to remove the selected location group.<br />
Used by – Displays a list of user groups that are using this<br />
location. This button is not available if there are no user groups<br />
using this location.<br />
Locations – The list of remote Data Collector Locations. Select<br />
a location group name and then select Add to display a list of<br />
locations to select from.<br />
Add – Opens a dialog box for selecting a location to add to the<br />
group.<br />
Remove – Click Remove to remove the selected location from<br />
the group.<br />
4. Click Add.<br />
Location Group Name – Specify a name for the Location Group.<br />
5. Define a name for the group and click OK.<br />
6. Click Add to select a location to add to the group and click OK.<br />
Removing Location Groups<br />
To remove location groups:<br />
1. Click the Configure menu.<br />
2. Select Locations to open the Configure Locations page.<br />
Chapter 11: Configuring Database Storage and Locations 803
Configuring Locations<br />
3. Click the Location Groups tab.<br />
4. Select the location group you want to remove.<br />
5. Click Remove.<br />
6. Click Yes to confirm the removal.<br />
7. Click Close.<br />
804 <strong>OneSight</strong> <strong>Administrator</strong> <strong>Guide</strong>
C h a p t e r 12<br />
Configuring Users<br />
Configuring Roles<br />
A user must log in and be authenticated to use the <strong>OneSight</strong><br />
Console. Each user is assigned to a user group and within that user<br />
group, is assigned a role. A user group is a hierarchical structure<br />
representing the user’s organization. The user group determines<br />
which objects, such as monitors, profiles, etc., that the users in the<br />
user group can access. For example, engineering will have different<br />
access requirements than marketing.<br />
The user’s role determines individual permissions, such as view<br />
access, reporting access, and configuration access to the objects<br />
available to the user group. For example, an administrator will have<br />
different access requirements than an operator.<br />
In addition, individual objects (such as profiles, monitors, etc.) can<br />
control which user groups have read, write, and delete access to<br />
them. This is done using the Access Control tab for that object.<br />
The user’s role determines individual permissions, such as view<br />
access, reporting access, and configuration access to the objects<br />
available to the user group. <strong>OneSight</strong> comes with four default roles:<br />
<strong>Administrator</strong>, Analyst, Business, and Operator. These roles cannot<br />
be modified or deleted. Use the Role editor to add, clone, modify,<br />
and remove roles.<br />
To add roles:<br />
1. Click the Configure menu.<br />
805
Configuring Roles<br />
2. Select Roles to display the Roles dialog box.<br />
This dialog box has the following options:<br />
Add – Displays the Role Editor for adding a new role.<br />
Clone – Copies the selected role making it easy to create similar<br />
roles. Click Modify to edit the new role.<br />
View – Displays the Role Editor for viewing the selected user’s<br />
settings.<br />
Modify – Displays the Role Editor for modifying the selected<br />
role.<br />
Remove – Deletes the selected role. Roles that are in use cannot<br />
be deleted.<br />
Used by – Displays a dialog box that lists the users that have<br />
been assigned to the selected role.<br />
Name – Lists all of the configured roles.<br />
806 <strong>OneSight</strong> <strong>Administrator</strong> <strong>Guide</strong>
Configuring Roles<br />
3. Click Add to display the Role Editor.<br />
4. Enter a name for the role.<br />
5. Assign permissions by selecting a tab and selecting or<br />
deselecting privileges.<br />
6. Click OK.<br />
Chapter 12: Configuring Users 807
Configuring Roles<br />
Configuration Rights Tab<br />
The Configuration Rights tab lets you assign permissions to<br />
configuration tasks.<br />
Note: It is possible for users with permission to configure roles to<br />
either assign their own role all permissions or no permissions,<br />
potentially giving themselves more permissions than necessary or<br />
locking themselves out of all configuration tasks.<br />
View Configuration – Select this check box to access the<br />
configuration permissions.<br />
Configure User Groups – Lets the user configure user groups.<br />
Configure Users – Lets the user configure users. This options is only<br />
available for <strong>Administrator</strong> users.<br />
Change User Password – Lets the user change user passwords in the<br />
User Editor.<br />
808 <strong>OneSight</strong> <strong>Administrator</strong> <strong>Guide</strong>
Configuring Roles<br />
Configure Roles – Lets the user configure roles.<br />
Configure Monitors – Lets the user configure monitors.<br />
Configure Monitor Groups – Lets the user configure monitor groups.<br />
Configure Profiles – Lets the user configure profiles.<br />
Configure Metrics – Lets the user configure metrics.<br />
Configure Systems – Lets the user configure systems.<br />
Configure Attributes – Lets the user configure attributes.<br />
Configure Support Page – Lets the user configure the support page.<br />
Configure SLAs – Lets the user configure service level agreements.<br />
Configure Actions – Lets the user configure actions.<br />
Configure System Passwords – Lets the user configure system<br />
passwords.<br />
Configure Proxy Settings – Lets the user configure proxy settings for<br />
monitors.<br />
Schedule Downtimes – Lets the user schedule downtimes.<br />
Configure Alert Message Templates – Lets the user configure alert<br />
message templates.<br />
Configure Action Plans – Lets the user configure action plans.<br />
Configure Time Intervals – Lets the user configure time intervals.<br />
Configure Database Options – Lets the user configure database<br />
storage options.<br />
Configure Location – Lets the user configure locations.<br />
Chapter 12: Configuring Users 809
Configuring Roles<br />
Alerts Rights<br />
Use Server Utilities – Lets the user access the Trace Route, Regex,<br />
and MIB Browser utilities.<br />
View Support Page – Lets the user view the support page.<br />
Configure Views – Lets the user configure attribute matrix views and<br />
custom status views.<br />
Note: Only users in the default user group can access the support<br />
page, alert templates, location configuration, and database storage<br />
options.<br />
The Alerts Rights tab lets you set alert privileges.<br />
View Alerts – Select this check box to access alert rights.<br />
Retire Alerts – Lets the user retire alerts.<br />
810 <strong>OneSight</strong> <strong>Administrator</strong> <strong>Guide</strong>
Configuring Roles<br />
Reporting Rights<br />
The Reporting Rights tab lets you set report permissions.<br />
View Reports – Select this check box to access reporting<br />
permissions.<br />
View SLA Reports – Lets the user view service level agreement<br />
reports.<br />
Email Reports – Lets the user email reports.<br />
Save Reports – Lets the user save reports.<br />
Schedule Reports – Lets the user schedule reports if Save Reports is<br />
selected.<br />
Chapter 12: Configuring Users 811
Configuring Roles<br />
Status Rights<br />
The Status Rights tab lets you set status permissions.<br />
Request updated sample value – Lets the user request an updated<br />
sample value from the Smartlink icon menu on the Status and User<br />
Experience pages.<br />
View Status Page – Lets the user view the monitor status page.<br />
View User Experience Page – Lets the user view the user experience<br />
page.<br />
View Attribute Matrix Page – Lets the user view the attribute matrix<br />
page.<br />
View Custom Status Page – Lets the user view the custom status<br />
page.<br />
View UC Voice Quality Page – Lets the user view the UC Voice<br />
Quality page.<br />
812 <strong>OneSight</strong> <strong>Administrator</strong> <strong>Guide</strong>
Configuring Roles<br />
Access Control<br />
Use this tab to configure which user groups have access to this<br />
object.<br />
Deleting Roles<br />
User Group – Displays the user group names.<br />
Owner – The user group for this role. A role can be directly owned<br />
by a single user group.<br />
Global Read – Gives read access to this user group and all of its sub<br />
user groups.<br />
Read – Gives read permission to the user group.<br />
Write – Gives write permission to the user group.<br />
Delete – Gives delete permission to the user group.<br />
The default roles and roles that are in use cannot be deleted. To<br />
delete a role:<br />
1. Click the Configure menu.<br />
2. Select Roles<br />
Chapter 12: Configuring Users 813
Configuring User Groups<br />
3. Select the role you want to delete.<br />
4. Click Remove.<br />
Configuring User Groups<br />
A user group is a logical grouping of users that own monitor<br />
groups. All objects that are needed to create a monitor group<br />
(monitors, system, profiles, etc) can be created for a user group and<br />
these objects will be accessible only to users that are members of<br />
the user group (and any super user).<br />
User groups can be hierarchical to match the structure of your<br />
organization.<br />
Each user may belong to only one user group and every object in<br />
the system that is owned by a user group may not be seen or used by<br />
any other user group’s users.<br />
There is a special user group, called Default, that serves as a place<br />
where global objects such as profiles, metrics, and attributes can<br />
reside. Global objects can be used and viewed by all other user<br />
groups.<br />
To add User Groups:<br />
1. Click the Configure menu.<br />
814 <strong>OneSight</strong> <strong>Administrator</strong> <strong>Guide</strong>
Configuring User Groups<br />
2. Click Groups to open the User Groups page.<br />
Use the Configure User Groups options to add, modify, and<br />
remove user groups in the <strong>OneSight</strong> configuration.<br />
User Groups – Lists the currently defined user groups in the<br />
<strong>OneSight</strong> configuration. Select the check box to enable the User<br />
Group in the <strong>OneSight</strong> configuration. Clear the check box to<br />
disable the User Group in the configuration. If a user group is<br />
disabled then login for all users belonging to that user group<br />
will be disabled (except for super users which may always<br />
login) and all monitors and monitor groups within that user<br />
group will not sample.<br />
Add – Opens the User Group Editor for specifying the License<br />
and Location Group information for a new User Group.<br />
Modify – Opens the User Group Editor for modifying the<br />
License and Location Group information for an existing User<br />
Group.<br />
Remove – Deletes the currently selected User Group from the<br />
<strong>OneSight</strong> configuration. If a user group is deleted, then all<br />
users, monitors, monitor groups, systems, profiles, attributes<br />
Chapter 12: Configuring Users 815
Configuring User Groups<br />
and other objects owned by that user group will be deleted.<br />
Super users may delete users groups.<br />
3. Click Add.<br />
Use the Licenses tab to allocate specific licenses to User<br />
Groups in the <strong>OneSight</strong> configuration.<br />
Name – Enter the user group name.<br />
E-mail – Enter the e-mail address of the primary contact for this<br />
user group.<br />
Parent User Group – Select the user group to which this user<br />
group belongs.<br />
Do not restrict licenses – When selected, User Group has access<br />
to all available licenses. The License Type, Avail/In Use, and<br />
Allocation options are dimmed. When cleared, you can allocate a<br />
specific number of each type of license to the User Group. The<br />
816 <strong>OneSight</strong> <strong>Administrator</strong> <strong>Guide</strong>
Configuring User Groups<br />
Avail/In Use column shows the number of available licenses and<br />
the number currently in use. Specify the number of each type of<br />
license to allocate to the User Group in the Allocation column.<br />
Refer to How <strong>OneSight</strong> Determines the License Type in<br />
Chapter 2 for information on determining which licenses to use.<br />
License Type – Lists each type of <strong>OneSight</strong> license.<br />
Avail/In Use – Shows the number of available <strong>OneSight</strong> licenses<br />
and the number currently in use.<br />
Allocation – Specifies the number of each type of license to<br />
allocate to the User Group. The Do not restrict licenses check<br />
box must be cleared to allocate a specific number of licenses to<br />
the User Group.<br />
Note: If you have monitors that are in a disabled state because<br />
there are not enough licenses, and you increase the number of<br />
licenses, the disabled monitors are not automatically enabled.<br />
You must enable the individual monitors by deselecting and<br />
selecting the Enable button for the monitors you want to enable<br />
on the Status Detail page. Checking and unchecking the Enable<br />
button for the monitor group will have no effect. Check and<br />
uncheck the Enable button at the monitor level.<br />
4. Enter a User Group Name.<br />
5. Specify the email address for the User Group.<br />
6. Select the parent user group to which this user group belongs.<br />
7. To allocate licenses for the User Group, clear the Do not restrict<br />
licenses check box, and then specify the number of each type of<br />
license to allocate to the User Group in the Allocation column.<br />
Note: If you have monitors that are in a disabled state because<br />
there are not enough licenses, and you increase the number of<br />
licenses, the disabled monitors are not automatically enabled.<br />
You must enable the individual monitors by deselecting and<br />
Chapter 12: Configuring Users 817
Configuring User Groups<br />
selecting the Enable button for the monitors you want to enable<br />
on the Status Detail page. Checking and unchecking the Enable<br />
button for the monitor group will have no effect. Check and<br />
uncheck the Enable button at the monitor level.<br />
8. To provide unrestricted licenses for the User Group, select the<br />
Do not restrict licenses check box.<br />
9. To specify locations associated with the User Group, click the<br />
Location Group tab.<br />
Use the Location Groups tab to associate a User group with a<br />
specific Location Group in the <strong>OneSight</strong> configuration.<br />
Location Group – Provides a list of the currently available<br />
Location Groups. Select a Location Group to associate with the<br />
User Group or add a new Location Group.<br />
10. Select the Location Group to associate with the user group.<br />
Removing User Groups<br />
To remove User Groups:<br />
1. Click the Configure menu.<br />
2. Select Groups to open the User Groups page.<br />
818 <strong>OneSight</strong> <strong>Administrator</strong> <strong>Guide</strong>
Adding New Users<br />
3. Select the User Group Name to remove.<br />
4. Click Remove.<br />
5. Click Yes to confirm.<br />
Adding New Users<br />
The User Editor allows you to add new users or change the name,<br />
password, or privilege level of existing users.<br />
The Configure Users page lists all of the users that are currently<br />
allowed access to the <strong>OneSight</strong> Console. This is where you specify<br />
who can log on and what level of access each user has. You can add<br />
new users, modify the name, password, default view, or access level<br />
of any selected user, and remove an existing user.<br />
Use these options to manage access to Empirix <strong>OneSight</strong>:<br />
Check Box – The check box adjacent to each user controls whether<br />
or not the user is enabled. When selected, the user is enabled. When<br />
cleared, the user is disabled. Disabled users cannot log in to<br />
<strong>OneSight</strong>.<br />
Chapter 12: Configuring Users 819
Adding New Users<br />
Locked out users are unchecked and have the locked out icon beside<br />
the check box.<br />
Name – Shows a list of all identified <strong>OneSight</strong> users. A check in the<br />
first column indicates that the user is enabled.<br />
To modify the name or access rights of an existing user, select<br />
the user name in the list and click Modify.<br />
To delete a user from the list, select the user name in the list and<br />
click Remove.<br />
User Group – shows the user group to which the user belongs.<br />
Add – To set up a new <strong>OneSight</strong> user, click Add to open the User<br />
Editor. After entering information to specify the user’s password<br />
and how the user may interact with the <strong>OneSight</strong> Console, click OK<br />
to save the user information and return to the Configure Users page.<br />
Modify – To change the name, password, default view, or access<br />
rights of an existing user, double-click the user name in the list. Or,<br />
select the user name in the list and click Modify. In the User Editor,<br />
make the desired changes and click OK to update the user<br />
information and return to the Configure Users page.<br />
Remove – To remove a user from the list and prevent access to the<br />
<strong>OneSight</strong> Console, select the user name in the list and click<br />
Remove.<br />
Global Options – Displays the User Global Options dialog box for<br />
configuring when passwords expire, how many times the user can<br />
try to log in before being locked out, and what characters the<br />
password must contain.<br />
820 <strong>OneSight</strong> <strong>Administrator</strong> <strong>Guide</strong>
Modifying User Settings<br />
Modifying User Settings<br />
A user must log in and be authenticated to use the <strong>OneSight</strong><br />
Console, and there are different privilege levels for users. The User<br />
Editor allows you to add new users or change the name, password,<br />
or privilege level of existing users.<br />
Use these options to configure a <strong>OneSight</strong> user definition:<br />
Do not reenable this user after timeout – This option is only<br />
displayed when the user has been disabled based on security<br />
constraints. For example, when the user has failed to log in for the<br />
number of retries set in User Global Options. When selected, the<br />
user is disabled and cannot log in to <strong>OneSight</strong> until this check box<br />
is cleared by the <strong>Administrator</strong><br />
User Name – Type the name that the user must provide to log in to<br />
the Empirix <strong>OneSight</strong> Console. This value is not case sensitive.<br />
Password – Type a string that the user must provide to log in to the<br />
Console. This value is case sensitive.<br />
Chapter 12: Configuring Users 821
Modifying User Settings<br />
Confirm Password – Retype the password you entered in the<br />
Password box. This value is case sensitive.<br />
Force password change on next login – Forces the user to change<br />
his/her password at the next login. This field is only displayed when<br />
the password has been set to expire on the User Global Options<br />
dialog box.<br />
E-mail – Enter the user’s email address.<br />
Time Zone – Select the user’s time zone.<br />
User group – Select the user group to which this user belongs.<br />
Role – Select the user’s role. The role determines the user’s access<br />
privileges.<br />
Status Grouping – Select the status grouping that <strong>OneSight</strong> will use<br />
to display monitors on the Status page.<br />
Start Page – Select the view that you want displayed when you log<br />
in to <strong>OneSight</strong>.<br />
Overview – Displays the Overview page.<br />
Default Status – Displays the General Status page.<br />
User Experience – Displays the User Experience page.<br />
Service Level Agreement – Displays the SLA Status page.<br />
Attribute Matrix View –Displays the selected Attribute Matrix<br />
View.<br />
Custom Status View –Displays the selected Custom Status View.<br />
Alerts – Displays the Alerts page.<br />
Reports – Displays the selected dashboard report.<br />
822 <strong>OneSight</strong> <strong>Administrator</strong> <strong>Guide</strong>
Modifying User Settings<br />
Editing User Rights<br />
Configuration – Displays the Configuration page.<br />
Attribute Matrix – Select the Attribute Matrix View that you want<br />
displayed when the Attribute Matrix View is the selected view.<br />
Custom Status – Select the Custom Status View that you want<br />
displayed when the Custom Status View is the selected view.<br />
Dashboard – Select the Dashboard report you want displayed when<br />
the Reports page is the selected view.<br />
You can configure the rights that each user has by clicking the<br />
Rights tab.<br />
Note: You cannot configure your own rights.<br />
Change password in My Settings – If checked, the user can change<br />
his/her password. If not checked, the user can only change his/her<br />
email address and time zone.<br />
Allow Windows Login – When selected, allows the user to use<br />
windows login for <strong>OneSight</strong> authentication.<br />
Chapter 12: Configuring Users 823
Configuring Global Options<br />
Configuring Global Options<br />
Use the User Global Options dialog box for configuring when<br />
passwords expire, how many times the user can try to log in before<br />
being locked out, and what characters the password must contain.<br />
Password Expiration Policy – Use these settings to configure when<br />
passwords will expire.<br />
Expires after days– Enter the number of days after which the<br />
user will have to enter a new password. When this field is<br />
selected, the Force password change on next login is displayed in<br />
the User Editor.<br />
Never expires – When selected, passwords will not expire.<br />
824 <strong>OneSight</strong> <strong>Administrator</strong> <strong>Guide</strong>
Configuring Global Options<br />
Expires after the user has not logged in for days – This option<br />
is available when Expire after user reset the password for is<br />
selected. Enter the number of days after which the user account<br />
will expire if the user has not logged in during this time.<br />
Logout user when idle for minutes – Enter the number of<br />
minutes after which the user will be logged out if no action has<br />
been taken in <strong>OneSight</strong>.<br />
Password Lockout Policy – Use these options to configure the<br />
number of attempts users will have to log in and how long they will<br />
be locked out if they fail to login.<br />
Disable accounts after unsuccessful login attempts –<br />
Enter the number of attempts the user will have to log in.<br />
Disable account for hours – Enter the number of hours<br />
to lock out users after an unsuccessful attempt to log in.<br />
Disable account until administrator reset – When selected, users<br />
are locked out until the administrator resets the password.<br />
Password Content Policy – Use these options to configure the<br />
characters that must be included in the password.<br />
Passwords must contain alpha characters (a-z) – When selected,<br />
passwords must contain alphabetic characters.<br />
Passwords must contain number characters (0-9) – When selected,<br />
passwords must contain numeric characters.<br />
Passwords must contain upper and lower case alpha characters (az<br />
and A-Z) – When selected, passwords must contain both upper<br />
and lower case alphabetic characters.<br />
Passwords must contain special characters (~!@#$%^&*()+-,.) –<br />
When selected, passwords must contain special characters.<br />
Chapter 12: Configuring Users 825
Configuring Global Options<br />
Passwords must be different from former times –When<br />
selected, the password must be different from the previous<br />
number of passwords.<br />
Passwords must contain at least characters – When<br />
selected, passwords must contain the indicated number of total<br />
characters.<br />
Passwords must match regular expression – When selected,<br />
passwords must match the indicated regular expression. The<br />
regular expression can be used to design a custom password<br />
requirement that forces any combination of characters in any<br />
particular order and pattern, to keep a password to a minimum or<br />
maximum length, or to fit a particular style or format.<br />
826 <strong>OneSight</strong> <strong>Administrator</strong> <strong>Guide</strong>
C h a p t e r 13<br />
Configuring Service Level<br />
Agreements<br />
The Service Level Manager (SLM) handles the continuous process<br />
of managing, measuring, reporting, and improving the quality of<br />
services provided by IT and service providers. This module is<br />
licensed separately and the options associated with it are only<br />
displayed if a license has been purchased.<br />
Service Level Agreements (SLA) describe the expected level of<br />
service and what happens when the levels or targets are not met.<br />
Targets define the expected level of service or threshold in a<br />
Service Level Objective. Service Level Objectives (SLO) are the<br />
specific targets of performance or availability for monitored<br />
elements. For example, the transaction response time cannot exceed<br />
ten seconds. An SLA is comprised of multiple SLOs.<br />
SLOs can only be created for monitors that collect quantifiable<br />
performance data for metrics other than availability metrics.<br />
An SLA belongs to a user group and can be configured by<br />
administrators or super users. <strong>Administrator</strong>s can configure SLAs in<br />
their own user group. Super users can configure SLAs in any user<br />
group.<br />
SLOs can be measured during time intervals defined by you. The<br />
time interval defines the hours of operation that a service is in<br />
effect. They can be monitored on availability or by component<br />
dependent metrics such as response time or CPU usage.<br />
827
Creating SLAs<br />
When configuring the SLA you can set up a schedule for receiving<br />
notification of any SLOs in the SLA that are below a specified<br />
warning level. The warning level is a “target” that allows you to<br />
proactively respond before service levels are missed. An email<br />
containing a report is sent if at least one SLO is in a warning state.<br />
This report can also be viewed from the reports menu. It is the third<br />
view of the SLA.<br />
SLA status can be viewed by selecting SLA Status on the Console<br />
main menu. Reports can be viewed by selecting the Reports tab.<br />
The ongoing process of service level management includes the<br />
following steps:<br />
Benchmarking – The process of measuring and understanding<br />
what you are already providing. Prior to setting targets for your<br />
Service Level Objective you should understand the level of<br />
performance that you are currently delivering. You should<br />
understand how each transaction or monitored element has<br />
performed historically because for example, you would not want<br />
to commit to a five second SLO for response time when the<br />
transaction has never performed under seven seconds.<br />
The things that you benchmark depend on your services and<br />
requirements. For example, you may benchmark the response<br />
time perceived by users, the accuracy of content and data, the<br />
ability to complete end-user transactions, or operational<br />
efficiency such as mean time to repair or mean time between<br />
failures.<br />
Defining – The process of defining Service Level Agreements and<br />
setting realistic Service Level Objectives. Each end-user service<br />
can be managed separately based on the business needs. Targets<br />
and warning thresholds should be based on the benchmark<br />
results.<br />
In addition, the objectives can be managed according to business<br />
828 <strong>OneSight</strong> <strong>Administrator</strong> <strong>Guide</strong>
Creating SLAs<br />
Creating SLAs<br />
operations by defining time intervals. For example, some<br />
requirements may only need monitoring during peak hours.<br />
Managing – The process of measuring and managing from the<br />
end-user perspective. <strong>OneSight</strong> provides real-time alerting so that<br />
you can be proactive when service levels are in jeopardy, that is,<br />
when they reach the defined warning level. In addition, <strong>OneSight</strong><br />
provides real-time and historical reports for availability and<br />
performance.<br />
You can also use the SLA status page to immediately understand<br />
which SLAs are in violation and to prioritize response activities<br />
for restoring impacted services.<br />
Improving – The process of continuously understanding where<br />
and what improvements can be made.<br />
The overall tasks for configuring an SLA are as follows:<br />
1. Configure time intervals. Time intervals are used when creating<br />
SLOs to indicate the time period for which the objective applies.<br />
Refer to Chapter 14.<br />
2. Create the SLA.<br />
3. Create the SLOs.<br />
To create an SLA:<br />
1. Click the Configure menu.<br />
Chapter 13: Configuring Service Level Agreements 829
Creating SLAs<br />
2. Click Service Level Agreements to open the Configuring Service<br />
Level Agreements page.<br />
This dialog box has the following options:<br />
Service Level Agreements – lists existing SLAs.<br />
Add – displays the New Service Level Agreement dialog box<br />
for adding a new SLA.<br />
Modify – displays the Update Service Level Agreement dialog<br />
box for modifying the selected SLA.<br />
Remove – deletes the selected SLA.<br />
Service Level Objectives – displays the existing SLOs for the<br />
selected SLA.<br />
Add – displays the New Service Level Objective dialog box<br />
for adding a new SLO.<br />
830 <strong>OneSight</strong> <strong>Administrator</strong> <strong>Guide</strong>
Creating SLAs<br />
Modify – displays the Update Service Level Objective dialog<br />
box for changing the selected SLO.<br />
Remove – deletes the selected SLO.<br />
3. Click Add under the Service Level Agreements section.<br />
This dialog box has the following options:<br />
General Tab<br />
Name – enter the name of the SLA.<br />
Description – enter a description of the SLA.<br />
Automatic warning schedule – sends an email at the configured<br />
time if an SLO in the SLA is in a warning state. The email<br />
contains the Service Level Warning report that can also be<br />
viewed from the Reports menu.<br />
Begin at – select the time at which to begin.<br />
Chapter 13: Configuring Service Level Agreements 831
Creating SLAs<br />
Note: When using Repeat every hour on minute, this field is<br />
ignored. The value in the on minute field is used as the Begin at<br />
time.<br />
Do once on Date – sends email on the selected date.<br />
Repeat every – select the interval for sending the email. The<br />
options are:<br />
Hour on minute – sends email every hour on the selected<br />
minute.<br />
Day – sends email once a day at the selected time.<br />
Week on day – sends email once a week on the selected day<br />
and time.<br />
Month on day – sends email once a month on the selected date<br />
and time.<br />
To – enter the email addresses to send the report to separated by<br />
a comma or space.<br />
Access Control Tab<br />
The Access Control tab lets you specify which user groups can<br />
read, write, or delete this SLA.<br />
Owner – The user group for this SLA. an SLA can be directly<br />
owned by a single user group.<br />
User Group – Displays the user group names.<br />
Global Read – Gives read access to this user group and all of its<br />
sub user groups.<br />
Read – Gives read permission to the user group.<br />
Write – Gives write permission to the user group.<br />
832 <strong>OneSight</strong> <strong>Administrator</strong> <strong>Guide</strong>
Creating SLOs<br />
Delete – Gives delete permission to the user group.<br />
4. Enter the name and description of the SLA.<br />
5. Select the notification information.<br />
6. Click OK.<br />
Creating SLOs<br />
An SLO can be based on either availability or performance. For<br />
each, you can specify a target percentage and a warning percentage.<br />
The target percentage is either the percentage of time that the metric<br />
must be available or must be performing at the specified level. The<br />
warning level is the percentage below which you want to be notified<br />
so that you can do something before the percentage goes below the<br />
target causing you to pay a penalty to your customers. For example,<br />
if your target is 95% and the warning level is 97% and the SLO<br />
goes to 96%, you will get a notification. The warning level should<br />
be higher than the target and both percentages must be less than<br />
100%. <strong>OneSight</strong> supports targets up to 99.999%.<br />
You can also select how to aggregate the data. This affects<br />
reporting. For example, if you have a performance objective with a<br />
threshold of less than 3 seconds, a target of 99%, and daily<br />
aggregation, this means that you want 99% of the samples to be<br />
under 3 seconds. For reporting purposes, <strong>OneSight</strong> counts the<br />
number of samples under three seconds for the day because<br />
aggregation is daily. If the number of failures divided by the<br />
number of samples is less than 99%, the SLO fails for the day.<br />
For reporting, the compounding period is the report period. For<br />
example, monthly or weekly. The average is never reset.<br />
For an availability objective, the samples are computed, not the<br />
time. This means that if you increase the sampling rate on the<br />
fifteenth of the month and get better results for the last half of the<br />
Chapter 13: Configuring Service Level Agreements 833
Creating SLOs<br />
month, the SLO will be better than if a time-based calculation had<br />
been used.<br />
To create an SLO:<br />
1. Click the Configure menu.<br />
2. Click Service Level Agreements to open the Configure Service<br />
Level Agreements page.<br />
3. Select the SLA for which you want to create an SLO.<br />
834 <strong>OneSight</strong> <strong>Administrator</strong> <strong>Guide</strong>
Creating SLOs<br />
4. Click Add in the Service Level objectives section.<br />
This dialog box has the following options:<br />
Service Level Agreement – lists the SLAs to which you have<br />
access.<br />
Monitor Group – select the monitor group containing the<br />
monitor that is required for this SLO.<br />
Monitor – select the monitor or monitors. Monitors can be used<br />
in more than one SLO.<br />
Note: Some monitors can be configured only for availability.<br />
These are monitors for which a location cannot be specified and<br />
monitors that monitor availability instead of performance. For<br />
example, SNMP Trap, Service, etc.<br />
Location – select the location of the monitor. This field is<br />
displayed only if more than one location is defined.<br />
Chapter 13: Configuring Service Level Agreements 835
Creating SLOs<br />
Include page level targets – for transaction type monitors lets<br />
you select steps for use in an SLO. Each step in a transaction<br />
can be an SLO; however, only those you select will be used.<br />
Note: If you are interested in only one step in a transaction, it is<br />
recommended than you use a URL monitor.<br />
Compound availability – lets you combine metrics to determine<br />
if the objective is being met. For example, you may have three<br />
ping monitors and the objective is that the average availability<br />
should not be less than 95%.<br />
5. Click Next. If you selected Compound availability the next dialog<br />
box is displayed. If you did not select this option, go to the next<br />
dialog box.<br />
This dialog box has the following options:<br />
Metrics/Components – Lists the monitors that you selected on<br />
the New Service Level Objective dialog box.<br />
Name – enter the name of the SLO.<br />
Compounding – select the type of compounding.<br />
836 <strong>OneSight</strong> <strong>Administrator</strong> <strong>Guide</strong>
Creating SLOs<br />
Average – averages the results of the selected metrics. For<br />
example, if you have three ping monitors and the first is<br />
available 100% of the time, the second 95% of the time, and<br />
the third is 90% of the time, the average is 95%.<br />
Minimum – takes the lowest value of all of the monitors in the<br />
group. In the above example, the minimum availability is<br />
90%.<br />
Add – adds the SLO.<br />
Remove – deletes the selected SLO.<br />
6. Select the metrics to use in the SLO.<br />
7. Enter a name, select the type of compounding, and click Create<br />
SLOs.<br />
This dialog box lets you set up availability and metric<br />
performance SLOs for individual monitors. You can set up one<br />
or both of these SLOs . Each SLO will be displayed separately in<br />
the Configure Service Level Agreements dialog box. They will<br />
be labeled as Avail or Metric Perf.<br />
This dialog box has the following options:<br />
Name – the name of the SLO.<br />
Chapter 13: Configuring Service Level Agreements 837
Creating SLOs<br />
Availability – lets you configure an availability SLO. For<br />
example, the target may be that the monitor must be available<br />
95% of the time.<br />
Time Interval – select the time interval during which the target<br />
must be met. These intervals are configured by selecting Time<br />
Intervals from the Configure menu.<br />
Target – enter the percentage of time that the monitor must be<br />
available, up to 99.999%.<br />
Send Availability Warning – lets you configure when the monitor<br />
is considered to be in a warning state. If you set up a schedule<br />
when you created the SLA, this configuration determines when<br />
an email is sent.<br />
Aggregation – select how to aggregate the results, daily,<br />
weekly, monthly, or user-configured date interval.<br />
Warning Level – enter the percentage at which the monitor is<br />
considered to be in a warning state. This percentage must be<br />
higher than the target percentage. When the SLO goes below<br />
this percentage, a notification is sent.<br />
Grace Period – enter the length of time, in minutes, to wait<br />
before considering availability to be a problem. For example, if<br />
you enter fifteen minutes, the sample failure must occur for<br />
fifteen minutes before being considered a problem. The<br />
availability report will ignore the failure samples within this<br />
outage.<br />
Metric Performance – lets you configure a metric performance<br />
SLO. For example, 95% of the samples should be less than 5<br />
seconds.<br />
Time Interval – select the time interval during which the target<br />
must be met. These intervals are configured by selecting Time<br />
Intervals from the Configure menu.<br />
838 <strong>OneSight</strong> <strong>Administrator</strong> <strong>Guide</strong>
Creating SLOs<br />
Target – enter the percentage of time that the monitor must<br />
meet the threshold, up to 99.999%.<br />
Threshold – select the type of threshold and enter the amount.<br />
In the above example, you would select less than and enter 5.<br />
Send Metric Perf. Warning – lets you configure when the monitor<br />
is considered to be in the warning state. If you set up a schedule<br />
when you created the SLA, this configuration determines when<br />
an email is sent.<br />
Aggregation – select how to aggregate the results, daily,<br />
weekly, or monthly.<br />
Warming Level – enter the percentage at which the monitor is<br />
considered to be in a warning state. This percentage must be<br />
higher than the target percentage. When the SLO goes below<br />
this percentage, a notification is sent.<br />
If you have any compound SLOs they are listed at the bottom of<br />
the dialog box.<br />
8. Enter the SLOs.<br />
9. Click Finish.<br />
Chapter 13: Configuring Service Level Agreements 839
Updating SLAs<br />
Updating SLAs<br />
To change an SLA:<br />
1. Click the Configure menu.<br />
2. Click Service Level Agreements to open the Configure Service<br />
Level Agreements page.<br />
840 <strong>OneSight</strong> <strong>Administrator</strong> <strong>Guide</strong>
Updating SLAs<br />
3. Select the SLA that you want to update and click Modify.<br />
Deleting SLAs<br />
4. Make changes and click OK.<br />
When you delete a Service Level Agreement all of its associated<br />
Service Level Objectives are also deleted. To delete a Service Level<br />
Agreement:<br />
1. Click the Configure menu.<br />
2. Click Service Level Agreements to open the Configure Service<br />
Level Agreements page.<br />
3. Select the SLA that you want to delete and click Remove.<br />
4. Click OK.<br />
Chapter 13: Configuring Service Level Agreements 841
Updating SLOs<br />
Updating SLOs<br />
To change an SLO:<br />
1. Click the Configure menu.<br />
2. Click Service Level Agreements to open the Configure Service<br />
Level Agreements page.<br />
3. Select the SLO that you want to update and click Modify.<br />
This dialog box has the following options.<br />
Name – the name of the SLO.<br />
842 <strong>OneSight</strong> <strong>Administrator</strong> <strong>Guide</strong>
Updating SLOs<br />
Service Level Indicator – indicates the type of indicator, average<br />
availability, availability, or metric performance.<br />
Service Level Agreement – indicates the name of the SLA.<br />
Time Interval – the time interval that is being monitored. These<br />
intervals are configured by selecting Time Intervals from the<br />
Configure menu.<br />
Threshold – the threshold of the SLO.<br />
Target – the target percentage.<br />
Set Warning – enables the warning level fields.<br />
Warning Level – enter the percentage at which the SLO is<br />
considered to be in a warning state.<br />
Warning Aggregate – select how to aggregate the results, daily,<br />
weekly, monthly, or user-configured date interval.<br />
Set Grace Period – check this box if you want to specify a grace<br />
period for this SLO.<br />
Grace Period – enter the length of time, in minutes, to wait<br />
before considering availability to be a problem. For example, if<br />
you enter fifteen minutes, the sample failure must occur for<br />
fifteen minutes before being considered a problem. The<br />
availability report will ignore the failure samples within this<br />
outage.<br />
Modify Composition – displays the SLO screen for selecting the<br />
monitors to include. This button is only displayed when the<br />
indicator type is compound availability.<br />
4. Make changes and click OK.<br />
Chapter 13: Configuring Service Level Agreements 843
Configuring Date Intervals<br />
Deleting SLOs<br />
To delete a Service Level Objective:<br />
1. Click the Configure menu.<br />
2. Click Service Level Agreements to open the Configure Service<br />
Level Agreements page.<br />
3. Select the SLA containing the SLO that you want to delete<br />
4. Select the SLO that you want to delete and click Remove.<br />
5. Click OK.<br />
Configuring Date Intervals<br />
You can configure a date interval that can be used for the warning<br />
aggregate period or for the SLA Status display. Date Intervals will<br />
be listed for selection in the following fields:<br />
Adding Date Intervals<br />
Aggregation field on the Create Service Level Objectives dialog<br />
box<br />
Warning Aggregate field in the Update Service Level Objectives<br />
dialog box<br />
Time Interval field on the SLA Status page<br />
To add a date interval:<br />
1. Click the Configure menu.<br />
844 <strong>OneSight</strong> <strong>Administrator</strong> <strong>Guide</strong>
Configuring Date Intervals<br />
2. Click Date Intervals under Service Level Agreements.<br />
Add – Displays the Date Interval Editor for adding a new date<br />
interval.<br />
Clone – Makes a copy of the selected Date Interval.<br />
Modify – – Displays the Date Interval Editor for modifying the<br />
selected date interval.<br />
Remove – Deletes the selected date interval.<br />
Used By – Displays a list of SLOs that are using this date<br />
interval.<br />
Name – Displays the name of the date interval.<br />
User Group – Displays the user group to which the date interval<br />
belongs.<br />
Chapter 13: Configuring Service Level Agreements 845
Configuring Date Intervals<br />
3. Click Add.<br />
Date Interval Name – Enter a name for the date interval.<br />
Server Time Zone – Displays the server’s time zone.<br />
User Time Zone – Displays the user’s time zone.<br />
General Tab<br />
Select the type of date interval:<br />
Days – Select the number of days in this time interval, up to six<br />
days.<br />
Weeks – Select the number of weeks in this time interval, up to<br />
four weeks.<br />
Months – Select the number of months in this time interval, up<br />
to twelve months.<br />
Access Control Tab<br />
The Access Control tab lets you specify which user groups can<br />
read, write, or delete this date interval.<br />
User Group – Displays the user group names.<br />
846 <strong>OneSight</strong> <strong>Administrator</strong> <strong>Guide</strong>
Configuring Date Intervals<br />
Owner – The user group for this date interval. A date interval<br />
can be directly owned by a user group.<br />
Global Read – Gives read access to this user group and all of its<br />
sub user groups.<br />
Read – Gives read permission to the user group.<br />
Write – Gives write permission to the user group.<br />
Delete – Gives delete permission to the user group.<br />
4. Enter a name for the date interval.<br />
5. Select the interval in days, weeks, or months.<br />
6. Click OK.<br />
Modifying Date Intervals<br />
To modify a date interval:<br />
1. Click the Configure menu.<br />
2. Click Date Intervals under Service Level Agreements.<br />
3. Select the Date Interval you want to modify and click Modify.<br />
4. Make any changes.<br />
5. Click OK.<br />
Deleting Date Intervals<br />
Date Intervals that are being used cannot be deleted. Click Used by<br />
to display a list of SLOs that are using the selected date interval. To<br />
delete a date interval:<br />
Chapter 13: Configuring Service Level Agreements 847
Configuring Date Intervals<br />
1. Click the Configure menu.<br />
2. Click Date Intervals under Service Level Agreements.<br />
3. Select the date interval you want to delete and click Remove.<br />
4. Click OK when asked to confirm the deletion.<br />
848 <strong>OneSight</strong> <strong>Administrator</strong> <strong>Guide</strong>
C h a p t e r 14<br />
Configuring Custom Reports<br />
Report templates allow you to easily extend <strong>OneSight</strong> reporting to<br />
include your own customized reports. The features include:<br />
Ease of use – It is very simple to add a report to <strong>OneSight</strong><br />
without knowledge of <strong>OneSight</strong> reporting or the Corda PopChart<br />
rendering engine.<br />
Flexible data acquisition – You can report on <strong>OneSight</strong> data or<br />
any available SQL database. In addition, report templates will<br />
accept properly formatted CSV, XML, or HTML files as input.<br />
Flexible rendering options – Any report can be displayed either as<br />
a chart (line, bar, pie, stacked bar, etc), or as an HTML table.<br />
Gauge “dials” are also supported.<br />
Extensibility – You can post-process SQL data prior to rendering,<br />
allowing more advanced data manipulation that might be difficult<br />
within the SQL query. This is done by implementing a simple<br />
java interface.<br />
PDF support – In addition to Flash output, any chart can be<br />
generated as a PDF.<br />
Creating Reports Using Report Templates<br />
To create a report using <strong>OneSight</strong> report templates you need to add<br />
your report to the report templates properties file. After editing, it is<br />
not necessary to restart <strong>OneSight</strong>; any changes to the properties file<br />
will be recognized.<br />
849
Running a Report Templates Report<br />
Running a Report Templates Report<br />
After you have setup a report by editing the <strong>OneSight</strong> Report<br />
Templates properties file, you can decide how you would like users<br />
to access and view the report. The options include:<br />
Invoke the report URL manually in the browser. <strong>OneSight</strong><br />
provides the reportTemplate.jsp file that loads a report by ID. You<br />
can invoke the report by manually entering the URL. For<br />
example, http://localhost:8080/reportTemplate.jsp?id=Report4 would<br />
load the report “Report4”.<br />
Include the report as a menu item on the main reports page. If you<br />
set the visible property to true in the Report Templates<br />
properties file, the report will show up as a link in the Report<br />
Templates Section under the Saved Reports section. The menu<br />
item name is based on the .title property. Note that these<br />
reports are global and will show up for all users.<br />
Include the report in a saved view. Any URL can be displayed on<br />
the reports page and therefore it can be included in a saved report<br />
layout. This gives you more control over the visibility of the<br />
report and allows you to integrate the report with other related<br />
reports.<br />
Include the report as a SmartLink (e.g.,<br />
reportTemplate.jsp?id=Report1)<br />
Custom. You could create a customized page that includes an<br />
invocation of the report within a frame of that page.<br />
850 <strong>OneSight</strong> <strong>Administrator</strong> <strong>Guide</strong>
Report Templates Properties File<br />
<strong>OneSight</strong> Report Templates Example Report<br />
Report Templates Properties File<br />
You define a report by editing the report templates properties file.<br />
The file is called reportTemplates_en.properties, and resides in the<br />
<strong>OneSight</strong> properties directory (<strong>OneSight</strong>\properties). This file<br />
contains a list of all custom reports. Each custom report entry<br />
includes the following parameters. Refer to the example file at the<br />
end of this chapter for a more comprehensive list:<br />
.title – This is the report title that is displayed in the report. It is<br />
also the menu item name if the .visible property is set to true.<br />
.visible – Indicates whether to include the report in the list of<br />
custom reports shown on the main reporting page.<br />
.datasourceName – The report‟s data source. Supported data<br />
sources include: sql, csv, html, xml.<br />
datasourceValue. – The parameters required for the data source.<br />
These are datasource specific.<br />
Chapter 14: Configuring Custom Reports 851
Report Templates Properties File<br />
.template – The appearance type, which corresponds to a<br />
PopChart appearance file. Default appearance files for common<br />
types (bar, line) are provided within <strong>OneSight</strong>, or you can use a<br />
custom appearance file. This requires assistance from the<br />
<strong>OneSight</strong> Services Team or a Corda builder license.<br />
.outputType – The output type. Valid output types include FLASH<br />
(the default), PDF, and TABLE (an HTML table).<br />
Editing the Report Templates Properties File<br />
The reportTemplates_en.properties file can be edited manually within<br />
the <strong>OneSight</strong> properties directory, or it can be edited within the<br />
<strong>OneSight</strong> console using the<br />
http://hostname:8080/support/ReportTemplateEdit.jsp file. When you<br />
invoke http://hostname:8080/support/ReportTemplateEdit.jsp, it loads in<br />
the properties file. After you make the necessary edits, click the<br />
Save button. Saved changes are effective immediately.<br />
About Custom Report Data Sources<br />
A report data source can be an SQL query, a CSV or XML file, or an<br />
HTML table within an html page. Corda makes it very easy to<br />
import data from csv, html, and xml files. The files must follow the<br />
prototypical table format. Examples are provided within the<br />
PopChart\chart_root\reportTemplates\data subdirectory. In this<br />
scenario, you need to update the file using an external means such<br />
as a scheduled <strong>OneSight</strong> action).<br />
For an SQL query, you also need to provide the connection<br />
parameters. The samples in the report templates include a report<br />
that connects to the <strong>OneSight</strong> database and reads alerts. Any<br />
accessible DB cab be used. In fact, the SQL datasource is database<br />
agnostic, so you need to be aware of security issues surrounding<br />
custom reports.<br />
852 <strong>OneSight</strong> <strong>Administrator</strong> <strong>Guide</strong>
Creating a Gauge Report<br />
Passing Arguments to a SQL Query<br />
If you are using an SQL query, you can pass any number of<br />
arguments to the query. This is a two-step process.<br />
1. When specifying the query in the <strong>OneSight</strong> report templates<br />
properties file, include a „?‟ character where the argument<br />
substitutions will occur. For example:<br />
Report5.sql=SELECT PropName, AgentPropertySeq FROM<br />
EmpirixAdmin.tbl_AgentProperty WHERE<br />
(AgentPropertyListID = ?)<br />
2. When invoking the report, specify the appropriate number of<br />
„arg‟ parameters in the URL that will map to the „?‟. For<br />
example:<br />
id=MyReport&arg=16&arg=18, would substitute 16 and<br />
18 for two ? within the query.<br />
Creating a Gauge Report<br />
<strong>OneSight</strong> report templates support gauge reports. Gauges are unique<br />
in that you specify a single value to graph, such as a tachometer as<br />
shown below.<br />
To specify a gauge report, you must first specify the<br />
.datasourceName as SQL. Only SQL results can be represented in a<br />
gauge (this is a Corda limitation). You then specify a<br />
Chapter 14: Configuring Custom Reports 853
Post-Processing of SQL results using Java<br />
.datasourceValue of “gauge”. Finally, you specify the ranges in<br />
the gauge, and their respective colors. For example:<br />
GaugeExample.datasourceName=sql<br />
GaugeExample.datasourceValue=gauge<br />
GaugeExample.gaugeRanges=Normal,00b200,0,750;Warn<br />
ing,b2b200,750,900;Critical,b20000,900,1000<br />
Post-Processing of SQL results using Java<br />
When the datasourceName property value is SQL, the <strong>OneSight</strong><br />
report templates renders the query results verbatim. The<br />
datasourceValue property can optionally specify a java class file<br />
to load to process the results data and subsequently return your<br />
modified data. This is useful when the SQL query would not<br />
otherwise be able to perform the data processing your report<br />
requires.<br />
The java class file is an interface implementation of the<br />
IReportTemplate interface. This interface is trivial, and it‟s<br />
complete definition follows:<br />
package com.wrq.wam.reports.reportTemplates;<br />
// report template classes must implement this<br />
interface<br />
public interface IReportTemplate<br />
{<br />
}<br />
public String processResults(String xmlStr);<br />
As you can see, you only need to implement a single method,<br />
processResults, which takes a string and returns a string. The data<br />
is a string containing an XML representation of the query result<br />
data. For example:<br />
854 <strong>OneSight</strong> <strong>Administrator</strong> <strong>Guide</strong>
Post-Processing of SQL results using Java<br />
package reportTemplateExamples;<br />
import<br />
com.wrq.wam.reports.reportTemplates.IReportTemplate;<br />
/* Add the following to reportTemplate_en.properties<br />
to provide.<br />
..datasourceValue=reportTemplateExamples<br />
.ReportTemplateExample<br />
*/<br />
public class ReportTemplateExample implements<br />
IReportTemplate<br />
{<br />
public ReportTemplateExample()<br />
{<br />
}<br />
}<br />
public String processResults(String xmlStr)<br />
{<br />
}<br />
return xmlStr.replace('L', 'Z');<br />
This implementation replaces any “L” characters with “Z‟<br />
characters. A more typical use case would be actual processing of<br />
the XML input, and mathematical manipulation of the results data.<br />
Alternately, your java program could defer to an XLST process.<br />
Chapter 14: Configuring Custom Reports 855
Implementation Notes/Caveats<br />
To build the class file, you need to temporarily copy the <strong>OneSight</strong><br />
jar to your build directory and invoke the javac compiler: For<br />
example:<br />
"c:\ jdk1.5.0_06\bin\javac.exe" -cp onesight.jar<br />
ReportTemplateExample.java<br />
Implementation Notes/Caveats<br />
Because this feature is not within the <strong>OneSight</strong> framework and is<br />
loosely coupled with the existing <strong>OneSight</strong> reporting, the<br />
following advanced features are not available:<br />
<strong>OneSight</strong> filtering. You can customize the jsp to provide<br />
your own filtering mechanism if you need to. In addition,<br />
filtering exists outside of <strong>OneSight</strong>, since <strong>OneSight</strong>‟s data<br />
structures (UserGroups, etc) are only available by directly<br />
querying the <strong>OneSight</strong> database.<br />
Reporting Drill-down.<br />
No time slider.<br />
The difficulties inherent in querying data from the <strong>OneSight</strong><br />
database, particularly time series data, has not been addressed.<br />
Since <strong>OneSight</strong> can provide CSV data for many of its reports, and<br />
since this feature allows for CSV as a data source, one way to<br />
report on prefiltered <strong>OneSight</strong> data is to use the <strong>OneSight</strong> CSV<br />
reports as input into a report templates report. An example of this<br />
is provided in the sample properties file that shows <strong>OneSight</strong><br />
alert distribution within a pie chart.<br />
The appearance files and sample data files are located in the<br />
<strong>OneSight</strong> popchart\chart_root\reportTemplates subdirectory.<br />
856 <strong>OneSight</strong> <strong>Administrator</strong> <strong>Guide</strong>
Report Templates Configuration File<br />
Report Templates Configuration File<br />
Edit the reportTemplates_en.properties file to add a report. It must<br />
exist in the properties directory. For example:<br />
# --------------------------------------<br />
#<br />
# This is the Report Templates Configuration file.<br />
# Individual Reports are added within this file.<br />
#<br />
# --------------------------------------<br />
# --------------------------------------<br />
#<br />
# Individual reports are appended the this comma<br />
# separated list of reports. This name here used as the<br />
# report ID when invoking the report using the<br />
# reportTemplate.jsp. # E.G.,<br />
# http://localhost:8080/reportTemplate.jsp?id=Report1<br />
# --------------------------------------<br />
reportList = Report1, Report2, Report3, Report4,<br />
Report5, GaugeExample, VoiceWatch, Oroboros<br />
# --------------------------------------<br />
# Each Report in above list shall be listed below with<br />
# its properties.<br />
# The following properties are supported:<br />
# .title - This is the title of the report that appears<br />
# within the report frame. This property is required.<br />
Chapter 14: Configuring Custom Reports 857
Report Templates Configuration File<br />
# .visible - The visible property determines whether the<br />
# report appears on the main reports page, available to<br />
# all <strong>OneSight</strong> users.<br />
# .template - This is the Corda PopChart appearance file<br />
# that determines the type of chart (E.G., bar, stacked<br />
# bar, line, pie, etc). This property is required. These<br />
# files are within the directory:<br />
# popchart\chart_root\reportTemplates\apfiles\en.<br />
# .datasourceName - The source of the data. Valid types<br />
# include: CSV, XML, HTML (a table within an HTML page),<br />
# SQL. This property is required. A Gauge (see<br />
# datasourceValue, below) only supports SQL.<br />
# .datasourceValue - For the file type data sources<br />
# (CSV, XML, HTML), this is the location of the file.<br />
# This property is required for file type data sources.<br />
# For a gauge "chart", set this to 'gauge'.<br />
# If you wish to post process the data, this is the<br />
# filespec to your java class.<br />
# .gaugeRanges - The ranges when datasourceValue is<br />
# 'gauge'. List as<br />
# title,color,min,max;title,color,min,max; etc.<br />
# .disabledColumns - For the file type data sources,<br />
# these are the columns to leave out of the report,<br />
# delimited by commas. The format 1-4 is also supported<br />
# when a range can be specified.<br />
# .htmlTable - For the HTML data source, the value of<br />
# this property is the name of the table, as specified<br />
# by the attribute in the html file<br />
# specified by the .dataSourceValue.<br />
# .width - Optional height of chart. Note that this<br />
# property can also be provided as a runtime argument to<br />
# reportTemplate.jsp.<br />
# .height - Optional height of chart. Note that this<br />
# property can also be provided as a runtime argument to<br />
# reportTemplate.jsp.<br />
# .outputType - Determines the format of the output.<br />
# Valid types include FLASH (the default), PDF, TABLE. A<br />
# value of TABLE will output an HTML table, rather than<br />
# a chart. Note that this property can also be provided<br />
858 <strong>OneSight</strong> <strong>Administrator</strong> <strong>Guide</strong>
Report Templates Configuration File<br />
# as a runtime argument to reportTemplate.jsp. E.G.,<br />
#<br />
http://localhost:8080/reportTemplate.jsp?id=Report4&outp<br />
utType=TABLE<br />
# Also note the following JDBC connection parameters for<br />
# the SQL dataSourceValue, which are all required for a<br />
# SQL data source.<br />
# .jdbcDriver - The JDBC driver. E.G.,<br />
# "com.inet.tds.TdsDriver"<br />
# .jdbcConnectionUrl - The JDBC connection string.<br />
# E.G., jdbc:inetdae:frs0671:1433?database=Trunk<br />
# .user - The user name.<br />
# .password - The password.<br />
# .sql - The SQL query. Must be on a single line. Note<br />
# the query can have the ? mark character. This allows<br />
# the parameter substitution in the URL.<br />
# E.G.,<br />
#<br />
http://localhost:8080/reportTemplate.jsp?id=Report4&arg=<br />
57&arg=foo<br />
# --------------------------------------<br />
# Sample report using bar graph and CSV file as data<br />
# source<br />
Report1.title = My CSV Report<br />
Report1.visible=true<br />
Report1.template = stackedbarcolumn.pcxml<br />
Report1.datasourceName=csv<br />
Report1.datasourceValue=reportTemplates/data/medals.csv<br />
# Sample report using stacked bar graph and XML file as<br />
# data source<br />
Report2.title = My XML Report<br />
Report2.visible=false<br />
Report2.template = stackedbar.pcxml<br />
Report2.datasourceName=xml<br />
Report2.datasourceValue=reportTemplates/data/bball.xml<br />
Report2.width = 1024<br />
Report2.height = 768<br />
Chapter 14: Configuring Custom Reports 859
Report Templates Configuration File<br />
# Sample report using line graph and table in HTML file<br />
# as data source<br />
Report3.title = My HTML Report<br />
Report3.visible=false<br />
Report3.template = line.pcxml<br />
Report3.datasourceName=html<br />
Report3.datasourceValue=reportTemplates/data/data1.html<br />
Report3.htmlTable=CordaData<br />
# Sample report using pie graph and SQL query as data<br />
# source<br />
Report4.title = <strong>OneSight</strong> Alert Distribution<br />
Report4.visible=false<br />
Report4.template = pie.pcxml<br />
Report4.datasourceName=sql<br />
#<br />
Report4.datasourceValue=com.wrq.wam.reports.reportTempla<br />
teExamples.ReportTemplateExample<br />
Report4.datasourceValue=reportTemplateExamples.ReportTem<br />
plateExample<br />
Report4.jdbcDriver=com.inet.tds.TdsDriver<br />
Report4.jdbcConnectionUrl=jdbc:inetdae:frs0671:1433?data<br />
base=<strong>OneSight</strong>Trunk<br />
Report4.user=sa<br />
Report4.password=<br />
Report4.sql=select<br />
EmpirixAdmin.tbl_AlertDetail.AlertName,<br />
COUNT(EmpirixAdmin.tbl_AlertDetail.AlertName) AS<br />
Alert_Count FROM EmpirixAdmin.tbl_AlertDetail GROUP BY<br />
EmpirixAdmin.tbl_AlertDetail.AlertName<br />
# Sample report using pie graph and SQL query as data<br />
# source with example of using Arguments.<br />
Report5.title = My SQL with Arg<br />
Report5.visible=false<br />
Report5.template = pie.pcxml<br />
860 <strong>OneSight</strong> <strong>Administrator</strong> <strong>Guide</strong>
Report Templates Configuration File<br />
Report5.datasourceName=sql<br />
Report5.jdbcDriver=com.inet.tds.TdsDriver<br />
Report5.jdbcConnectionUrl=jdbc:inetdae:frs0671:1433?data<br />
base=Trunk<br />
Report5.user=sa<br />
Report5.password=<br />
Report5.sql=SELECT PropName, AgentPropertySeq FROM<br />
EmpirixAdmin.tbl_AgentProperty WHERE<br />
(AgentPropertyListID = ?)<br />
# Sample Gauge<br />
GaugeExample.title = Some Load Measurement<br />
GaugeExample.visible=false<br />
GaugeExample.template=dialgauge.pcxml<br />
GaugeExample.datasourceName=sql<br />
GaugeExample.datasourceValue=gauge<br />
GaugeExample.gaugeRanges=Normal,00b200,0,750;Warning,b2b<br />
200,750,900;Critical,b20000,900,1000<br />
GaugeExample.jdbcDriver=com.inet.tds.TdsDriver<br />
GaugeExample.jdbcConnectionUrl=jdbc:inetdae:frs0671:1433<br />
?database=<strong>OneSight</strong>Trunk<br />
GaugeExample.user=sa<br />
GaugeExample.password=<br />
GaugeExample.sql=select<br />
COUNT(EmpirixAdmin.tbl_AppliedMonitor.MonitorID) FROM<br />
EmpirixAdmin.tbl_AppliedMonitor<br />
VoiceWatch.title = VoiceWatch Report<br />
VoiceWatch.visible=false<br />
VoiceWatch.template = stackedbarcolumn.pcxml<br />
VoiceWatch.datasourceName=csv<br />
VoiceWatch.datasourceValue=reportTemplates/data/andrew.c<br />
sv<br />
VoiceWatch.disabledColumns=1-4,6-8,23<br />
Oroboros.title=My Alert Distribution<br />
Oroboros.visible=false<br />
Oroboros.template=stackedbar.pcxml<br />
Oroboros.datasourceName=csv<br />
Oroboros.datasourceValue=http://localhost:8080/support/R<br />
eportsCSV.jsp?csv=1&report=1039&1=01d&uid=admin
Report Templates Configuration File<br />
n
C h a p t e r 15<br />
Configuring Time Intervals<br />
Time intervals belong to user groups and are used:<br />
when creating SLOs to indicate the time period for which the<br />
objective applies<br />
in action plans to determine the actions to take when an alert<br />
occurs during the time interval<br />
Creating New Time Intervals<br />
To create a time interval:<br />
1. Click the Configure menu.<br />
863
Creating New Time Intervals<br />
2. Click Time Intervals to open the Configure Time Intervals page.<br />
This dialog box has the following options:<br />
Time Intervals – lists the existing time intervals.<br />
Add – displays the New Time Interval dialog box for adding a<br />
new time interval.<br />
Clone – makes a copy of the selected time interval that can then<br />
be edited.<br />
Modify – displays the Update Time Interval dialog box for<br />
changing the selected time interval.<br />
Remove – deletes the selected time interval.<br />
Used By – displays a list of actions plans and SLOs that are<br />
using the selected time interval.<br />
864 <strong>OneSight</strong> <strong>Administrator</strong> <strong>Guide</strong>
Creating New Time Intervals<br />
3. Click Add.<br />
This dialog box has the following options:<br />
General Tab Settings<br />
Time Interval Name – enter the name of the time interval.<br />
Server Time Zone – displays the <strong>OneSight</strong> server’s time zone.<br />
User Time Zone – displays the user’s time zone.<br />
Block select – lets you select a group of blocks by indicating<br />
the first and last block on a row or column. When not<br />
selected, you must select each block individually. Selected<br />
blocks have a green circle in them.<br />
Clear all – resets the dialog box so that no times are selected.<br />
Access Control Settings<br />
User Group – Displays the user group names.<br />
Owner – The user group for this time interval. A time interval<br />
can be directly owned by a user group.<br />
Global Read – Gives read access to this user group and all of<br />
its sub user groups.<br />
Chapter 15: Configuring Time Intervals 865
Changing Time Intervals<br />
Read – Gives read permission to the user group.<br />
Write – Gives write permission to the user group.<br />
Delete – Gives delete permission to the user group.<br />
4. Enter the name of the new time interval.<br />
5. Select the times that you want included in the time interval.<br />
6. Click Save.<br />
Changing Time Intervals<br />
To change a time interval:<br />
1. Click the Configure menu.<br />
2. Click Time Intervals to open the Configure Time Intervals page.<br />
866 <strong>OneSight</strong> <strong>Administrator</strong> <strong>Guide</strong>
Deleting Time Intervals<br />
3. Click Modify.<br />
4. Make any changes and click Save.<br />
Deleting Time Intervals<br />
You can delete all time intervals except the last one. To delete a<br />
time interval:<br />
1. Click the Configure menu.<br />
2. Click Time Intervals to open the Configure Time Intervals page.<br />
3. Select the time interval that you want to delete and click<br />
Remove.<br />
4. Click OK.<br />
Chapter 15: Configuring Time Intervals 867
Deleting Time Intervals<br />
[This page intentionally left blank.]<br />
868 <strong>OneSight</strong> <strong>Administrator</strong> <strong>Guide</strong>
C h a p t e r 16<br />
Configuring VQ Probes<br />
Voice Quality (VQ) Probes calculate the voice quality score of calls<br />
using the following systems:<br />
The VQ Probe System<br />
<strong>OneSight</strong> System<br />
<strong>OneSight</strong> is used to configure and schedule CallMaster voice<br />
quality scripts. The calling side, known as the A side, plays a<br />
prompt and the receiving side, known as the B side, listens to the<br />
prompt and calculates its VQ score. The B side then plays the same<br />
prompt and the A side listens to it and calculates its VQ score. The<br />
bi-directional scores are sent back to <strong>OneSight</strong> where they can be<br />
monitored and viewed.<br />
Voice Quality Basic monitors can make calls directly from the VQ<br />
Probe Core to a remote VQ Probe, through the customer PBX<br />
directly to the remote VQ Probe, and remote VQ Probes can call one<br />
another.<br />
Voice Quality Advanced monitors combine Voice Quality scores<br />
with script metrics. In addition the Voice Quality Advanced<br />
monitor can make calls through the customer PBX through an IVR<br />
to the remote VQ Probe.<br />
869
Editing VQ Probes<br />
The following diagram shows the possible calling configurations.<br />
Note that calls through an IVR can only be made using the Voice<br />
Quality Advanced monitor.<br />
The general tasks for setting up a VQ Probe are as follows:<br />
Install the VQ Probe as described in “Chapter 2” of the VQ<br />
Probe User’s <strong>Guide</strong>.<br />
Configure the VQ Probe in <strong>OneSight</strong> as described in this chapter.<br />
Set up the <strong>OneSight</strong> monitor as described in “Chapter 5” of this<br />
manual.<br />
VQ Probe Self Monitors<br />
When <strong>OneSight</strong> starts up, it automatically checks to see if there are<br />
any connected VQ Probes. If there are, <strong>OneSight</strong> creates selfmonitors<br />
for them and places them in the VQ Probe Self Monitoring<br />
870 <strong>OneSight</strong> <strong>Administrator</strong> <strong>Guide</strong>
Editing VQ Probes<br />
monitor group. These monitors collect the following metrics on the<br />
VQ Probe:<br />
CPU<br />
Memory<br />
Disk space<br />
HTServer<br />
Sigserver<br />
DataManager<br />
This monitor group is displayed on the Status page if any VQ Probe<br />
goes into a warning or critical state. To always display this monitor<br />
group, Select Logging and Debugging Controls from the Support<br />
page and check the Show VQ Probe Self Monitor Group check box.<br />
Editing VQ Probes<br />
When you install a VQ Probe, you enter the <strong>OneSight</strong> Server to<br />
which the probe will connect. The VQ Probe configuration page<br />
lists all of the VQ Probes that have connected to this <strong>OneSight</strong><br />
Server. You can configure and schedule the VQ Probe from this<br />
page.<br />
Configuring a VQ Probe<br />
VQ Probes can be configured on Hammer systems or non-Hammer<br />
systems. The configuration screens are not the same. This section<br />
describes how to configure a VQ Probe on a non-Hammer system.<br />
Refer to “Configuring a VQ Probe on a G5 or FX/TDM System,”<br />
later in this chapter for information on configuring VQ Probes on a<br />
Hammer system.<br />
Chapter 16: Configuring VQ Probes 871
Editing VQ Probes<br />
Note: The VQ Probe should use static IPs per channel. If the IP<br />
address should change, reopen the configuration for the probe and<br />
save it.<br />
To configure a VQ Probe:<br />
1. Click the Configure menu.<br />
2. Click VQ Probes.<br />
This dialog box shows a list of connected VQ Probes. <strong>OneSight</strong><br />
automatically adds VQ Probes to the list and remembers them<br />
even if they disconnect.<br />
Modify – Displays the VQ Probe Editor for modifying the<br />
configuration package associated with this probe.<br />
Remove – Removes the selected VQ Probe from the list. Probes<br />
can only be removed if they are not connected to <strong>OneSight</strong> and<br />
if they are not being used by any monitors, including disabled<br />
monitors. If the probe is still connected to <strong>OneSight</strong>, <strong>OneSight</strong><br />
will add the probe back to the list.<br />
872 <strong>OneSight</strong> <strong>Administrator</strong> <strong>Guide</strong>
Editing VQ Probes<br />
Used By – Displays the data collector by which the probe is<br />
connected and the monitor groups and monitors that are using<br />
the selected probe.<br />
Edit Alternate Dial Numbers – Displays the VQ Configuration<br />
For Dial Numbers dialog box for managing dial numbers.<br />
Name – Displays the name of the VQ Probe.<br />
Version – Displays the VQ Probe version.<br />
State – Displays whether or not the probe is connected.<br />
3. Select the VQ Probe that you want to modify and click Modify.<br />
This dialog box lets you create and configure channel groups. A<br />
channel group is a group of channels that has the same settings<br />
and whose phone extensions will be incremented by one<br />
starting with the first configured extension.<br />
Chapter 16: Configuring VQ Probes 873
Editing VQ Probes<br />
Note: The channels configured here are for use with the<br />
<strong>OneSight</strong> Voice Quality Basic and Advanced monitors. These<br />
channels cannot be used for anything else.<br />
The following options are available when VQ Probe Settings is<br />
selected in the tree.<br />
Channel Groups<br />
Add Group – Adds a new channel group to the list.<br />
Remove Group – Removes the selected channel group.<br />
Number of channels – Enter the number of channels in the<br />
selected group.<br />
Update – Updates the number of channels in the selected<br />
channel group.<br />
4. Select the length of the prompt to use.<br />
5. Add additional channel groups, if necessary.<br />
874 <strong>OneSight</strong> <strong>Administrator</strong> <strong>Guide</strong>
Editing VQ Probes<br />
6. In the tree, select the channel group that you want to configure.<br />
General<br />
Protocol – Select the protocol to use. The type of protocol<br />
determines which fields are displayed in the Configuration<br />
section of this dialog box.<br />
Note: UNIStim is only supported for probe to probe calling. It<br />
is not supported for Hammer to probe calling.<br />
IP Address – Enter the local IP address that the VQ Probe will<br />
use to originate calls, and listen on for incoming messages<br />
and connections.<br />
Select the starting IP address for each channel group. Each<br />
channel in the group will use the next incremental IP address.<br />
A unique IP address must be associated with each station<br />
extension. You must manually add your IP addresses to the<br />
Chapter 16: Configuring VQ Probes 875
Editing VQ Probes<br />
VQ Probe using the network interface properties page on the<br />
probe itself. To do this, you must use static IP addresses, not<br />
DHCP. If you use DHCP, you will not be able to add multiple<br />
IP addresses to the interface. To add IP addresses:<br />
1. Select Settings from the Start menu, then select Network<br />
Connections.<br />
2. Double-click on the network interface you are<br />
configuring.<br />
3. Click the Properties button on the General tab.<br />
4. Double click Internet Protocol (TCP/IP).<br />
5. Select Use the following IP address.<br />
6. Enter the IP address, subnet mask, default gateway,<br />
preferred DNS server, and the alternate DNS server.<br />
7. Click Advanced.<br />
8. Click Add.<br />
9. Enter the other IP addresses you wish to add using the<br />
same subnet mask entered previously.<br />
10. Click OK when done.<br />
11. Click OK.<br />
Extension – Enter the first channel’s extension. Subsequent<br />
extensions will be incremented by one.<br />
Media<br />
Codec – Select the codec that the media will be transmitted<br />
in.<br />
876 <strong>OneSight</strong> <strong>Administrator</strong> <strong>Guide</strong>
Editing VQ Probes<br />
Note: The Codec used directly effects the maximum MOS<br />
score that can be returned. This, in turn, effects how you<br />
configure thresholds for alerting on your monitors. Refer to<br />
the Codec comparison chart at the end of this section for a list<br />
of Codecs and their expected maximum MOS scores.<br />
Interpacket Delay (ms) – Select the interpacket delay. The<br />
values in the dropdown are based on the type of codec being<br />
used. The higher the interpacket delay, the larger the RTP<br />
packets.<br />
DTMF Type – Select the type of DTMF digits that the channel<br />
sends. The following options are available:<br />
In Band (Audio) – DTMF digits are sent via standard RTP<br />
encoding.<br />
Out of Band (RFC2833) – DTMF digits are sent in the RTP<br />
stream as defined in RFC 2833. If you select this option,<br />
and the receiving endpoint does not support Out of Band<br />
DTMF, the call fails.<br />
Note: If the receiving endpoint does not recognize the Out<br />
of Band DTMF sent by hammer, set DTMF to In Band.<br />
Both – The channel sends both standard RTP-encoded<br />
audio and RFC 2833. When sending both Out of Band<br />
and In Band, only Out of Band digits (2833) are verified.<br />
If the receiving endpoint does not support Out of Band<br />
DTMF, the call can still connect normally; however, any DTMF<br />
transmission sends both In Band and Out of Band even<br />
though the receiving endpoint has not declared that it can<br />
receive Out of Band DTMF.<br />
Signaling – DTMF digits are sent in signaling messages.<br />
Chapter 16: Configuring VQ Probes 877
Editing VQ Probes<br />
SIP Configuration<br />
PBX – Enter either the IP Address or the name of the Call<br />
Manager with which the extension registers.<br />
Register with PBX – Enter whether or not it is necessary to<br />
register with the PBX.<br />
Username – Enter the user name that all probes will use to<br />
authenticate to the PBX. This field is displayed when Register<br />
with PBX is set to Yes.<br />
Password – Enter the password that all probes will use to<br />
authenticate to the PBX. This field is displayed when Register<br />
with PBX is set to Yes.<br />
Skinny<br />
Skinny Type – Select the Skinny type.<br />
Station MAC Address – Enter the MAC address of the phone<br />
configured on the Call Manager.<br />
PBX – Enter either the IP Address or the name of the Call<br />
Manager with which the extension registers.<br />
Register with PBX –Enter whether or not it is necessary to<br />
register with the PBX.<br />
Local Terminal Type – Select the local terminal type.<br />
H.323<br />
H.323 Type – Select the type of H323 that you want to use.<br />
PBX – Enter either the IP Address or the name of the Call<br />
Manager with which the extension registers.<br />
878 <strong>OneSight</strong> <strong>Administrator</strong> <strong>Guide</strong>
Editing VQ Probes<br />
Register with PBX – This field is displayed when the H.323<br />
Type is H323 H245 Phone. Enter whether or not it is<br />
necessary to register with the PBX.<br />
Gatekeeper IP – This field is displayed when the H.323 Type<br />
is H323 FS RAS Phone or H323 H245 RAS Phone. Enter the<br />
IP address of the gatekeeper.<br />
Register with Gatekeeper – This field is displayed when the<br />
H.323 Type is H323 FS RAS Phone or H323 H245 RAS<br />
Phone. Enter whether or not it is necessary to register with<br />
the Gatekeeper.<br />
Avaya H.323<br />
Avaya_H.323 Type – Select the Avaya H.323 type. Note that<br />
Avaya 96xx – 46xx Station and Avaya H323 Trunk are the<br />
only types supported.<br />
PBX – Enter either the IP Address or the name of the Call<br />
Manager with which the extension registers.<br />
Register with PBX – This field is displayed when the Avaya<br />
H.323 type is Avaya 96xx-46xx Station. Enter whether or not<br />
it is necessary to register with the PBX.<br />
Security Code – This field is required if Register with PBX is<br />
set to Yes. Enter the four digit security code for these stations<br />
on the Avaya.<br />
UNIStim Configuration<br />
Mac Address – Enter the Mac address.<br />
PBX – Enter either the IP Address or the name of the Call<br />
Manager with which the extension registers.<br />
Chapter 16: Configuring VQ Probes 879
Editing VQ Probes<br />
Username – Enter the user name that all probes will use to<br />
authenticate to the PBX. Leave this field blank if<br />
authentication is not required.<br />
Password – Enter the password that all probes will use to<br />
authenticate to the PBX. Leave this field blank if<br />
authentication is not required.<br />
Unique network ID – Enter the four digit network ID of the<br />
endpoint. This field is used to respond to the server when the<br />
server queries the endpoint’s location information.<br />
Manufacturer ID – Enter the two digit unique manufacturer ID<br />
of the endpoint.<br />
Firmware Version – Enter the firmware version code of the<br />
endpoint.<br />
7. Enter the configuration information for this probe and click<br />
Save.<br />
Configuring a VQ Probe on a G5 or FX/TDM System<br />
VQ Probes can be configured on Hammer systems or non-Hammer<br />
systems. The configuration screens are not the same. This section<br />
describes how to configure a VQ Probe on a Hammer system. Refer<br />
to “Configuring a VQ Probe,” earlier in this chapter for<br />
information on configuring VQ Probes on a non-Hammer system.<br />
To configure a VQ Probe on a G5 or FX/TDM System:<br />
1. Click the Configure menu.<br />
880 <strong>OneSight</strong> <strong>Administrator</strong> <strong>Guide</strong>
Editing VQ Probes<br />
2. Click VQ Probes.<br />
This dialog box shows a list of connected VQ Probes. <strong>OneSight</strong><br />
automatically adds VQ Probes to the list and remembers them<br />
even if they disconnect.<br />
Modify – Displays the VQ Probe Editor for modifying the<br />
configuration package associated with this probe.<br />
Remove – Removes the selected VQ Probe from the list;<br />
however, if the probe is still connected, <strong>OneSight</strong> will add the<br />
probe back to the list within minutes. Use remove to clear out<br />
Probes that are no longer expected to connect.<br />
Used By – Displays the data collector by which the probe is<br />
connected and the monitor groups and monitors that are using<br />
the selected probe.<br />
Edit Dial Numbers – Displays the VQ Configuration For Dial<br />
Numbers dialog box for managing dial numbers.<br />
Name – Displays the name of the VQ Probe.<br />
Version – Displays the VQ Probe version.<br />
State – Displays whether or not the probe is connected.<br />
Chapter 16: Configuring VQ Probes 881
Editing VQ Probes<br />
3. Select the VQ Probe that you want to modify and click Modify.<br />
This dialog box lets you configure the channels to use for VQ<br />
monitoring and the extensions associated with them. When you<br />
click the Add new mapping button, fields are displayed to enter<br />
groups of consecutive channels and extensions that can be used<br />
for VQ monitoring. You can enter the first channel number, the<br />
first extension number, and the number of consecutive<br />
channels. The configured extensions will be displayed in the<br />
Dial Number field on the Configure <strong>OneSight</strong> Voice Quality<br />
Monitor page.<br />
Note: The configured channels should be dedicated for use only<br />
for Voice Quality – Basic monitors in <strong>OneSight</strong> and should not<br />
be used for any other functions. In addition, these channels<br />
cannot be used as A sides with the Voice Quality – Advanced<br />
monitors.<br />
Add new mapping – Displays the next group of fields for<br />
configuring consecutive channels and their extensions.<br />
Start Channel – Enter the first channel to use for VQ<br />
monitoring.<br />
Start Extension – Enter the first extension to use.<br />
Length – Enter the number of consecutive channels.<br />
882 <strong>OneSight</strong> <strong>Administrator</strong> <strong>Guide</strong>
Editing VQ Probes<br />
Note: If you need to use a non-numeric extension, create a<br />
channel group with a length of one. Any value can then be<br />
entered in the Start Extension field.<br />
Delete mapping – Deletes the associated mapping group.<br />
4. Click Add new mapping to display the next group of fields for<br />
configuring consecutive channels and their extensions.<br />
Note: The configured channels should be dedicated for use only<br />
for VQ monitoring from <strong>OneSight</strong> and should not be used for<br />
any other functions.<br />
5. Enter the first channel.<br />
6. Enter the first extension. The configured extensions will be<br />
displayed in the Dial Number field on the Configure <strong>OneSight</strong><br />
Voice Quality Monitor page.<br />
7. Enter the number of consecutive channels.<br />
8. Repeat steps 4-7 for additional channel groups.<br />
9. Click OK when you are finished.<br />
Changing or Adding IP Addresses<br />
If your VQ Probe is using only one IP address and one channel, and<br />
you need to change the IP address, you must stop the VQ Probe<br />
Data Collector and change the IP address. In addition, before<br />
restarting the Data Collector, update the Comm.ConnectFrom field<br />
with the IP address to use to connect to Empirix <strong>OneSight</strong> and<br />
update the PackageAgentName in the OSDC.properties file. If you<br />
do not, the VQ Probe may fail to connect to Empirix <strong>OneSight</strong>.<br />
If your VQ Probe is using one IP address and one channel group<br />
with unique IP addresses for each channel, and you want to increase<br />
the number of channels, you must update the OSDC.properties file<br />
Chapter 16: Configuring VQ Probes 883
Deleting VQ Probes<br />
in addition to restarting the Data Collector. Before restarting the<br />
Data Collector, update the Comm.ConnectFrom field with the IP<br />
address to use to connect to Empirix <strong>OneSight</strong> and update the<br />
PackageAgentName.<br />
Codec Comparison Chart<br />
The following chart shows some commonly used Codecs and their<br />
maximum expected MOS scores from best to worst.<br />
Codec Data rate (kb/s) MOS<br />
G.711 64 4.5<br />
G.723 6.3 3.9<br />
G.726 24 3.8<br />
G.729a 8 3.7<br />
G.723 5.3 3.65<br />
Deleting VQ Probes<br />
You can remove a VQ Probe from the VQ Probes dialog box. Probes<br />
can only be removed if they are not connected to <strong>OneSight</strong> and if<br />
they are not being used by any monitors, including disabled<br />
monitors. If the probe is still connected, <strong>OneSight</strong> will add the<br />
probe back to the list. To delete a VQ Probe:<br />
1. Click the Configure menu.<br />
2. Click VQ Probes.<br />
3. Select the VQ Probe that you want to delete and click Remove.<br />
884 <strong>OneSight</strong> <strong>Administrator</strong> <strong>Guide</strong>
Editing Dial Numbers<br />
Editing Dial Numbers<br />
You can add and modify the list of dial numbers. The dial numbers<br />
will be displayed in the dial numbers list on the General Tab when<br />
you create a <strong>OneSight</strong> Voice Quality monitor. To edit a dial<br />
number:<br />
1. Click the Configure tab.<br />
2. Select VQ Probes.<br />
3. Click Edit Alternate Dial Number.<br />
Add – Displays the Add Dial Number dialog box for adding a<br />
dial number.<br />
Modify – Displays the Edit Dial Number dialog box for adding a<br />
dial number.<br />
Remove – Deletes the selected dial number.<br />
Alias – Displays the Dial Number’s alias.<br />
Dial Number – Displays the number to dial.<br />
Chapter 16: Configuring VQ Probes 885
Editing Dial Numbers<br />
4. Click Add to add a new dial number or click Modify to edit the<br />
selected dial number.<br />
Alias – Enter the dial number’s alias.<br />
Dial Number – Enter the number to dial.<br />
5. Enter the dial number’s alias.<br />
6. Enter the number to dial.<br />
7. Click OK.<br />
886 <strong>OneSight</strong> <strong>Administrator</strong> <strong>Guide</strong>
C h a p t e r 17<br />
Configuring XMS Systems<br />
You can configure XMS systems so that you can view Call Data<br />
Records (CDRs) using the Hammer E-XMS diagnostics, voice<br />
reports, and analysis tool directly from <strong>OneSight</strong>.<br />
When you have one or more XMS systems configured, <strong>OneSight</strong><br />
displays the Diagnostics tab, which allows you to connect to an<br />
XMS system, as described later in this Chapter.<br />
Adding XMS Systems<br />
To add an XMS System:<br />
1. Click XMS Systems on the Configure tab.<br />
887
Adding XMS Systems<br />
This dialog box has the following options:<br />
Add – Displays the Add Systems dialog box for adding a new<br />
XMS system.<br />
Modify – Displays the System Editor for modifying the selected<br />
XMS system.<br />
Remove – Removes the selected XMS system.<br />
Check Box – Lets you select systems.<br />
In Use – Shows whether the system is in use.<br />
System – Displays the system name or IP address.<br />
Device Type – Displays the type of device.<br />
Operating System – Displays the operating system type.<br />
User Group – Displays the user group to which this system<br />
belongs.<br />
2. Click Add.<br />
System name – Enter the system name or IP address.<br />
Username – Enter the user name for accessing the system.<br />
Password – Enter the password.<br />
Device Type – Select the device type.<br />
3. Enter the system name or IP address.<br />
888 <strong>OneSight</strong> <strong>Administrator</strong> <strong>Guide</strong>
Adding XMS Systems<br />
4. Enter the system name or IP address.<br />
5. Enter the user name and password for the XMS system.<br />
6. Select the device type.<br />
7. Click OK.<br />
System Tab – The fields are automatically filled in based on the<br />
information entered in the previous dialog box, however, you<br />
can make changes here.<br />
Device Type – Displays the device type.<br />
DNS Name – Displays the DNS name.<br />
IP address – Displays the IP address<br />
NetBIOS name – Displays the NetBIOS name.<br />
Chapter 17: Configuring XMS Systems 889
Adding XMS Systems<br />
XMS Username – Displays the user name.<br />
XMS Password – Hides the password.<br />
Attributes Tab Settings – Attributes are used in <strong>OneSight</strong> to sort<br />
the monitors, monitor groups, profiles, and systems on the<br />
status page. You can assign custom attribute values to specific<br />
monitors and use the Group by selection on the status page to<br />
show only those monitors, monitor groups, profiles, or systems<br />
assigned to a specific attribute set.<br />
All Attributes – Shows the name of the attribute set and its<br />
attribute values.<br />
Selected Attributes – Shows the list of attribute values applied<br />
to this system. Use the Add and Remove arrow buttons to<br />
customize the list of attribute values applied to the monitor,<br />
monitor group, profile, or system.<br />
Attribute Editor – Opens the Attribute Editor for adding and<br />
deleting attributes and attribute values.<br />
Access Control Tab – The Access Control tab lets you specify<br />
which user groups can read, write, or delete this system.<br />
User Group – Displays the user group names.<br />
Owner – The user group for this system. A system can be<br />
directly owned by a user group.<br />
Global Read – Gives read access to this user group and all of<br />
its sub user groups.<br />
Read – Gives read permission to the user group.<br />
Write – Gives write permission to the user group.<br />
Delete – Gives delete permission to the user group.<br />
890 <strong>OneSight</strong> <strong>Administrator</strong> <strong>Guide</strong>
Modifying XMS Systems<br />
8. <strong>OneSight</strong> fills in the System tab based on the entries in the<br />
previous dialog box. From here, you can assign attributes to the<br />
system and configure who can access this system. make any<br />
changes and click OK.<br />
9. Click Close to exit the XMS Systems dialog box. The<br />
Diagnostics Tab will be displayed where you can access an<br />
XMS System.<br />
Modifying XMS Systems<br />
To modify an XMS system:<br />
1. Click XMS Systems on the Configure tab.<br />
2. Select the XMS system that you want to modify and click the<br />
Modify button.<br />
Chapter 17: Configuring XMS Systems 891
Deleting XMS Systems<br />
3. Make any changes and click OK.<br />
4. Click Close to exit the XMS Systems dialog box.<br />
Deleting XMS Systems<br />
To delete an XMS system:<br />
1. Click XMS Systems on the Configure tab<br />
2. Select the XMS system that you want to delete and click<br />
Remove.<br />
3. Click OK to confirm the deletion.<br />
4. Click Close to exit the XMS Systems dialog box.<br />
892 <strong>OneSight</strong> <strong>Administrator</strong> <strong>Guide</strong>
Viewing Call Data Records<br />
Viewing Call Data Records<br />
You can access a configured XMS system from the Diagnostics tab.<br />
This tab is only displayed when there are one or more configured<br />
XMS systems.<br />
This page displays a table that contains one line for each XMS<br />
system that is configured. It has the following columns:<br />
XMS Server Name – Displays the server name or IP address.<br />
XMS Server IP – Displays the IP address.<br />
Link to XMS System – Shows a link for connecting to the XMS<br />
system.<br />
Chapter 17: Configuring XMS Systems 893
Viewing Call Data Records<br />
Click in the Link to XMS System field for the XMS system that you<br />
want to access. The E-XMS Diagnostics, Voice Reports, and<br />
Analysis tool is displayed.<br />
Refer to the E-XMS documentation for information on using this<br />
tool.<br />
Note: If you are using Internet Explorer 8.0, you may have a<br />
problem connected to the XMS system from this link. You must add<br />
the XMS server to the local intranet sites in your browser. To do<br />
this, click Internet Options from the Tools menu in IE. Click the<br />
Security tab, then click the Sites button. Click Advanced. Enter the<br />
<strong>OneSight</strong> server URL and click Add.<br />
894 <strong>OneSight</strong> <strong>Administrator</strong> <strong>Guide</strong>
C h a p t e r 18<br />
<strong>OneSight</strong> Utilities<br />
Trace Route<br />
<strong>OneSight</strong> provides the following utilities on the Configure page:<br />
Trace Route – lets you run a trace route from the specified<br />
location to a specified host to validate connectivity to the host<br />
device.<br />
Regex Tester – lets you test a regular expression that you want to<br />
use in <strong>OneSight</strong>.<br />
MIB Browser – lets you view objects in a MIB file, and create<br />
metrics and profiles.<br />
In addition, the <strong>OneSight</strong> Support and Diagnostic Page, available<br />
when you click Support in the Main Menu, lets you access the<br />
support utilities that are currently available on the <strong>OneSight</strong> support<br />
page.<br />
The Trace Route utility lets you run a trace route from the specified<br />
location to a specified host to validate connectivity to the host<br />
device. To trace a route:<br />
1. Click the Configure menu.<br />
895
Regular Expressions<br />
2. Click Trace Route.<br />
3. Enter the host name or IP address.<br />
4. Click Run. The results are displayed in the <strong>OneSight</strong> Trace Route<br />
field.<br />
Regular Expressions<br />
The Regex utility lets you test a regular expression that you intend<br />
to use in <strong>OneSight</strong>. Refer to Using Regular Expressions for Pattern<br />
Matching in Chapter 5 for more information about regular<br />
expressions.<br />
To test a regular expression:<br />
1. Click the Configure menu.<br />
896 <strong>OneSight</strong> <strong>Administrator</strong> <strong>Guide</strong>
Regular Expressions<br />
2. Click Regex Tester.<br />
This dialog box has the following options:<br />
Content – Enter or paste in the text that you want to test the<br />
regular expression against.<br />
Perl Regular Expression – Enter the regular expression that you<br />
want to test.<br />
Search for – Select whether to search for a string match or a<br />
numeric value.<br />
Test Results – Displays the results of the test.<br />
3. Enter or paste in the text that you want to test the regular<br />
expression against.<br />
4. Enter the regular expression that you want to test.<br />
5. Select whether to test for a string or numeric value.<br />
Chapter 18: <strong>OneSight</strong> Utilities 897
MIB Browser<br />
MIB Browser<br />
6. Click Test. The results are displayed in the Test Results field.<br />
The MIB Browser lets you view objects in a MIB file. You can then<br />
copy an OID and paste it into <strong>OneSight</strong> when you are configuring<br />
monitors. You can also select objects and create metrics and<br />
profiles using the Metric Creation Wizard.<br />
To view a MIB file:<br />
1. Click the Configure menu.<br />
2. Click MIB Browser.<br />
This dialog box has the following options:<br />
Load MIB – Enter the MIB file that you want to browse or select<br />
Browse to find a file.<br />
898 <strong>OneSight</strong> <strong>Administrator</strong> <strong>Guide</strong>
MIB Browser<br />
MIB Configuration<br />
Host – Specify the name or IP address of the host.<br />
Community – Specify the SNMP password of the system. The<br />
default SNMP community string is public.<br />
Port – Specify the port number used on this system by the<br />
SNMP agent. Typically, this is port 161.<br />
SNMP Version – Specify the SNMP version used on this<br />
system.<br />
Location – Select the location to use for sampling.<br />
Object ID<br />
Object ID – Displays the object ID for the selected object.<br />
Clicking GO displays the object’s value in the Object Value<br />
field.<br />
Launch Metric Wizard – Starts the Metric Creation Wizard for<br />
creating metrics.<br />
Object Value – Displays the object’s value on the configured<br />
host device when you click GO.<br />
Syntax – Displays the syntax of the selected object as found in<br />
the MIB file.<br />
Access – Displays the type of access of the selected object as<br />
found in the MIB file.<br />
Description – Displays a description of the selected object as<br />
found in the MIB file.<br />
Chapter 18: <strong>OneSight</strong> Utilities 899
MIB Browser<br />
3. Select the MIB file you want to view and click GO or select<br />
Browse to find a file that is not in the list.<br />
4. Expand the tree and select the object you are interested in. Its<br />
OID is displayed in the Object ID field.<br />
5. Enter the MIB Configuration information for the host on which<br />
you want to check the object’s value.<br />
6. Click GO in the OID section to get the object’s value as shown<br />
in the following example.<br />
900 <strong>OneSight</strong> <strong>Administrator</strong> <strong>Guide</strong>
MIB Browser<br />
Creating Metrics<br />
You can add a metrics from the MIB browser.<br />
1. Click Launch Metric Wizard.<br />
Node Name – Select the node that you want to add.<br />
OID Column – Select Object ID column.<br />
Sample Every (sec) – Specify how often you want this metric to<br />
query the monitored web component for data. In general, the<br />
higher the number, the more efficiently the database operates.<br />
Translation Type – Translation Type settings control how<br />
<strong>OneSight</strong> translates a metric’s data when displayed on the<br />
<strong>OneSight</strong> Alerts page and in Reports. If you are modifying a<br />
metric that is provided as part of a profile, use the existing<br />
Translation Type setting:<br />
No Translation – <strong>OneSight</strong> presents the metric’s data as it is<br />
provided by the metric’s data source.<br />
Rate (minutes) – <strong>OneSight</strong> presents the metric’s data as a<br />
delta, per minute. If the time interval between two samples<br />
Chapter 18: <strong>OneSight</strong> Utilities 901
MIB Browser<br />
was 10 minutes, and 50 errors were found, the Rate (minutes)<br />
would be five (5) errors per minute.<br />
Note: Rate (minutes) translates data sources that return their<br />
values as an endlessly increasing counter. If the data source<br />
does not return data this way, use No Translation. For example,<br />
some network metrics from the UNIX System data source are<br />
returned as the number of errors since the machine was<br />
rebooted. To get the error rate per minute, use Rate (minutes).<br />
Search String –Enter the string or regular expression that<br />
<strong>OneSight</strong> will search for in the Table Get OID column that you<br />
specify.<br />
Sample For Each – Sample for Each settings correspond with the<br />
items under Components in the System Editor. Use the Sample<br />
for Each settings to make the metric sample each component of<br />
that type that it finds on the monitored web component. Take,<br />
for example, a metric that measures Queue Length that has Disk<br />
as its Sample for Each setting (Disk: Queue Length). When Disk:<br />
Queue Length is applied as part of a profile to an NT machine<br />
that has four logical disks, four instances of the Disk: Queue<br />
Length metric will be created, one metric instance for each<br />
logical disk.<br />
The Sample for Each setting called System does not replicate<br />
metrics. Use System to measure “one of a kind” items on a<br />
machine.<br />
Add Metric – Adds the selected metric to the list at the bottom of<br />
the screen.<br />
Metric name prefix – Enter a prefix to place in front of the<br />
metric name.<br />
Profile name – Enter a name for the profile that you want to<br />
create using these metrics. This profile can be viewed when you<br />
select Profiles on the Configure tab.<br />
Remove – Removes the selected metrics.<br />
902 <strong>OneSight</strong> <strong>Administrator</strong> <strong>Guide</strong>
Support and Diagnostics<br />
Create Metrics – Creates the selected metrics.<br />
2. Select the node for which you want to create a metric.<br />
3. Select how often to sample the metric, the translation type,<br />
search string, and the sample for each settings.<br />
4. Enter a prefix if desired.<br />
5. Enter a profile name if you want to create a profile for the<br />
selected metrics.<br />
6. Click Add Metric.<br />
7. Repeat for as many metrics as you want to add.<br />
8. Click Create Metrics. A message is displayed when the metrics<br />
have been created.<br />
9. Click OK. The metrics can be viewed by selecting Metrics on the<br />
Configure tab. If you entered a profile name, the profile can be<br />
accessed by clicking Profiles on the Configure tab.<br />
Support and Diagnostics<br />
The support and diagnostics page is available when you click<br />
Support on the Main Menu. It provides utilities that let you view the<br />
overall status of <strong>OneSight</strong>. Some utilities also affect how <strong>OneSight</strong><br />
functions.<br />
The support and diagnostics page should only be used with the<br />
assistance of <strong>OneSight</strong> technical support.<br />
This option is only available to those users that can view all user<br />
groups and that have configuration rights.<br />
Chapter 18: <strong>OneSight</strong> Utilities 903
Support and Diagnostics<br />
[This page intentionally left blank.]<br />
904 <strong>OneSight</strong> <strong>Administrator</strong> <strong>Guide</strong>
C h a p t e r 19<br />
Troubleshooting<br />
Viewing Administration Notifications<br />
The <strong>OneSight</strong> Administration Notifications feature lets you view a<br />
description of internal errors that have occurred. The<br />
Administration Notifications icon appears in the top right-hand<br />
corner of the Status, SLA Status, and Alerts tabs only if internal<br />
errors have occurred. Click on the icon to display the <strong>OneSight</strong><br />
Administration Notifications dialog box.<br />
This dialog box has the following options:<br />
Date – Displays the date the error occurred.<br />
Description – Displays a description of the error.<br />
Resolution URL – Click on this link to either correct the problem or<br />
view more information about the problem. For example, for critical<br />
logs, the support log file dialog box would be displayed.<br />
Remove – Removes the error from the list.<br />
905
Troubleshooting Setup<br />
Remove All – Removes all errors from the list.<br />
Troubleshooting Setup<br />
Use the following sections for tips on how to solve problems that<br />
may occur during <strong>OneSight</strong> Setup:<br />
Determining which Service Pack you have<br />
Out of Disk Space<br />
Out of Disk Space<br />
Moving the <strong>OneSight</strong> database to a remote SQL server after setup<br />
If you see database installation or connection errors<br />
If you try to install <strong>OneSight</strong> on a Windows 2000 server using<br />
Windows Terminal Services<br />
If your system drive (in most cases, C:\) is low on disk space and<br />
even if you are installing <strong>OneSight</strong> on a drive other than your<br />
system drive, you may get the following error message during<br />
<strong>OneSight</strong> Setup:<br />
Out of disk space. The highlighted volumes do not have<br />
enough disk space available for the selected features.<br />
This message appears because <strong>OneSight</strong> Setup must copy these files<br />
to your system drive:<br />
Setup also copies Microsoft InstallShield files (120 MB) to your<br />
system drive’s Program Files\Common Files\Wise Installation<br />
Wizard and Winnt\Installer folders.<br />
There is no workaround to avoid having the above two file types<br />
copied to your system drive. You will have to make room for those<br />
files (approximately 260 MB).<br />
906 <strong>OneSight</strong> <strong>Administrator</strong> <strong>Guide</strong>
Troubleshooting Setup<br />
Setup also copies additional MSI files (60 MB) to your system<br />
drive’s TEMP or TMP folders. To reduce the amount of disk space<br />
required on your C:\ drive, do the following:<br />
1. On the <strong>OneSight</strong> Server, click Start, then point to Settings, then<br />
click Control Panel.<br />
2. Double-click System.<br />
3. Click the Advanced tab and then click the Environment<br />
Variables button.<br />
4. Under User Variables for , highlight TEMP. Click Edit.<br />
5. In the Value box, type a drive other than your system drive,<br />
followed by TEMP, for example, D:\TEMP. Click OK to save<br />
these changes.<br />
6. Do the same for TMP: Under User Variables for ,<br />
highlight TMP, then in the Value box, type a drive other than<br />
your system drive, followed by TMP.<br />
7. Click Set to apply your changes, then click OK to close the<br />
System Properties dialog box.<br />
You can also minimize impact on the C:\ drive by adding space for<br />
a Paging File on additional drives. In Control Panel, open System.<br />
On the Performance tab, click the Change button for Virtual<br />
Memory. If you have additional fixed disk drives, you can allocate<br />
more space for virtual memory paging on these drives and decrease<br />
the space allocated on the system (C:\) drive. The machine must be<br />
restarted to have these changes take effect.<br />
Moving the <strong>OneSight</strong> Database to a Remote SQL Server<br />
When you first run Setup, you can choose to use a remote SQL<br />
server. However, if you installed MSDE or Microsoft SQL Server on<br />
Chapter 19: Troubleshooting 907
Troubleshooting Setup<br />
the <strong>OneSight</strong> Server and then decide to move the <strong>OneSight</strong> database<br />
to a remote SQL server, use the steps below.<br />
To move the database, you will be using Enterprise Manager and<br />
Query Analyzer, which are Microsoft SQL Server Client Utilities.<br />
Note: This procedure assumes that the name of the <strong>OneSight</strong><br />
administrative user is “<strong>OneSight</strong>Admin” in the database section of<br />
the OSServer.properties file. The Onesight administrator’s name is<br />
identified with the property Database.UserName in the<br />
OSServer.properties file. If you changed this name, you must edit the<br />
script file <strong>OneSight</strong>Empirix\db\sp_CreateUsers.sql and replace all<br />
occurrences of <strong>OneSight</strong>Admin with the name of the <strong>OneSight</strong><br />
administrative user as it appears in the OSServer.properties file. You<br />
must then execute this script file in a Query Analyzer window to<br />
modify the stored procedure before executing the procedure in step<br />
5 below.<br />
1. Confirm that the remote SQL Server database you intend to use<br />
has the same character set and sort order. The <strong>OneSight</strong><br />
database is configured as US English, dictionary sort-order,<br />
case-insensitive.<br />
2. Stop the Onesight service.<br />
3. Use Enterprise Manager to back up the <strong>OneSight</strong> database (by<br />
default, named <strong>OneSight</strong>). Move the database backup device<br />
file, (<strong>OneSight</strong>_backup.bak, typically located in the mssql7\backup<br />
folder) to the remote SQL server. If you do not see a backup file<br />
with this name, use Enterprise Manager to check the path for<br />
the <strong>OneSight</strong>_backup device.<br />
4. Restore the database on the new server from the backup file.<br />
Note: Make sure you restore the same version of backup that<br />
you created on the other server. SQL Server supports multiple<br />
backups in the same device file.<br />
908 <strong>OneSight</strong> <strong>Administrator</strong> <strong>Guide</strong>
Troubleshooting Setup<br />
5. Use Query Analyzer to execute the stored procedure that<br />
creates the users and logins for the remote SQL server.<br />
Assuming the default name of <strong>OneSight</strong>, select the <strong>OneSight</strong><br />
database and execute the following command<br />
exec SP_createusers '<strong>OneSight</strong>'<br />
6. Use Enterprise Manager to change the password of the<br />
<strong>OneSight</strong>Admin login on the remote SQL server to agree with<br />
the password in the OSServer.properties file on the <strong>OneSight</strong><br />
server. (This is necessary only if you have changed the<br />
<strong>OneSight</strong> default password, null, to something else.)<br />
7. Change the SQL Alias machine specification. Open Enterprise<br />
Manager, then run the Client Network Utility.<br />
Version 2.0<br />
The Server alias is the machine name, and the same machine<br />
name is also specified in the Connection Parameters column.<br />
Change both of these machine name designations to the<br />
machine name of the new HWM database machine and edit the<br />
TCP port number if applicable.<br />
Version 2.1 and above<br />
The Server alias named HWMDatabase has the machine name in<br />
the Connection Parameters column. Change this machine name<br />
to the machine name for the new HWM database machine and<br />
edit the TCP port number if applicable.<br />
Note: By default, the server alias name is HWMDatabase. The<br />
alias name is based on the specification in the<br />
Database.ServerAlias value in the \properties\OSServer.properties<br />
file for SQL. The Server alias string does not need to be<br />
changed when moving the database.<br />
8. Use Query Analyzer to confirm that you can connect to the<br />
<strong>OneSight</strong> database on the new server using the <strong>OneSight</strong><br />
administrative user and password as specified in the<br />
OSServer.properties file on the <strong>OneSight</strong> Server.<br />
Chapter 19: Troubleshooting 909
Oracle Test for Web Applications Error Messages<br />
9. Using Notepad, edit the OSServer.properties file on the <strong>OneSight</strong><br />
Server. Change the ServerName, ServerPort, Detail.DataDirectory,<br />
and Detail.BackupDirectory properties to reflect the location of the<br />
remote SQL server.<br />
10. Restart the <strong>OneSight</strong> service.<br />
Database Installation or Connection Errors<br />
Refer to Technical Note 10056, “Troubleshooting Database<br />
Installation and Connection Error Messages,” available on the<br />
<strong>OneSight</strong> support web site, www.empirix.com/support.<br />
Installing <strong>OneSight</strong> Using Windows Terminal Services<br />
If you use Windows Terminal Services to install <strong>OneSight</strong> on a<br />
Windows 2000 server, you will see the message "Unable to connect<br />
to database server" after installation is complete. You must uninstall<br />
<strong>OneSight</strong> and then reinstall from the server without using Windows<br />
Terminal Services.<br />
Oracle Test for Web Applications Error<br />
Messages<br />
The following are descriptions for the various error messages that<br />
may be generated by Oracle Test for Web Applications<br />
Transactions. These messages can appear in the following places in<br />
<strong>OneSight</strong>:<br />
in the popup text string that appears when you move the mouse<br />
cursor over an Oracle Test for Web Applications Transaction<br />
monitor Health indicator on the Status page;<br />
in the Status Detail pages of Oracle Test for Web Applications<br />
Transaction monitors;<br />
910 <strong>OneSight</strong> <strong>Administrator</strong> <strong>Guide</strong>
Oracle Test for Web Applications Error Messages<br />
in the results window that appears when you use the TEST button<br />
when configuring Oracle Test for Web Applications Transaction<br />
monitors.<br />
There are four types of Oracle Test for Web Applications<br />
Transaction error messages:<br />
Transaction errors detected or generated by Oracle Test for Web<br />
Applications Visual Scripts;<br />
Errors detected by <strong>OneSight</strong> while running or attempting to run<br />
an Oracle Test for Web Applications Transaction monitor;<br />
RSWISERV Error returned by the Thin agent;<br />
HTTP Status Codes and the Win32 Internet API Constants.<br />
Transaction Errors Detected or Generated by Oracle<br />
Test for Web Applications Visual Scripts<br />
<strong>OneSight</strong> classifies Oracle Test for Web Applications failures into<br />
the following error types:<br />
Custom Test Failure<br />
Failure<br />
Fatal Dialog<br />
Navigation Failure<br />
Page Timeout<br />
Scriptlet Failure<br />
RealPlayer Test Failure<br />
Server Response Test Failure<br />
Text Matching Test Failure<br />
VBA Failure<br />
Chapter 19: Troubleshooting 911
Oracle Test for Web Applications Error Messages<br />
Windows Media Player Test Failure<br />
These messages appear in the following formats:<br />
: <br />
-or-<br />
: (Record : )<br />
-or-<br />
: <br />
-or-<br />
: (Record : )<br />
Where:<br />
type – is one of the above error types.<br />
name – is the name of a test in the Oracle Test for Web<br />
Applications Visual Script (i.e. Text Matching test name, Server<br />
Response test name, etc.).<br />
description – is a description of the error (i.e. Failed to find<br />
navigation path, etc.)<br />
Record : – is an OATS DataBank record number and<br />
data values.<br />
The following is an example of a Visual Script page error message:<br />
Navigation Failure: Failed to find navigation path<br />
window(0).link(text='Customize My Page' | 48),<br />
href=http://products/asp_pages/Popular%20Configurations.asp<br />
Important. (2/6/03 2:40 PM)<br />
This message indicates that Visual Script failed to find a recorded<br />
Visual Script navigation element in the page. The element is an<br />
HTML link () with the display text of "Customize My<br />
Page". The HTML link element is the 49th link element on the Web<br />
page in source order (zero-based index value). The URL the Visual<br />
Script navigation is attempting to find is:<br />
http://products/asp_pages/Popular%20Configurations.asp<br />
912 <strong>OneSight</strong> <strong>Administrator</strong> <strong>Guide</strong>
Oracle Test for Web Applications Error Messages<br />
Errors Detected While Running Oracle Test for Web<br />
Applications Transaction Monitor<br />
The following error messages can be generated by <strong>OneSight</strong> while<br />
running Oracle Test for Web Applications Transaction monitors:<br />
OATS must be upgraded to or greater (currently installed:<br />
)<br />
The version of OATS installed on the Data Collector is older than<br />
the version supported by <strong>OneSight</strong>.<br />
Installed OATS version is lower than the version used<br />
to record the script<br />
The Visual Script cannot be played back because the version of<br />
OATS installed on the Data Collector is older than the OATS<br />
version used to record the Visual Script. Upgrade the version of<br />
OATS installed on the Data Collector to the same version used to<br />
record the Visual Script.<br />
The Oracle Test for Web Applications monitor is not available on the<br />
specified location(s) or collection host.<br />
This message may occur when you are creating a new Oracle Test<br />
for Web Applications monitor after you have upgraded to <strong>OneSight</strong><br />
version 5.0. The Data Collectors running Oracle Test for Web<br />
Applications transactions must be upgraded as well. Data Collectors<br />
that are not running Oracle Test for Web Applications transactions<br />
do not have to be upgraded.<br />
No data source found.<br />
This message may occur if no Data Collector is available. Some of<br />
the possible reasons are:<br />
a disconnected Data Collector<br />
a configuration error<br />
Chapter 19: Troubleshooting 913
Oracle Test for Web Applications Error Messages<br />
an old Data Collector. Transaction monitors require Data<br />
Collectors to be version 5.0 or later.<br />
OATS not installed (<strong>OneSight</strong> requires OATS version or<br />
greater)<br />
OATS was not installed on the Data Collector. Install OATS on the<br />
Data Collector.<br />
Agent communication lost<br />
Communication between <strong>OneSight</strong> and the Oracle Test for Web<br />
Applications agent terminated unexpectedly. This usually means the<br />
Oracle Test for Web Applications agent terminated due to<br />
overloaded conditions on the Data Collector. Try reducing the<br />
demand on the system resources on the Data Collector machine (i.e.<br />
run fewer transactions on the Data Collector machine). You can<br />
also try upgrading hardware or use a higher performance system as<br />
the Data Collector machine.<br />
Agent exception<br />
Indicates a problem detected during Visual Script playback. Contact<br />
Empirix Customer Support.<br />
Failed to deploy script <br />
The script could not be copied to the <strong>OneSight</strong>DBCache! directory<br />
on the Data Collector. This could be due to file protection<br />
problems. If a shared directory is used (not recommended), then this<br />
could indicate network connection problems between the Data<br />
Collector and the shared directory.<br />
Cannot connect to OATS<br />
The OATS Agent Starter Service (empstart) is not running. Try<br />
starting this service using the Windows Services control panel<br />
applet.<br />
914 <strong>OneSight</strong> <strong>Administrator</strong> <strong>Guide</strong>
Oracle Test for Web Applications Error Messages<br />
Failed to start OATS agent: <br />
Indicates a bug detected while attempting to start an OATS agent<br />
process. Contact Oracle Customer Support.<br />
OATS agent did not finish within available time (see help for possible<br />
causes)<br />
The timeout expired before playback completed. The timeout is<br />
specified in the transaction monitor configuration.<br />
This message can occur:<br />
1. during initial setup of a transaction monitor, in which case it is<br />
preceded by a "Discovery failed due to the following:"<br />
message.<br />
2. during scheduled playback, in which case the message appears<br />
on the status screen.<br />
Possible causes for this error are:<br />
Cause: The script was running normally but took longer than the<br />
allotted time.<br />
Resolution: Shorten the Visual Script or increase the timeout<br />
value in the Transaction monitor configuration.<br />
Cause: The web server was down, causing the script to take<br />
longer than normal, and longer than the time limit.<br />
Resolution: Shorten the OATS page timeout for the Visual Script<br />
or increase the timeout value in the Transaction monitor<br />
configuration.<br />
Cause: The script does not run to completion in Minimal Client<br />
(Thin).<br />
Resolution: Try using Full Browser (Thick) or alter the Visual<br />
Chapter 19: Troubleshooting 915
Oracle Test for Web Applications Error Messages<br />
Script to run successfully in Minimal Browser (verify dynamic<br />
HTML used for page navigation does not cause the agent to stop<br />
responding).<br />
OATS fatal error: <br />
Indicates a problem detected in the OATS agent. Contact Oracle<br />
Customer Support.<br />
Error closing handle on OATS agent process (, pid<br />
): <br />
Error waiting for OATS agent process termination (, pid<br />
): <br />
Error terminating OATS agent process (, pid ): <br />
Indicates a problem encountered while attempting to terminate an<br />
OATS agent process.<br />
OATS skipped page playback<br />
Playback completed, but OATS did not report on pages marked<br />
with this message. This could be the result of a navigation failure<br />
on a previous page or of VBA code that caused pages to be skipped.<br />
OATS agent stopped responding <br />
The OATS agent is no longer responding to the <strong>OneSight</strong> heartbeat<br />
monitor. Check and verify that any custom programming code in<br />
Visual Script Test Scriptlets or Custom VBA code is not causing<br />
looping conditions. If looping conditions are not the cause, Contact<br />
Empirix Customer Support.<br />
RSWISERV Error codes returned by the Thin agent<br />
The following table lists the RSWISERV error constants:<br />
100 RSW_NO_RESULTS_TO_REPORT<br />
916 <strong>OneSight</strong> <strong>Administrator</strong> <strong>Guide</strong>
Oracle Test for Web Applications Error Messages<br />
101 RSW_CONNECT_BUCKET_TIMEOUT<br />
200 RSW_DLL_UNINIT_COMPLETED<br />
1000 RSW_ERROR_INVALID_PARAMETERS<br />
2000 RSW_INET_LAYER_NOT_INITD<br />
2001 RSW_OPEN_REQUEST_FAILED<br />
2002 RSW_ADD_REQUEST_HEADERS_FAILED<br />
2003 RSW_SEND_REQUEST_FAILED<br />
2004 RSW_QUERY_INFO_FAILED<br />
2005 RSW_FAILED_TO_CLOSE_HANDLE<br />
2006 RSW_ERROR_NO_SESSION_HANDLE<br />
2007 RSW_INTERNET_SET_OPTION_FAILED<br />
2008 RSW_INTERNET_QUERY_OPTION_FAILED<br />
2010 RSW_INTERNET_LOGIN_FAILURE<br />
2011 RSW_AUTH_LOGIN_PARMS_NOTAVAILABLE<br />
2012 RSW_CANNOT_CREATE_AUTH_OBJECT<br />
2013 RSW_READ_REQUEST_FAILED<br />
2014 RSW_INTERNET_REQUEST_TIMEOUT<br />
3000 RSW_UNABLE_TO_CREATE_EVENT<br />
3001 RSW_UNABLE_TO_CREATE_THREAD<br />
3002 RSW_UNABLE_TO_CREATE_NEW_REQUEST<br />
Chapter 19: Troubleshooting 917
Thick Client Problems Using an Oracle Test for Web Applications Transaction Monitor<br />
3003 RSW_UNABLE_TO_CREATE_NEW_THEAD_ENTRY<br />
3004 RSW_UNABLE_TO_CREATE_MUTEX<br />
3005 RSW_UNABLE_TO_CREATE_NEW_OBJECT<br />
3006 RSW_UNABLE_TO_ALLOCATE_NEW_MEMORY<br />
HTTP Status Codes and the Win32 Internet API<br />
Constants<br />
For additional information about HTTP Status Codes and the<br />
Win32 Internet API Constants, see the following Web resources:<br />
Section 10 of the Hypertext Transfer Protocol – HTTP/1.1<br />
Request for Comments: 2616<br />
Microsoft MSDN Win32 Internet API Constants<br />
MSDN Knowledge Base article Q193625<br />
Thick Client Problems Using an Oracle Test for<br />
Web Applications Transaction Monitor<br />
If the html page in the Oracle Test for Web Applications<br />
Transaction monitor script is larger than 1M, thick client may not<br />
work properly. To correct this issue:<br />
1. Stop the Data Collector service.<br />
2. Open the dc_services.properties file in a text editor.<br />
3. Uncomment the line: JHP.commandline=<br />
-DentityExpansionLimit=64000<br />
4. Increase the value of DentityExpansionLimit. For example:<br />
JHP.commandline= -DentityExpansionLimit=200000<br />
918 <strong>OneSight</strong> <strong>Administrator</strong> <strong>Guide</strong>
Critical State Error Messages<br />
5. Start the Data Collector service.<br />
In the rare case when this fails to correct the issue, choose the Thin<br />
client option.<br />
Critical State Error Messages<br />
Network Path Not Found (Windows only)<br />
This error message may occur when <strong>OneSight</strong> is trying to monitor a<br />
system that is off-line. Check the Host:Ping metric for this system.<br />
If <strong>OneSight</strong> shows a critical state for this metric, the system is<br />
probably off-line.<br />
Failed to Establish Connection (Sun or UNIX only)<br />
This error message may occur when <strong>OneSight</strong> is trying to monitor a<br />
system that is off-line. Check the Host:Ping metric for this system.<br />
If <strong>OneSight</strong> shows a critical state for this metric, the system is<br />
probably off-line. If the Host:Ping metric is showing a good state,<br />
make sure that you can authenticate to the system. <strong>OneSight</strong> uses<br />
either a telnet or SSH session to connect to the system. Make sure<br />
that you can connect using the session type and user name and<br />
password that <strong>OneSight</strong> is trying to use.<br />
Access is denied (Windows only)<br />
This error message occurs when the password that <strong>OneSight</strong> is<br />
trying to use to connect to this machine has changed. To change the<br />
password:<br />
1. On the Main <strong>OneSight</strong> menu, click Configure.<br />
2. Click Systems.<br />
3. Select the system displaying the error message and click Modify.<br />
4. Select the Windows NT tab.<br />
Chapter 19: Troubleshooting 919
Critical State Error Messages<br />
5. Enter the new password.<br />
6. Go back to the Status page and click the monitor group of the<br />
system.<br />
7. Click the Enabled checkbox to disable the monitor.<br />
8. Click the Disabled checkbox to enable the monitor and wait for<br />
the metrics to resample.<br />
Remote procedure call failed (Windows only)<br />
This error message may occur when <strong>OneSight</strong> had trouble reauthenticating<br />
its connection with the system after the system was<br />
rebooted. While viewing the monitor on the status page, click the<br />
Enabled button to disable the monitor. The monitor will move to the<br />
bottom of the list in the monitor group. Click the Enabled button to<br />
enable the monitor, forcing <strong>OneSight</strong> to re-authenticate with the<br />
system.<br />
Failed to load Perfmon name table (Windows only)<br />
This error message may occur when <strong>OneSight</strong> had trouble reauthenticating<br />
its connection with the system after the system was<br />
rebooted. While viewing the monitor on the status page, click the<br />
Enabled button to disable the monitor. The monitor will move to the<br />
bottom of the list in the monitor group. Click the Enabled button to<br />
enable the monitor, forcing <strong>OneSight</strong> to re-authenticate with the<br />
system.<br />
Missing counter value (Windows only)<br />
This message occurs when the indicated Windows perfmon metric<br />
does not exist on this system. In most cases, this is a system process<br />
that has stopped running. To resolve this problem:<br />
1. Log onto the system that is displaying the error message.<br />
2. From the Start menu, click Run and enter perfmon.<br />
920 <strong>OneSight</strong> <strong>Administrator</strong> <strong>Guide</strong>
Critical State Error Messages<br />
3. Click the Add button in the icon bar.<br />
4. Select the object indicated in the <strong>OneSight</strong> error message from<br />
the Performance object dropdown. The object is the first thing<br />
listed after “Missing counter value system name |”.<br />
5. Select the counter that corresponds to the last name listed in the<br />
<strong>OneSight</strong> error message from the list of counters.<br />
6. Look for the instance in perfmon that corresponds to the one<br />
listed in the <strong>OneSight</strong> error message. It may not e listed because<br />
it does not exist on the system.<br />
7. If the object is a process, restart the process to list it in Perfmon<br />
again.<br />
Chapter 19: Troubleshooting 921
Critical State Error Messages<br />
[This page intentionally left blank.]<br />
922 <strong>OneSight</strong> <strong>Administrator</strong> <strong>Guide</strong>
C h a p t e r 20<br />
Glossary<br />
Action – A specific response that you want <strong>OneSight</strong> to make. For<br />
example, sending an e-mail or an SNMP trap notification are<br />
possible actions. Actions are added to action plans. When an alert<br />
triggers an action plan, the actions in the plan are performed<br />
sequentially.<br />
Action plan – Specifies a sequence of actions that you want<br />
<strong>OneSight</strong> to perform if a monitor detects a problem. An action plan<br />
is invoked by an alert. The alert triggers the action plan to respond<br />
to problem conditions.<br />
<strong>Administrator</strong> – The category of <strong>OneSight</strong> users that can access all<br />
features of the Empirix <strong>OneSight</strong>. In particular, <strong>Administrator</strong>s are<br />
allowed to see and use the Configure pages. See also Operator.<br />
Agent – In <strong>OneSight</strong>, refers to the <strong>OneSight</strong> Remote Agent,<br />
available for Windows and Solaris machines.<br />
Alert – One or more alerts are configured for each monitor. An alert<br />
does three things:<br />
Defines a problem condition, such as an exceeded threshold or a<br />
sample failure, that the monitor should detect.<br />
Specifies what <strong>OneSight</strong> should do if the problem occurs. When<br />
the monitor detects this problem condition, the alert can either<br />
trigger an action plan, change a monitor’s health status, or do<br />
both.<br />
923
Glossary<br />
Ranks the seriousness of the problem. (Critical, Warning, or<br />
Informational)<br />
Alphanumeric – Consisting of English language letters, digits, or<br />
both, and occasionally containing control characters or other special<br />
characters.<br />
ASCII – American Standard Code for Information Interchange. Files<br />
including ASCII contain standard keyboard characters but no<br />
formatting information.<br />
Community strings – Strings that function as “passwords” embedded<br />
in every SNMP packet and authenticate access to the SNMP<br />
Management Information Base (MIB).<br />
Cookie – Bits of information about a user that web servers store on<br />
the client computer for later use. For example, web servers can use<br />
cookies to store the user’s web site configuration, to remember<br />
items placed in a “shopping cart” at an online shopping site, or to<br />
store account and password information for subscription sites.<br />
Critical state – A <strong>OneSight</strong> indicator of the state of a metric,<br />
monitor, or monitor group. <strong>OneSight</strong> reports use the term “Error” to<br />
identify a Critical state. Typically, web components that are in a<br />
Critical state require your immediate attention. In <strong>OneSight</strong>, Critical<br />
status is represented by a red diamond icon. When you configure<br />
monitor group monitors, you define the performance criteria that<br />
you want to track, associating the configuration with conditions,<br />
such as an exceeded threshold or a sample failure, that you want to<br />
be alerted about. In response to an alert, <strong>OneSight</strong> can either trigger<br />
an action plan, change a monitor’s health, or in some cases, do both.<br />
Data collector – The process that collects data from the machines<br />
you want to monitor and returns the data to the <strong>OneSight</strong> Server. It<br />
can be installed on the <strong>OneSight</strong> server or on another machine.<br />
Data source – Acts as the “information gatherer” for a profile metric<br />
or dedicated monitor. Each metric can have one or more data<br />
924 <strong>OneSight</strong> <strong>Administrator</strong> <strong>Guide</strong>
Glossary<br />
sources. In other products, data sources are sometimes referred to as<br />
agents.<br />
Dedicated monitor – A monitor with a single purpose: to test the<br />
availability or functionality of a specific web component, such as an<br />
FTP, DNS, or mail server, a subnet or set of machines on a subnet, a<br />
file, a host, or a web site or page. <strong>OneSight</strong> then reports the health<br />
of that component or reports any problems. Dedicated monitors are<br />
applied to individual web components. They allow you to measure<br />
and manage how users experience your site. When adding a<br />
dedicated monitor, you always define unique performance criteria<br />
for the monitor. In contrast, a profile monitor can be applied to<br />
more than one back-end web component of the same type and it will<br />
use the same set of performance criteria (a profile) for each of those<br />
web components. See also Profile and Profile monitor.<br />
DNS – Domain Name System (or Service). An Internet service that<br />
translates domain names into IP addresses.<br />
Escalation timeout – Amount of time (in minutes) that a <strong>OneSight</strong><br />
action exists before escalating to the next action in the Action Plan<br />
sequence.<br />
Good state – A <strong>OneSight</strong> indicator of the state of a metric, monitor,<br />
or monitor group. In <strong>OneSight</strong>, a Good state is represented by a<br />
green circle. When you configure monitor group monitors, you<br />
define the performance criteria that you want to track, associating<br />
the configuration with conditions, such as an exceeded threshold or<br />
a sample failure, that you want to be alerted about. In response to an<br />
alert, <strong>OneSight</strong> can either trigger an action plan, change a monitor’s<br />
health, or in some cases, do both.<br />
Host name – The name of a specific server on a specific network.<br />
HTTP – HyperText Transfer Protocol. The Internet protocol used to<br />
exchange HTML documents.<br />
Chapter 20: Glossary 925
Glossary<br />
HTTPS – Hypertext Transmission Protocol, Secure. A variation of<br />
HTTP used by Netscape to exchange documents securely. See also<br />
SSL.<br />
IIS – Internet Information Server. Microsoft’s web server that runs<br />
on Windows NT platforms. It is tightly integrated with the Windows<br />
operating system. IIS is available only for the Windows platform,<br />
whereas Netscape’s web servers run on all major platforms,<br />
including Windows NT, OS/2, and UNIX.<br />
ISP – Internet Service Provider. A company that provides access to<br />
the Internet. In addition to serving individuals, ISPs also serve large<br />
companies, providing a direct connection from the company’s<br />
networks to the Internet.<br />
Latency – The time delay of data traffic through a network or<br />
switch.<br />
Load balancing – Distributing processing and communications<br />
activity evenly across a computer network so that no single device<br />
is overwhelmed. Busy web sites typically employ two or more web<br />
servers in a load balancing scheme. Load balancing can also refer to<br />
the communications channels themselves.<br />
Metric – A measurement of a specific aspect of a web component,<br />
such as how much disk space a server has used. A metric can use<br />
one or more data sources (for example, SNMP or Perfmon) to gather<br />
information. Most metrics provided with <strong>OneSight</strong> are grouped into<br />
profiles. See also Data source and Profile.<br />
MIB – Management Information Base. A formal description of a set<br />
of network objects that can be managed using the Simple Network<br />
Management Protocol (SNMP). The format of the MIB is defined as<br />
part of the SNMP. Empirix <strong>OneSight</strong> supports specific profiles and<br />
metrics for RFC 1213 (MIB -II, available on any system that<br />
supports SNMP), and the Host Resources MIB (based on RFC 1514,<br />
available on many Linux and AS/400 systems), and the UCD<br />
926 <strong>OneSight</strong> <strong>Administrator</strong> <strong>Guide</strong>
Glossary<br />
package (University of California, Davis), available on many Linux<br />
systems.<br />
Monitor – A monitor checks the behavior of a specific web<br />
component using a defined set of performance standards. <strong>OneSight</strong><br />
then reports the general health of the component or reports any<br />
problems. <strong>OneSight</strong> includes monitors for components such as<br />
URLs that are critical to the web site, monitors for Internet servers<br />
such as FTP, DNS, or Mail, and monitors for databases, web servers,<br />
and operating systems. See also Dedicated monitor and Profile.<br />
Monitor group – A collection of monitors used to measure and<br />
manage the availability and performance of your entire web site.<br />
Use monitor groups to group together monitors in any way that is<br />
logical to you.<br />
NetBIOS – The NetBIOS name is the Windows Computer Name. In<br />
Windows NT, this is on the Identification tab in Network<br />
Neighborhood properties tab. In Windows 2000, it is on the<br />
Network Identification tab in My Computer properties. In <strong>OneSight</strong>,<br />
NetBIOS authentication allows access to data for the Service<br />
Monitor and finding components on Windows systems.<br />
OID – Object Identifier. A sequence of integers used to represent a<br />
node in the MIB tree. OIDs tell the SNMP data source which<br />
managed objects to monitor. See also MIB.<br />
<strong>OneSight</strong> Console – The tool you use to configure and view the<br />
status of your monitor groups. You can use a web browser on the<br />
<strong>OneSight</strong> Server to view the Console, or you can open a web<br />
browser on a remote machine.<br />
<strong>OneSight</strong> Remote Agent – An optional agent that you can install on a<br />
machine you want to monitor. This agent is necessary if you want to<br />
monitor remote logging information for the machine or execute a<br />
remote script, such as a system reboot if an alert occurs.<br />
Chapter 20: Glossary 927
Glossary<br />
<strong>OneSight</strong> Server – The server that runs <strong>OneSight</strong>. This is an<br />
Windows NT or Windows 2000 machine that manages all the<br />
performance statistics and the alerts that may be associated with<br />
them. You can use a web browser on the <strong>OneSight</strong> Server to view<br />
the Console, or you can open a web browser on a remote machine.<br />
Operator – The category of <strong>OneSight</strong> users that does not have<br />
access to any of the Configure pages within the Empirix <strong>OneSight</strong><br />
Console. The online help available to Operators does not show any<br />
topics pertaining to <strong>OneSight</strong> configuration. See also <strong>Administrator</strong>.<br />
Perfmon – Performance Monitor. A Microsoft tool that runs on<br />
Windows NT and Windows 2000 platforms. Perfmon is a graphical<br />
tool for measuring the performance of your own computer or other<br />
computers on a network.<br />
Ping – Packet Internet Groper. A utility that determines whether a<br />
specific IP address is accessible.<br />
Port – In TCP/IP and UDP networks, an endpoint to a logical<br />
connection. The port number identifies what type of port it is. For<br />
example, port 80 is used for HTTP traffic.<br />
Priority – Alerts associated with a Critical status have a higher<br />
priority than those associated with Warning status. You can<br />
configure different action plans appropriate to these alert priority<br />
levels. Within profiles, priority determines the order in which<br />
<strong>OneSight</strong> responds to alerts associated with profile metrics. For<br />
example, <strong>OneSight</strong> triggers an action plan associated with a profile<br />
that has a priority of High (System) before a profile that has a<br />
priority of Medium (Application). See also Alert.<br />
Profile – A default set of performance criteria. When you want to<br />
monitor a back-end web component such as an IIS server, an Oracle<br />
database, an Windows NT or Windows 2000 operating system, or a<br />
UNIX operating system, <strong>OneSight</strong> provides a profile so you can<br />
monitor performance of various critical functions carried out by that<br />
component. You can use a profile as-is, modify it, or create a new<br />
928 <strong>OneSight</strong> <strong>Administrator</strong> <strong>Guide</strong>
Glossary<br />
one. A profile can be applied to a single web component or to<br />
multiple web components. For example, if you have a web farm of<br />
multiple NT servers, you can define the same performance criteria<br />
for all of them in a single profile. When you apply a profile to a<br />
specific machine, you create a profile monitor. See also Metric and<br />
Profile monitor.<br />
Profile monitor – A monitor that uses a number of metrics to test the<br />
performance of various critical functions carried out by a back-end<br />
web component. To create a profile monitor, you apply a profile to<br />
a web component such as an IIS server, an Oracle database, an NT<br />
operating system, or a UNIX operating system on a specific<br />
machine. As you add a profile monitor, you will need to identify the<br />
system and enter system-specific information to describe its<br />
properties. A profile monitor can be applied to more than one web<br />
component of the same type and it will use the same set of<br />
performance criteria for each of those web components. In contrast,<br />
a dedicated monitor only applies to one web component. When<br />
adding a dedicated monitor, you always define unique performance<br />
criteria for the monitor. See also Dedicated monitor, Metric, and<br />
Profile.<br />
Proxy server – A server that sits between a client application (such<br />
as a web browser) and a real server. It intercepts all requests to the<br />
real server to see if it can fulfill the requests itself. If not, it<br />
forwards the request to the real server.<br />
Remote agent – See <strong>OneSight</strong> Remote Agent.<br />
Service – Work performed (or offered) by a server. This may mean<br />
simply serving simple requests for data to be sent or stored (as with<br />
file servers, email servers, SQL servers, etc.). To see details about<br />
Windows NT and Windows 2000 Services, click Start and select<br />
Settings, then Control Panel. In Control Panel, open Services.<br />
SMTP – Simple Mail Transfer Protocol. A protocol used to<br />
exchange mail between computers.<br />
Chapter 20: Glossary 929
Glossary<br />
SNMP – Simple Network Management Protocol. A set of rules<br />
governing the management of networks and the monitoring of<br />
network devices and functions. See also MIB.<br />
Solaris – A UNIX-based operating environment developed by Sun<br />
Microsystems. Originally developed to run on Sun’s SPARC<br />
workstations, Solaris now runs on many workstations from other<br />
vendors.<br />
SSL – Secure Sockets Layer. Netscape’s public key encryption and<br />
authentication software. Both Netscape Navigator and Internet<br />
Explorer support SSL, and many web sites use the protocol to obtain<br />
confidential user information, such as credit card numbers. By<br />
convention, web pages that require an SSL connection start with<br />
“https” instead of “http.” <strong>OneSight</strong> supports SSL when specifying<br />
URLs for URL monitors. SSL can also be used in combination with a<br />
proxy server. Up to 128-bit encryption is supported if enabled on<br />
the browser for the Empirix <strong>OneSight</strong> server.<br />
Threshold – A measurement set for a metric that defines what is and<br />
is not acceptable performance for that metric.<br />
Trap – To intercept an action or event before it occurs, usually in<br />
order to do something else. See also SNMP.<br />
Warning state – A <strong>OneSight</strong> indicator of the state of a metric,<br />
monitor, or monitor group. Web components that are in a Warning<br />
state may require your attention. In <strong>OneSight</strong>, a Warning state is<br />
represented by a yellow triangle. When you configure monitors, you<br />
define the performance criteria that you want to track and the<br />
conditions under which you want to receive an alert. In response to<br />
an alert, <strong>OneSight</strong> can either trigger an action plan, change a<br />
monitor’s health, or in some cases, do both.<br />
Web component – Any part of your web site that you would like to<br />
monitor. This can include devices such as your NT server or UNIX<br />
web farm, the database that supports your web site transactions, the<br />
web server software, or mission-critical URLs within your web site.<br />
930 <strong>OneSight</strong> <strong>Administrator</strong> <strong>Guide</strong>
Glossary<br />
Web farm – A cluster of web servers.<br />
XML – Extensible Markup Language. A language that lets designers<br />
create their own customized tags to provide functionality not<br />
available with HTML.<br />
Chapter 20: Glossary 931
Glossary<br />
[This page intentionally left blank.]<br />
932 <strong>OneSight</strong> <strong>Administrator</strong> <strong>Guide</strong>
Index<br />
Access Control, 813<br />
Access Control Tab, 462<br />
Action, 77, 923<br />
Action Plan, 77, 923<br />
Action Plan Manager, 636<br />
Action Plans<br />
Adding Actions, 638<br />
Creating, 633<br />
Modifying, 707<br />
New, 635<br />
Not Associated With Alerts, 720<br />
Retiring, 720<br />
Specifying, 98<br />
Symbols, 634<br />
Triggering, 422<br />
Actions<br />
Delay, 680<br />
Email, 645<br />
HTTP Post/Get, 690<br />
Monitor, 683<br />
Scripting, 663<br />
SNMP, 668<br />
SNMP Set, 675<br />
Socket Connection, 686<br />
Syslog, 694<br />
Actions List Manager, 644<br />
Actions Plans<br />
e-Mail, 443<br />
Adding<br />
Attributes Sets and Values, 735<br />
Component Types, 575<br />
Data Sources, 522<br />
Date Intervals, 844, 847<br />
Dependency Nodes, 103<br />
Location Groups, 802<br />
Metrics, 505<br />
Monitor Groups, 86<br />
Multiple Systems, 571<br />
Profiles, 493<br />
Systems, 565<br />
Users, 819<br />
Adding Actions, 638<br />
Administration Notifications, 905<br />
<strong>Administrator</strong>, 923<br />
Advanced Settings, 251, 312, 352<br />
Agent, 923<br />
Agent Proxy, 39<br />
Uninstalling, 57<br />
Agent Proxy Installation, 40<br />
Agents<br />
SNMP, 74<br />
Updating Remotely, 69<br />
Alert, 77, 923<br />
Alert Dependencies<br />
Specifying, 99<br />
Alert Dependencies Tab, 99<br />
Alert Dependency Tree, 101<br />
Alert Editor, 425<br />
Alert Specifying<br />
Alert Dependencies, 99<br />
Alerts<br />
Adding to Monitors, 419<br />
Changing for Multiple Monitors,<br />
472<br />
Defining, 102<br />
Editing Response, 447<br />
Threshold, 444<br />
Alerts Rights, 810<br />
Alerts Tab, 419<br />
Alphanumeric, 924<br />
Applications, 3<br />
ASCII, 924<br />
Assigning Attributes, 741<br />
Attribute Matrix Views, 747<br />
Attributes<br />
Assigning, 741<br />
933
Index<br />
Configuring, 735<br />
Attributes Sets and Values<br />
Adding, 735<br />
Removing, 740<br />
Attributes Tab, 457<br />
Authentication, 115<br />
Authentication Data, 292<br />
Avaya Communication Manager<br />
Profile Monitors, 116<br />
Bad Strings, 416<br />
Bulk Location Modification, 625<br />
CDRs<br />
Viewing, 893<br />
Cisco Call Manager Profile<br />
Monitors, 129<br />
Clients<br />
PC, 7<br />
UNIX, 7<br />
Cloning<br />
Metrics, 505<br />
Profiles, 493<br />
Codec Comparison Chart, 884<br />
Community String, 924<br />
Component Types, 575<br />
Components, 76<br />
Compound Metric Monitors, 153<br />
Configuration Data, 66<br />
Configuration Rights, 808<br />
Configure Monitors Page, 113<br />
Configuring<br />
Attribute Matrix Views, 747<br />
Attributes, 735<br />
Avaya Communication Manager,<br />
116<br />
Cisco Call Manager, 129<br />
Compound Metric, 153<br />
Custom Status Views, 753<br />
Database Monitors, 167<br />
Database Storage, 795<br />
Date Intervals, 844<br />
DNS Monitors, 181<br />
Downtime, 723<br />
Event Log Monitors, 238<br />
FTP Monitors, 245<br />
Gomez GPN Monitors, 186<br />
Gomez GPN Profile Monitors,<br />
191<br />
IDMC Profile Monitor, 151<br />
JMX Monitors, 215<br />
LDAP Monitors, 252<br />
Locations, 452<br />
Locations, 795<br />
Log File Monitors, 256<br />
Mail Monitors, 264<br />
Monitor Groups, 85<br />
Monitors, 113<br />
<strong>OneSight</strong> Call Statistics Profile<br />
Monitors, 196<br />
<strong>OneSight</strong> Probe Monitors, 201<br />
<strong>OneSight</strong> Voice Quality -<br />
Advanced Profile Monitors,<br />
376<br />
<strong>OneSight</strong> Voice Transaction<br />
Profile Monitors, 205<br />
Oracle OpenScript Profile<br />
Monitors, 272<br />
Oracle Test for Web Applications<br />
Monitors, 282<br />
Perfmon Monitors, 293<br />
Ping Monitors, 302<br />
Port Monitors, 306<br />
Process Monitors, 313<br />
Profile Monitors, 401<br />
Roles, 805<br />
Saved Status Groupings, 742<br />
Service Monitors, 318<br />
SNMP Monitors, 323<br />
SNMP Trap Monitors, 332<br />
State Machines, 365<br />
Systems, 565<br />
TCP Socket Monitors, 338<br />
URL Monitors', 344<br />
User Groups, 814<br />
Users, 805<br />
Virtual Agent Monitors, 356<br />
Voice Quality - Basic Profile<br />
Monitors, 371<br />
Voice Watch Monitors, 225<br />
Voice Watch Profile Monitors,<br />
231<br />
WMI Monitors, 387<br />
934 <strong>OneSight</strong> <strong>Administrator</strong> <strong>Guide</strong>
Index<br />
XMS Systems, 887<br />
Configuring Locations, 798<br />
Console, 927<br />
Cookie, 924<br />
CPU System, 577<br />
Creating<br />
SLAs, 829<br />
SLOs, 833<br />
Critical State, 924<br />
Custom Reports, 849<br />
Custom Status Views, 753<br />
Adding, 754<br />
Area, 770<br />
Creating Items, 758<br />
Deleting, 775<br />
Example, 775<br />
Frame, 772<br />
Image, 767<br />
Modifying, 774<br />
Monitor Group and Monitor, 760<br />
Report, 758<br />
Text, 765<br />
Data Collector, 924<br />
Installing, 19<br />
Removing, 55<br />
Requirements, 32<br />
Windows Installation, 32<br />
Data Source, 925<br />
Adding, 522<br />
for Status Chart, 96<br />
Data Sources<br />
Custom Reports, 852<br />
JDBC, 524<br />
JMX File, 526<br />
Log File, 527<br />
NT Event Log, 532<br />
Perfmon, 535<br />
Ping, 537<br />
Port, 538<br />
Process, 539<br />
Service, 540<br />
SNMP, 542<br />
SNMP Trap, 546<br />
Socket, 548<br />
UNIX, 551<br />
URL, 554<br />
Virtual Agent, 557<br />
WMI, 561<br />
Database<br />
Moving, 907<br />
Transferring Configuration Data,<br />
66<br />
Using a Remote, 63<br />
Database Backup, 65<br />
Database Errors, 910<br />
Database Information<br />
Viewing, 58<br />
Database Instance System, 586<br />
Database Log File System, 586<br />
Database Maintenance, 63<br />
Database Monitors, 167<br />
Query Tab, 174<br />
Database Storage<br />
Configuring, 795<br />
Database System, 579<br />
DataDirect Setup, 177<br />
Date Interval<br />
Adding, 844, 847<br />
Date Intervals<br />
Configuring, 844<br />
Dedicated Monitor, 925<br />
Dedicated Monitors, 2<br />
Default Ports, 46<br />
Defining<br />
Alerts, 102<br />
Delay Actions, 680<br />
Modifying, 714<br />
Deleting<br />
Location Groups, 803<br />
Roles, 813<br />
SLAs, 841<br />
SLOs, 844<br />
VQ Probes, 884<br />
Dependency Node Editor, 102<br />
Dependency Nodes<br />
Adding, 103<br />
Diagnostics Tab, 893<br />
Dial Numbers List<br />
Editing, 885<br />
Disabling<br />
Monitor Groups, 107<br />
Monitors, 471<br />
Index 935
Index<br />
System Components, 466<br />
Disk System, 586<br />
Diskperf, 51<br />
Displaying<br />
Windows Event Viewer, 451<br />
DNS, 925<br />
DNS Monitors, 181<br />
Downtime<br />
Configuring, 723<br />
Monitor, 463<br />
Monitor Groups, 106<br />
Editing<br />
Dial Numbers, 885<br />
VQ Probes, 871<br />
E-mail Action Plans, 443<br />
Email Actions<br />
Global, 700<br />
Modifying, 708<br />
Email Actions, 645<br />
E-mail Connection Validation, 271<br />
Email Connections<br />
Validating, 653<br />
Email Notification<br />
Replying To, 651<br />
Email Validating Email<br />
Connections, 653<br />
e-Monitor<br />
Features, 1<br />
Enabling<br />
Monitor Groups, 107<br />
Monitors, 471<br />
System Components, 466<br />
Escalation Timeout, 925<br />
Event Log Monitors, 238<br />
Exporting<br />
Monitors, 399<br />
Profiles, 504<br />
Exporting Scripts, 279, 280, 291<br />
File System, 589<br />
FTP Monitors, 245<br />
Gauge Reports<br />
Creating, 853<br />
Getting Started, 75<br />
Global Action List Manager, 698<br />
Global Action Options, 698<br />
Configuring, 644<br />
Global Actions<br />
Email, 700<br />
Incoming E-Mail, 705<br />
Scripting, 706<br />
Global Metric Manager, 504<br />
Global Options, 824<br />
Glossary, 923<br />
Gomez GPN Monitors, 186<br />
Gomez GPN Profile Monitors, 191<br />
Good State, 925<br />
Good Strings, 416<br />
H323 Parameters, 878, 879<br />
Host Name, 925<br />
HTTP, 925<br />
HTTP Post/Get Actions, 690<br />
Modifying, 718<br />
HTTPS, 18, 926<br />
IDMC Profile Monitors, 151<br />
IIS, 926<br />
Importing<br />
Metrics, 502<br />
Monitors, 400<br />
Profiles, 500<br />
Importing Scripts, 278, 290<br />
Importing Systems, 571<br />
Installing<br />
Agent Proxy, 40<br />
Data Collector, 19<br />
Remote Agents, 19<br />
Installing <strong>OneSight</strong>, 12<br />
Installing <strong>OneSight</strong>, 11<br />
Interface System, 590<br />
Introduction, 1<br />
ISP, 926<br />
JDBC Data Source, 522, 524<br />
JDBC Driver Options, 168<br />
JMX Data Source, 526<br />
JMX Monitors, 215<br />
Latency, 926<br />
LDAP Monitors, 252<br />
Licenses, 62<br />
Load Balancer System Information,<br />
592<br />
Load Balancing, 926<br />
Location Groups<br />
Adding, 802<br />
936 <strong>OneSight</strong> <strong>Administrator</strong> <strong>Guide</strong>
Index<br />
Deleting, 803<br />
Location Tab, 452<br />
Locations<br />
Changing for Multiple Monitors,<br />
481<br />
Configuring, 795<br />
Locations Tab, 798<br />
Log File Data Source, 522, 527<br />
Log File Monitors, 256, 416<br />
Log Profile Metrics, 439<br />
Mail Monitors, 264<br />
Mail Server, 704<br />
Configuring, 704<br />
Message Templates, 654<br />
Metric, 926<br />
Metric Editor<br />
Access Control Tab, 521<br />
Attributes Tab, 518<br />
Data Sources Tab, 518<br />
General Tab, 511<br />
Metric Performance Data, 416<br />
Metrics<br />
Adding, 505<br />
Adding to Profiles, 498<br />
Cloning, 505<br />
Creating, 901<br />
Importing, 502<br />
Managing Non-operational, 465<br />
Modifying, 505<br />
Modifying Data Source, 564<br />
Removing, 563<br />
Removing from Profiles, 498<br />
Metric's Sampling Interval, 562<br />
MIB, 927<br />
MIB Browser, 898<br />
Modifying<br />
Action Plans, 707<br />
Alerts for Multiple Monitors, 472<br />
Metrics, 505<br />
Monitor Groups, 90<br />
Monitors, 464<br />
Multiple Monitor Locations, 481<br />
Profiles, 493<br />
SLAs, 840<br />
SLOs, 842<br />
Users, 821<br />
Monitor, 77, 927<br />
Monitor Actions, 683<br />
Modifying, 715<br />
Monitor Attributes Tab, 457<br />
Monitor Group, 76, 927<br />
Monitor Group Editor, 88<br />
Monitor Groups<br />
Adding, 86<br />
Adding Monitors to, 109<br />
Configuring, 85<br />
Downtime, 106<br />
Enabling/Disabling, 107<br />
Modifying, 90<br />
Removing, 108<br />
Smartlink, 104<br />
Monitor Groups Page, 87<br />
Monitor Groups Tab, 461<br />
Monitors<br />
Adding Alerts, 419<br />
Adding Multiple, 486<br />
Adding to Monitor Groups, 109<br />
Configuring, 113<br />
Downtime, 463<br />
Enabling/Disabling, 471<br />
Exporting, 399<br />
Importing, 400<br />
Modifying, 464<br />
Removing, 472<br />
Testing, 467<br />
Multiple System Discovery, 623<br />
NetBIOS, 927<br />
Network Devices, 4<br />
Network Performance, 4<br />
NT Event Log Data Source, 522,<br />
532<br />
ODBC Setup, 176<br />
OID, 927<br />
<strong>OneSight</strong> Call Statistics Profile<br />
Monitors, 196<br />
<strong>OneSight</strong> Probe Monitors, 201<br />
<strong>OneSight</strong> Server Requirements<br />
<strong>OneSight</strong> Server, 5<br />
<strong>OneSight</strong> Service<br />
Starting, 57<br />
Stopping, 58<br />
Index 937
Index<br />
<strong>OneSight</strong> Voice Quality - Advanced<br />
Profile Monitors, 376<br />
<strong>OneSight</strong> Voice Transaction Profile<br />
Monitors, 205<br />
Opening<br />
the System Editor, 565, 577<br />
Operator, 928<br />
Oracle Database System, 579<br />
Oracle ODBC Setup, 176<br />
Oracle OpenScript Profile Monitors,<br />
272<br />
Oracle Test for Web Applciations<br />
Monitors, 282<br />
Out of Disk Space, 906<br />
Passwords, 824<br />
Changing System, 628<br />
Changing URL, 631<br />
Changing Virtual Agent, 631<br />
Changing Visual Script, 629<br />
Pattern Matching, 415<br />
Perfmon, 50, 928<br />
Perfmon Data Source, 522, 535<br />
Perfmon Monitors, 293<br />
Ping, 928<br />
Ping Data Source, 522, 537<br />
Ping Monitors, 302<br />
Port, 928<br />
Changing, 18<br />
Port Data Source, 538<br />
Port Monitors, 306<br />
Port System, 600<br />
Ports<br />
Default, 46<br />
Priority, 928<br />
Privileges<br />
User, 823<br />
Process Data Source, 539<br />
Process Monitors, 313<br />
Process System, 601<br />
Profile, 929<br />
Profile Manager, 404, 492<br />
Profile Monitor, 929<br />
Profile Monitors, 401<br />
Profile Symbols, 492<br />
Profiles<br />
Adding Metrics, 498<br />
Exporting, 504<br />
Importing, 500<br />
Main Settings, 494<br />
Removing, 500<br />
Removing Metrics, 498<br />
Updating, 18<br />
Profiles, 489<br />
Proxy Server, 929<br />
Proxy Server Settings, 190, 195,<br />
230, 237<br />
Proxy Settings, 281, 355<br />
Proxy Settings<br />
Changing, 487<br />
Query Tab, 174<br />
Regular Expressions, 415<br />
Testing, 896<br />
Remote Agent, 927<br />
Removing, 55<br />
UNIX Workstation Installation,<br />
27<br />
Windows Installation, 24<br />
Remote Agent Update, 69<br />
Remote Agents<br />
Installing, 19<br />
Requirements, 23<br />
Running UNIX, 30<br />
Remote Data Collectors, 20<br />
Removing<br />
Attributes Sets and Values, 740<br />
Data Collector, 55<br />
Metrics, 563<br />
Monitor Groups, 108<br />
Monitors, 472<br />
Profiles, 500<br />
Remote Agent, 55<br />
System Components, 627<br />
User Groups, 818<br />
Report Templates, 849<br />
Properties File, 851<br />
Running, 850<br />
Sample Configuration File, 857<br />
Reporting Rights, 811<br />
Requirements<br />
Client Web Browser, 7<br />
Data Collector, 32<br />
<strong>OneSight</strong> Server, 5<br />
938 <strong>OneSight</strong> <strong>Administrator</strong> <strong>Guide</strong>
Index<br />
Remote Agent, 23<br />
Web Components, 8<br />
Retiring Action Plans, 720<br />
Roles<br />
Configuring, 805<br />
Deleting, 813<br />
Sample Every Settings, 395<br />
Sample Locations, 452<br />
Sampling Interval, 562<br />
Saved Status Groupings, 742<br />
Scripting Actions, 663<br />
Global, 705, 706<br />
Modifying, 710<br />
Scripts<br />
Exporting, 279, 280, 291<br />
Importing, 278, 290<br />
Server, 928<br />
Server Port, 18<br />
Service, 929<br />
Service Data Source, 522, 540<br />
Service Level Agreements, 827,<br />
849, 863, 895<br />
Service Monitors, 318<br />
Service System Information, 593<br />
Session Timeout, 18<br />
SIP Parameters, 878, 879<br />
Skinny Parameters, 878<br />
SLA<br />
Creating, 829<br />
Deleting, 841<br />
Modifying, 840<br />
SLO<br />
Creating, 833<br />
Deleting, 844<br />
Modifying, 842<br />
SmartLink Tab, 453<br />
Smartlinks<br />
Monitor Groups, 104<br />
SMTP, 929<br />
SNMP, 49, 930<br />
SNMP Actions, 668<br />
Modifying, 711<br />
SNMP Agent, 74<br />
SNMP Data Source, 522, 542<br />
SNMP Monitors, 323<br />
SNMP Set Actions, 675<br />
Modifying, 713<br />
SNMP Trap Data Source, 523, 546<br />
SNMP Trap Monitors, 332<br />
Socket Connection Actions, 686<br />
Modifying, 717<br />
Socket Data Source, 548<br />
Solaris, 930<br />
Specifying<br />
Action Plans, 98<br />
SQL 2005 Configuration, 17<br />
SQL Database System, 582<br />
SSL, 18, 930<br />
Starting Remote Agents, 31<br />
Starting the <strong>OneSight</strong> Service, 57<br />
State Machines, 365<br />
Status Chart<br />
Specifying the Data Source, 96<br />
Status Rights, 812<br />
Stopping Remote Agents, 31<br />
Stopping the <strong>OneSight</strong> Service, 58<br />
Support Utilities, 903<br />
syslog Actions<br />
Modifying, 719<br />
Syslog Actions, 694<br />
System Adding<br />
System Components, 608<br />
System Components, 466<br />
Adding, 608<br />
Discovering Multiple, 623<br />
Modifying, 627<br />
Removing, 627<br />
System Editor<br />
Opening, 565, 577<br />
System Modifying<br />
System Components, 627<br />
System Properties Information, 594<br />
System Requirements, 4<br />
Systems<br />
Adding, 565<br />
Adding Multiple, 571<br />
Configuring, 565<br />
CPU, 577<br />
Database, 579<br />
Database Instance, 586<br />
Database Log File, 586<br />
Disk, 586<br />
Index 939
Index<br />
File, 589<br />
Interface, 590<br />
Load Balancer, 592<br />
Multiple Location Modification,<br />
625<br />
Oracle Database, 579<br />
Port, 600<br />
Process, 601<br />
Properties, 594<br />
Service, 593<br />
SQL Database, 582<br />
VM, 604<br />
VMProcess, 605<br />
Web Server, 606<br />
TCP Socket Monitors, 338<br />
Testing Monitors, 467<br />
Threshold, 930<br />
Threshold-based Alerts, 444<br />
Trace Route, 895<br />
Trap, 930<br />
Triggering Action Plans, 422<br />
Troubleshooting, 905<br />
Uninstalling <strong>OneSight</strong>, 53<br />
UNIX Data Source, 523, 551<br />
Updating Profiles, 18<br />
URL Data Source, 523, 554<br />
URL Monitors, 344<br />
User Groups<br />
Configuring, 814<br />
Removing, 818<br />
User Rights, 823<br />
Users<br />
Adding, 819<br />
Configuring, 805<br />
Modifying, 821<br />
Validating<br />
E-mail Connections, 271<br />
Virtual Agent Data Source, 557<br />
Virtual Agent Monitors, 356, 417<br />
VM System Information, 604<br />
VMProcess System Information,<br />
605<br />
Voice Quality - Basic Profile<br />
Monitors, 371<br />
Voice Watch Monitors, 225<br />
Voice Watch Profile Monitors, 231<br />
VQ Probes<br />
Deleting, 884<br />
Editing, 871<br />
VQ Probes, 869<br />
Warning State, 930<br />
Web Browser Requirements, 7<br />
Web Component, 930<br />
Web Component Configuration, 47<br />
Web Components Requirements, 8<br />
Web Farm, 931<br />
Web Server System, 606<br />
Windows Event Viewer, 451<br />
WMI Data Source, 561<br />
WMI Monitors, 387<br />
XML, 931<br />
XMS Systems<br />
Configuring, 887<br />
XP_CMDSHELL, 17<br />
940 <strong>OneSight</strong> <strong>Administrator</strong> <strong>Guide</strong>