Nucleic Acid Analysis with UV-vis and NMR - Spectroscopy
Nucleic Acid Analysis with UV-vis and NMR - Spectroscopy
Nucleic Acid Analysis with UV-vis and NMR - Spectroscopy

You also want an ePaper? Increase the reach of your titles
YUMPU automatically turns print PDFs into web optimized ePapers that Google loves.
®<br />
November 2009 Volume 24 Number 11<br />
www.spectroscopyonline.com<br />
<strong>Nucleic</strong> <strong>Acid</strong> <strong>Analysis</strong><br />
<strong>with</strong> <strong>UV</strong>-<strong>vis</strong> <strong>and</strong> <strong>NMR</strong><br />
The Sharp New Teeth<br />
of the FDA<br />
The Importance of<br />
Pressure <strong>and</strong> Vacuum
te<br />
4 <strong>Spectroscopy</strong> 24(11) November 2009 www.spectroscopyonline.com<br />
®<br />
MANUSCRIPTS: To discuss possible article topics or obtain manuscript preparation<br />
guidelines, contact The Editor at: (732) 596-0276, e-mail: spectroscopyedit@advanstar.<br />
com. Publishers assume no responsibility for safety of artwork, photographs, or manuscripts.<br />
Every caution is taken to ensure accuracy, but publishers cannot accept responsibility for the<br />
information supplied herein or for any opinion expressed.<br />
SUBSCRIPTIONS: For subscription information: <strong>Spectroscopy</strong>, P.O. Box 6196, Duluth, MN<br />
55806-6196; (866) 529-2922, 8 a.m. to 4:30 p.m. CST. Outside the U.S., (866) 529-2922.<br />
Delivery of <strong>Spectroscopy</strong> outside the U.S. is 3–14 days after printing. Single-copy price:<br />
U.S., $10.00 + $7.00 postage <strong>and</strong> h<strong>and</strong>ling ($17.00 total); Canada <strong>and</strong> Mexico, $12.00 + $7.00<br />
postage <strong>and</strong> h<strong>and</strong>ling ($19.00 total); Other international, $15.00 + $7.00 postage <strong>and</strong> h<strong>and</strong>ling<br />
($22.00 total).<br />
CHANGE OF ADDRESS: Notices should be sent promptly; provide old mailing label as well<br />
as new address; include ZIP or postal code. Allow 4–6 weeks for change.<br />
RETURN ALL UNDELIVERABLE CANADIAN ADDRESSES TO: Circulation Dept. or<br />
DPGM, 7496 Bath Road #2, Mississauga ON L4T 1L2, Canada.<br />
BACK ISSUES, MICROFILM, MICROFICHE: (800) 598-6008.<br />
REPRINTS: Reprints of all articles in this issue <strong>and</strong> past issues are available<br />
(500 minimum). Contact S<strong>and</strong>y Sailes-Colbert, Reprint Marketing Ad<strong>vis</strong>or, (440) 891-2761<br />
or (800) 225-4569 ext. 2761; e-mail: scolbert@advanstar.com<br />
DIRECT LIST RENTAL: Contact Tamara Phillips, (440) 891-2773; e-mail: tphillips@<br />
advanstar.com<br />
INTERNATIONAL LICENSING: Maureen Cannon, (440) 891-2742,<br />
fax: (440) 891-2650; e-mail: mcannon@advanstar.com.<br />
<strong>Spectroscopy</strong> does not verify any claims or other information appearing in any of the<br />
advertisements contained in the publication, <strong>and</strong> cannot take any responsibility for any<br />
losses or other damages incurred by readers in reliance on such content.<br />
<strong>Spectroscopy</strong> welcomes unsolicited articles, manuscripts, photographs, illustrations <strong>and</strong><br />
other materials but cannot be held responsible for their safekeeping or return.<br />
Advanstar Communications provides certain customer contact data (such as customers’<br />
names, addresses, phone numbers, <strong>and</strong> e-mail addresses) to third parties who wish to<br />
promote relevant products, services <strong>and</strong> other opportunities that may be of interest to you.<br />
If you do not want Advanstar Communications to make your contact information available to<br />
third parties for marketing purposes, simply call toll-free (866) 529-2922 between the hours<br />
of 7:30 a.m. <strong>and</strong> 5 p.m. CST, <strong>and</strong> a customer service representative will assist you in removing<br />
your name from Advanstar’s lists. Outside the United States, please phone (866) 529-2922.<br />
50% Recycled Paper<br />
s10-20% Post Consumer Wa<br />
©2009 Advanstar Communications Inc. All rights reserved. No part of this<br />
publication may be reproduced or transmitted in any form or by any means,<br />
electronic or mechanical, including by photocopy, recording, or information storage<br />
<strong>and</strong> retrieval <strong>with</strong>out permission in writing from the publisher. Authorization to<br />
photocopy items for internal/educational or personal use, or the internal/educational or personal<br />
use of specific clients, is granted by Advanstar Communications Inc. for libraries <strong>and</strong> other users<br />
registered <strong>with</strong> the Copyright Clearance Center, 222 Rosewood Dr., Danvers, MA 01923, 978-750-<br />
8400, fax 978-646-8700. For uses beyond those listed above, please direct your written request<br />
to Permission Dept. fax 440-891-2650 or email: mcannon@advanstar.com.<br />
Advanstar Communications Inc. (www.advanstar.com) is a leading worldwide media company<br />
providing integrated marketing solutions for the Fashion, Life Sciences <strong>and</strong> Powersports<br />
industries. Advanstar serves business professionals <strong>and</strong> consumers in these industries <strong>with</strong> its<br />
portfolio of 91 events, 67 publications <strong>and</strong> directories, 150 electronic publications <strong>and</strong> Web<br />
sites, as well as educational <strong>and</strong> direct marketing products <strong>and</strong> services. Market leading br<strong>and</strong>s<br />
<strong>and</strong> a commitment to delivering innovative, quality products <strong>and</strong> services enables Advanstar<br />
to “Connect Our Customers With Theirs.” Advanstar has approximately 1000 employees <strong>and</strong><br />
currently operates from multiple offices in North America <strong>and</strong> Europe.<br />
All color separations, proofs, <strong>and</strong> film produced by Advanstar’s Scanning <strong>and</strong><br />
Digital Prepress Departments.
®<br />
6 <strong>Spectroscopy</strong> 24(11) November 2009 www.spectroscopyonline.com<br />
Contents<br />
Columns<br />
Volume 24 Number 11<br />
November 2009<br />
November 2009<br />
Volume 24 Numb er 11<br />
MASS SPECTROMETRY FORUM 16<br />
Pressure <strong>and</strong> Vacuum: Not Really Trivial<br />
Good vacuum system design is a crucial underpinning for high performance instrumentation.<br />
The important aspects of pressure <strong>and</strong> vacuum need regular teaching, <strong>and</strong> here Ken Busch<br />
discusses them.<br />
Kenneth L. Busch<br />
The Tiger Has Sharp New Teeth<br />
The new FDA Commissioner wants a strong FDA <strong>and</strong> is backing her words <strong>with</strong> action by<br />
initiating a program that cuts the time that firms must respond to 483 observations from<br />
30 to 15 business days. Not only is the time halved but the response must be complete!<br />
Therefore, it is better <strong>and</strong> cheaper to be compliant than not.<br />
R.D. McDowall<br />
FOCUS ON QUALITY<br />
23<br />
Cover image courtesy of<br />
Getty Images.<br />
DEPARTMENTS<br />
From the Editor 8<br />
News Spectrum 14<br />
Product Resources 44<br />
Calendar 47<br />
Ad Index 50<br />
ATOMIC PERSPECTIVES<br />
Speciation <strong>Analysis</strong> by LC–ICP-MS<br />
Speciation analysis by LC-ICP-MS has been growing rapidly in popularity <strong>and</strong> application<br />
over the past several years. Not only have people begun looking at different elements <strong>and</strong><br />
species, but there has been an increase in the variety of matrices that speciation analysis is<br />
being performed on.<br />
Kenneth Neubauer<br />
Articles<br />
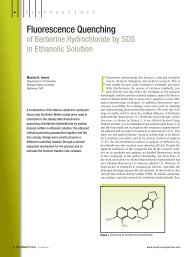
Interaction of Indigo Carmine <strong>with</strong> <strong>Nucleic</strong> <strong>Acid</strong>s in the Presence 34<br />
of Cetyltrimethylammonium Bromide: Spectral Studies <strong>and</strong> the<br />
Confirmation of Combined Points<br />
The interaction of indigo carmine <strong>with</strong> nucleic acids in weak acid medium was studied in the<br />
presence of cetyltrimethylammonium bromide (CTMAB) using resonance light scattering,<br />
<strong>UV</strong>-<strong>vis</strong>, <strong>and</strong> <strong>NMR</strong>.<br />
30<br />
Changqun Cai, Xiaoming Chen, <strong>and</strong> Hang Gong<br />
www.spectroscopyonline.com<br />
● Article Archive<br />
● Calendar of Events<br />
● Information for Authors<br />
● Useful Links<br />
● Application Notes<br />
● Subscribe/Renew Information<br />
... <strong>and</strong> more!<br />
<strong>Spectroscopy</strong> (ISSN 0887-6703 [print], ISSN 1939-1900 [digital]) is published monthly by Advanstar Communications, Inc.,<br />
131 West First Street, Duluth, MN 55802-2065. <strong>Spectroscopy</strong> is distributed free of charge to users <strong>and</strong> specifiers of spectroscopic<br />
equipment in the United States. <strong>Spectroscopy</strong> is available on a paid subscription basis to nonqualified readers<br />
at the rate of: U.S. <strong>and</strong> possessions: 1 year (12 issues), $74.95; 2 years (24 issues), $134.50. Canada/Mexico: 1 year, $95; 2 years,<br />
$150. International: 1 year (12 issues), $140; 2 years (24 issues), $250. Periodicals postage paid at Duluth, MN 55806 <strong>and</strong> at<br />
additional mailing offices. POSTMASTER: Send address changes to <strong>Spectroscopy</strong>, P.O. Box 6196, Duluth, MN 55806-6196.<br />
Canadian GST number: R-124213133RT001, Publications Mail Agreement Number 40017597. Printed in the U.S.A.<br />
This Month in Wavelength:<br />
Fluorescence<br />
Watch your e-mail inbox for the latest<br />
issue, or follow the link at<br />
www.spectroscopyonline.com to sign up to<br />
start receiving Wavelength.
8 <strong>Spectroscopy</strong> 24(11) November 2009 www.spectroscopyonline.com<br />
From the Editor<br />
A Stronger FDA: What Does It Mean for You?<br />
The FDA, like the IRS or the DMV, is one of those governmental agencies that by its<br />
very nature can inspire many <strong>with</strong> at least a hint of dread. For one thing, it can often<br />
seem that they are only heard from when something bad is happening (that is, you<br />
haven’t paid your taxes, you haven’t paid a speeding ticket . . . or there is an inspection of<br />
your facility on the way).<br />
Here at <strong>Spectroscopy</strong>, we leave the politics of the “Bush FDA” versus the “Obama FDA” to<br />
others, <strong>and</strong> instead focus on what is currently happening <strong>and</strong> how it impacts the laboratories<br />
<strong>and</strong> the daily work of our readers. In other words, we try to answer the question, “What<br />
does it all mean for me?” With this in mind, columnist Bob McDowall, one of the foremost<br />
experts on not only the FDA <strong>and</strong> its policies <strong>and</strong> regulations, but compliance in general,<br />
presents his take on the recent FDA Modernization Act <strong>and</strong> the posture of the FDA <strong>and</strong><br />
its new commissioner, Margaret Hamburg, in general. Admittedly, the title of his column<br />
gives away his point of view to a large degree, as “The Tiger Has Sharp New Teeth” tells you<br />
where he thinks the FDA is headed. Tougher enforcement, shorter compliance times, <strong>and</strong><br />
more appear to be on deck, but as always, Bob has answers <strong>and</strong> advice on how to succeed<br />
in this new environment. For whether you believe tougher regulation <strong>and</strong> enforcement is a<br />
good thing or a bad thing, the fact is that the laboratories of many readers will be forced to<br />
confront the coming changes regardless.<br />
At <strong>Spectroscopy</strong>, we have always made it our mission to bring readers practical, nuts-<strong>and</strong>bolts<br />
information to help them in their daily work, <strong>and</strong> this column, aimed at those on the<br />
frontlines of materials analysis, is just one more example of this mission in action. We hope<br />
you find this column <strong>and</strong> the other columns <strong>and</strong> technical research in this issue useful, <strong>and</strong><br />
as always, feel free to contact myself or any one of our staff members at the e-mail addresses<br />
listed.<br />
Enjoy the issue.<br />
David Walsh<br />
Editor-in-Chief<br />
David.Walsh@advanstar.com
10 <strong>Spectroscopy</strong> 24(11) November 2009 www.spectroscopyonline.com<br />
®<br />
PUBLISHING & SALES<br />
485 Route One South, Building F, First Floor<br />
Iselin, NJ 08830<br />
(732) 596-0276, Fax: (732) 225-0211<br />
Michael J. Tessalone<br />
Science Group Publisher, mtessalone@advanstar.com<br />
Edward Fantuzzi<br />
Publisher, efantuzzi@advanstar.com<br />
Stephanie Shaffer<br />
East Coast Sales Manager, sshaffer@advanstar.com<br />
(508) 481-5885<br />
EDITORIAL<br />
David Walsh<br />
Editor-in-Chief, david.walsh@advanstar.com<br />
Stephen A. Brown<br />
Group Technical Editor, sbrown@advanstar.com<br />
Dan Ward<br />
Art Director, dward@advanstar.com<br />
MARKETING<br />
Anne Young<br />
Marketing Manager, ayoung@advanstar.com<br />
MARKET DEVELOPMENT<br />
Tamara Phillips<br />
Direct List Rentals, tphillips@advanstar.com<br />
S<strong>and</strong>y Sailes-Colbert<br />
Reprints, scolbert@advanstar.com<br />
Maureen Cannon<br />
Permissions, mcannon@advanstar.com<br />
PRODUCTION AND AUDIENCE DEVELOPMENT<br />
Lisa Johnson<br />
Production Director, ljohnson@advanstar.com<br />
Rhonda Rychlak<br />
Production Manager, rrychlak@advanstar.com<br />
Peggy Olson<br />
Audience Development Manager, polson@advanstar.com<br />
Gail Mantay<br />
Audience Development Assistant Manager, gmantay@advanstar.com<br />
Joseph Loggia<br />
President, Chief Executive Officer<br />
Ted Alpert<br />
Executive Vice President, Finance & Chief Financial Officer<br />
Eric I. Lisman<br />
Executive Vice President, Corporate Development<br />
Tony Calanca<br />
Executive Vice President, Exhibitions<br />
Chris DeMoulin<br />
Executive Vice President, Fashion Group<br />
Danny Phillips<br />
Executive Vice President, Powersports, Veterinary & Dental Group<br />
Georgiann DeCenzo<br />
Executive Vice President, Market Development, Europe & Licensing Group<br />
Steve Morris<br />
Executive Vice President, Life Sciences Group<br />
Francis Heid<br />
Vice President, Media Operations<br />
J Vaughn<br />
Vice President, Information Technology<br />
Mike Alic<br />
Vice President, Electronic Media Group<br />
Nancy Nugent<br />
Vice President, Human Resources<br />
Ward D. Hewins<br />
Vice President, General Counsel<br />
David C. Esola<br />
Vice-President, General Manager
12 <strong>Spectroscopy</strong> 24(11) November 2009 www.spectroscopyonline.com<br />
Editorial Ad<strong>vis</strong>ory Board<br />
Ramon M. Barnes University of Massachusetts<br />
Paul N. Bourassa Lifeblood<br />
Chris W. Brown University of Rhode Isl<strong>and</strong><br />
Kenneth L. Busch National Science Foundation<br />
Ashok L. Cholli University of Massachusetts at Lowell<br />
David M. Coleman Wayne State University<br />
Patricia B. Coleman Ford Motor Company<br />
Bruce Hudson Syracuse University<br />
Kathryn S. Kalasinsky Armed Forces Institute of Pathology<br />
David Lankin University of Illinois at Chicago, College of Pharmacy<br />
Barbara S. Larsen DuPont Central Research <strong>and</strong> Development<br />
Ian R. Lewis Kaiser Optical Systems<br />
Steve Lowry ThermoFisher Scientific<br />
Howard Mark Mark Electronics<br />
R.D. McDowall McDowall Consulting<br />
Linda Baine McGown Rensselaer Polytechnic Institute<br />
Robert G. Messerschmidt Rare Light, Inc.<br />
Nancy Miller-Ihli M–I Research<br />
Francis M. Mirabella Jr. Equistar Technology Center<br />
John Monti Shimadzu Scientific Instruments<br />
Thomas M. Niemczyk University of New Mexico<br />
Anthony J. Nip CambridgeSoft Corp.<br />
John W. Olesik The Ohio State University<br />
Richard J. Saykally University of California, Berkeley<br />
Basil I. Swanson Los Alamos National Laboratory<br />
Jerome Workman Jr. Luminous Medical, Inc.<br />
Contributing Editors:<br />
Fran Adar Horiba Jobin Yvon<br />
David W. Ball Clevel<strong>and</strong> State University<br />
Kenneth L. Busch National Science Foundation<br />
John Coates Coates Consulting<br />
Howard Mark Mark Electronics<br />
Volker Thomsen Consultant<br />
Jerome Workman Jr. Luminous Medical, Inc.<br />
Process <strong>Analysis</strong> Ad<strong>vis</strong>ory Panel:<br />
James M. Brown Exxon Research <strong>and</strong> Engineering Company<br />
Bruce Buchanan Sensors-2-Information<br />
Lloyd W. Burgess CPAC, University of Washington<br />
James Rydzak Glaxo SmithKline<br />
Robert E. Sherman CIRCOR Instrumentation Technologies<br />
John Steichen DuPont Central Research <strong>and</strong> Development<br />
D. Warren Vidrine Vidrine Consulting<br />
European Regional Editors:<br />
John M. Chalmers VSConsulting, United Kingdom<br />
David A.C. Compton Industrial Chemicals Ltd.<br />
<strong>Spectroscopy</strong>’s Editorial Ad<strong>vis</strong>ory Board is a group of distinguished individuals<br />
assembled to help the publication fulfill its editorial mission to promote the effective<br />
use of spectroscopic technology as a practical research <strong>and</strong> measurement tool.<br />
With recognized expertise in a wide range of technique <strong>and</strong> application areas, board<br />
members perform a range of functions, such as reviewing manuscripts, suggesting<br />
authors <strong>and</strong> topics for coverage, <strong>and</strong> providing the editor <strong>with</strong> general direction <strong>and</strong><br />
feedback. We are indebted to these scientists for their contributions to the publication<br />
<strong>and</strong> to the spectroscopy community as a whole.
14 <strong>Spectroscopy</strong> 24(11) November 2009 www.spectroscopyonline.com<br />
News Spectrum<br />
Research<br />
Scientists using planetary spectroscopy recently reported<br />
that the basic ingredients for life have been found around<br />
a second extrasolar planet. Although the planet itself<br />
is uninhabitable for any forms of life found on Earth,<br />
the discovery shows that the basic components of life<br />
are widespread in the atmospheres of many kinds of<br />
exoplanets.<br />
To make this discovery, researchers trained the Hubble<br />
<strong>and</strong> Spitzer Space Telescopes on HD 209458b, a hot<br />
Jupiter that orbits very close to its sunlike star. Located<br />
150 light years away in the Pegasus constellation, this<br />
star has been the subject of previous studies, such as that<br />
undertaken in December of 2008 by researchers from the<br />
Jet Propulsion Laboratory, Pasadena, California. At<br />
that time, a similar Jupiter-like planet, HD 189733b, was<br />
found to have carbon dioxide in its atmosphere.<br />
Planetary spectroscopy is easiest to do for systems in<br />
which a large exoplanet orbits very close to its home star.<br />
With smaller planets orbiting farther from their star, it is<br />
harder to detect the minute changes in the star’s light.<br />
Researchers from Forschungszentrum Jülich, an<br />
interdisciplinary research center located in Kreis Düren,<br />
Germany, have utilized a new form of spectroscopy<br />
to identify explosive liquids, or liquid components for<br />
the fabrication of explosives, in plastic bottles almost<br />
instantly. This novel method uses electromagnetic<br />
radiation to identify materials, <strong>and</strong> a novel nanoelectronic<br />
device to detect signals.<br />
The researchers have suggested a fast <strong>and</strong> reliable<br />
way to increase the range of frequencies that their<br />
spectrometer can analyze, thereby verifying the molecular<br />
signature of the liquid <strong>and</strong> creating a much more detailed<br />
“thumbprint” that can be checked against the range of<br />
possibly dangerous liquids available to terrorists.<br />
The method is called Hilbert spectroscopy, <strong>and</strong> it<br />
works over a wider range of frequencies, from a few<br />
gigahertz to a few terahertz. With the incorporation of<br />
a Josephson junction, which is a nanoscale electronic<br />
device, the researchers have undertaken practical<br />
detection experiments that can directly transform the<br />
electromagnetic spectrum received by the spectrometer<br />
into an electrical signal that warns of suspicious fluids.<br />
A team of researchers from Duke University’s<br />
Marine Laboratory, Durham, North Carolina recently<br />
used atomic force microscopy <strong>and</strong> mass spectrometry<br />
to solve the mystery of what makes barnacles adhere<br />
so tenaciously to various surfaces while underwater.<br />
Scientists have long known the chemical properties of the<br />
glue these crustaceans use, but not how these chemicals<br />
interact to create a sticky effect.<br />
The team discovered how to gently remove this glue<br />
Market Profile: Portable Fluorometers<br />
A small niche market <strong>with</strong>in fluorescence spectroscopy<br />
is portable fluorometers. Primary applications are in the<br />
agricultural industry, but there is considerable potential<br />
elsewhere. The market l<strong>and</strong>scape is small <strong>and</strong> fragmented,<br />
<strong>with</strong> no dominant leader, <strong>and</strong> significant potential<br />
for growth.<br />
Environmental<br />
testing (21%)<br />
By far the most common application<br />
for portable fluorometers<br />
is as the chlorophyll fluorescence<br />
system. Such analysis can<br />
provide information for a number<br />
of agriculturally <strong>and</strong> environmentally<br />
important applications,<br />
such as identification of<br />
genetically modified crops, plant<br />
health, pesticide levels, <strong>and</strong><br />
more. Other uses include evaluation<br />
of water quality by way of algae levels. An area<br />
of significant potential that has yet to be realized is in<br />
clinical <strong>and</strong> biological analyses, where there is currently<br />
significant work underway in exploring the potential of<br />
portable <strong>and</strong> h<strong>and</strong>held fluorometers.<br />
There are quite a few competitors in the market, <strong>with</strong><br />
many of them based in Europe. However, almost all of<br />
Other (17%)<br />
Portable fluorescence dem<strong>and</strong> in 2009.<br />
these companies are small, independent manufacturers.<br />
None of the major diversified spectroscopy vendors currently<br />
compete in the portable fluorescence market.<br />
The worldwide market for portable fluorometers is<br />
less then $10 million, but is expected to see double-digit<br />
annual growth due to the continued<br />
growth of agricultural<br />
<strong>and</strong> environmental applications,<br />
as well as the potential dem<strong>and</strong><br />
from clinical <strong>and</strong> biological<br />
applications.<br />
The foregoing data were based<br />
upon SDi’s market analysis<br />
<strong>and</strong> perspectives report<br />
Agriculture (62%)<br />
entitled Global Assessment<br />
Report, 10th Edition: The<br />
Laboratory Life Science <strong>and</strong><br />
Analytical Instrument Industry, September 2008.<br />
For more information, contact Stuart Press, Vice<br />
President – Strategic <strong>Analysis</strong>, Strategic Directions<br />
International, Inc., 6242 Westchester Parkway, Suite<br />
100, Los Angeles, CA 90045, (310) 641-4982, fax:<br />
(310) 641-8851, www.strategic-directions.com.
www.spectroscopyonline.com<br />
November 2009 <strong>Spectroscopy</strong> 24(11) 15<br />
from the barnacles (Amphibalanus<br />
amphitrite) as they secreted it, wihch<br />
enabled them to deconstruct the glue<br />
<strong>and</strong> find out exactly how it worked.<br />
They initially compared the glue<br />
to another substance that clots in<br />
solution, red blood cells, expecting<br />
the mechanism by which glue<br />
particles bind, <strong>and</strong> red blood cells<br />
bind, to be different.<br />
However, they found they are<br />
strikingly similar. In blood, a number<br />
of enzymes work to create long<br />
protein fibers that bind red blood<br />
cells together into a clot <strong>and</strong> create a<br />
scab. Using atomic force microscopy<br />
<strong>and</strong> mass spectrometry among other<br />
techniques, the team found that very<br />
similar enzymes, known as trypsinlike<br />
serine proteases, are at work<br />
in barnacle glue. One of these glue<br />
enzymes is very similar to Factor XIII,<br />
an essential blood clotting agent in<br />
human blood.<br />
However, these results do make<br />
evolutionary sense, says team<br />
member Professor Dan Rittschof:<br />
“Virtually no biochemical pathway is<br />
br<strong>and</strong> new. Everything is related <strong>and</strong><br />
really important pathways are used<br />
over <strong>and</strong> over,” he explains.<br />
Scientists <strong>and</strong> engineers from<br />
NASA’s Langley Research Center,<br />
Hampton, Virgina, recently<br />
deployed an instrument named<br />
the “Far-Infrared <strong>Spectroscopy</strong> of<br />
the Troposphere (FIRST)” in order<br />
to measure the effect of highaltitude<br />
water vapor on the Earth’s<br />
atmosphere. Deployed in the “driest<br />
place in the world,” the Chilean<br />
desert of Atacama, FIRST is one of<br />
only four instruments of its kind in<br />
the world.<br />
It is hoped that the instrument will<br />
help researchers predict changes in<br />
the Earth’s climate more effectively,<br />
as it measures a b<strong>and</strong> of radiation<br />
linked to the absorption of water<br />
vapor through the greenhouse effect.<br />
This radiation activity is a significant<br />
climate factor <strong>and</strong> many believe that<br />
it may comprise up to half of the<br />
Earth’s natural cooling mechanism.<br />
Even though other major factors have<br />
been studied from orbit, up until<br />
now, the technology has not existed<br />
to do the same <strong>with</strong> water vapor. If<br />
successful, the FIRST equipment will<br />
deliver the first precisely measurable<br />
insights into the effect of water vapor<br />
on the Earth’s climate.<br />
Industry<br />
The Institute for Systems Biology<br />
(ISB) (Seattle, Washington), <strong>and</strong><br />
Agilent Technologies, Inc. (Santa<br />
Clara, California) announced a<br />
collaboration to create the Human<br />
Multiple Reaction Monitoring (MRM)<br />
Atlas, a comprehensive resource<br />
designed to enable scientists to<br />
perform quantitative analysis of<br />
all human proteins. The project is<br />
expected to fuel research gains in<br />
biomarker discovery <strong>and</strong> validation,<br />
the search for protein-based<br />
diagnostic tests, personalized<br />
medicine, <strong>and</strong> human health<br />
monitoring.<br />
The program is supported by grants<br />
totaling $4.6 million to ISB’s Robert<br />
Moritz <strong>and</strong> Leroy Hood for developing<br />
the “Complete Human Peptide<br />
<strong>and</strong> MRM Atlas” by the National<br />
Human Genome Research Institute<br />
of the National Institutes of Health,<br />
under “The American Recovery<br />
<strong>and</strong> Reinvestment Act - Grant<br />
Opportunities.” Ruedi Aebersold<br />
of the Swiss Federal Institute<br />
of Technology (ETH), Zurich,<br />
Switzerl<strong>and</strong> is collaborating as well,<br />
<strong>with</strong> additional funding from the<br />
European Research Council.<br />
“We believe this will be a<br />
revolutionary development in protein<br />
analysis,” said Rob Moritz, ISB faculty<br />
member <strong>and</strong> director of Proteomics,<br />
“one that will accelerate <strong>and</strong><br />
catalyze the routine use of protein<br />
quantitation for immensely important<br />
breakthroughs in the underst<strong>and</strong>ing,<br />
early detection, <strong>and</strong> monitoring of<br />
human disease.”<br />
The atlas is designed to enable<br />
scientists to quantitatively access the<br />
approximately 20,000 proteins in<br />
human tissues, cell lines, <strong>and</strong> blood,<br />
potentially transforming many areas<br />
of human health research.<br />
Waters Corporation (Milford,<br />
Massachusetts) recently held the<br />
2nd Annual Global Food Safety Policy<br />
Forum <strong>with</strong> the Center for Science<br />
in the Public Interest (CSPI) in<br />
Washington, DC, to bring together<br />
policymakers <strong>and</strong> private experts<br />
from around the globe to discuss<br />
solutions that improve food supply in<br />
the U.S. <strong>and</strong> worldwide.<br />
U.S. Rep. Rosa DeLauro, the House<br />
of Representative’s leading food<br />
safety champion, delivered the<br />
keynote address. She called for<br />
a robust U.S. traceability system,<br />
equivalency <strong>with</strong> trading partners,<br />
<strong>and</strong> greater reliance on science <strong>and</strong><br />
technology to improve the safety of<br />
food imports. “This is about food<br />
safety science <strong>and</strong> where we want to<br />
go,” she said.<br />
CSPI Director of Food Safety<br />
Caroline Smith DeWaal said Congress<br />
has taken steps to improve U.S.<br />
food safety but new legislation<br />
is needed because the country is<br />
operating under antiquated laws<br />
<strong>and</strong> consumers are increasingly<br />
concerned.<br />
The Government Accountability<br />
Office released a new report at the<br />
Forum, concluding that FDA <strong>and</strong><br />
USDA have taken steps to address the<br />
challenges in ensuring the safety of<br />
food imports but the agencies need<br />
to make better use of data available<br />
to them to target riskier imports <strong>and</strong><br />
learn from the European Union’s<br />
system.<br />
HORIBA (Edison, New<br />
Jersey) has entered into a<br />
purchase agreement of l<strong>and</strong> for<br />
the construction of a new research<br />
facility on the campus of Ecole<br />
Polytechnique Paris, France) as<br />
part of the PARIS Saclay cluster.<br />
The new facility will welcome the<br />
headquarters of the recently created<br />
holding for all corporate activities in<br />
Europe, HORIBA Europe Holding SAS,<br />
consolidating 350M EUR <strong>and</strong> 1700<br />
employees in France, Germany, UK,<br />
Italy, <strong>and</strong> Spain. It will also serve as<br />
HORIBA’s European Research Centre.<br />
The facility will be initially 7500 m 2<br />
<strong>with</strong> a late 2011 move in, <strong>with</strong> the<br />
possibility of exp<strong>and</strong>ing to 18,000 m 2<br />
in later phases. ◾
16 <strong>Spectroscopy</strong> 24(11) November 2009 www.spectroscopyonline.com<br />
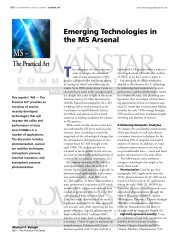
Mass Spectrometry Forum<br />
Pressure <strong>and</strong> Vacuum:<br />
Not Really Trivial<br />
Achieving <strong>and</strong> maintaining vacuum in a mass spectrometer, <strong>and</strong> measuring <strong>and</strong> monitoring<br />
the vacuum pressure, is fundamental for proper instrument operation. This installment of<br />
“Mass Spectrometry Forum” discusses some basic issues relevant to pressure measurement.<br />
Kenneth L. Busch<br />
In the ideal (off) world, we would assemble <strong>and</strong> operate<br />
our mass spectrometers in geosynchronous orbit. With<br />
ultralow pressure <strong>and</strong> infinite pumping capacity right<br />
outside the laboratory window, a few solar panels providing<br />
the power needed to operate the instrument (which is really<br />
minimal outside the power needed to operate vacuum<br />
pumps), <strong>and</strong> no terrestrial distractions, the only remaining<br />
impediment would be the wait that may be needed for appearance<br />
of a service engineer. The constrained transport<br />
chain for getting samples from Earth to the orbiting instrument<br />
might prove to be a blessing in disguise, serving to<br />
discourage submission of casual or repetitive samples, <strong>and</strong><br />
focusing attention on properly prepared <strong>and</strong> validated samples.<br />
Should the return <strong>vis</strong>it to Earth for the annual ASMS<br />
meeting become problematic, ASMS webcasts could prove<br />
useful.<br />
Such a scenario may be premature but it is not unrealistic.<br />
The location of mass spectrometers off-planet is not limited<br />
to the Viking instrument resident on the surface of Mars.<br />
Mass spectrometers have sampled the composition of other<br />
planetary atmospheres, comets, <strong>and</strong> interplanetary space<br />
itself. The need to design such instruments to meet the<br />
constraints of space <strong>and</strong> power, <strong>and</strong> to ensure robustness,<br />
has informed the development of the newest generation of<br />
mobile mass spectrometers for the rest of us. As <strong>with</strong> all<br />
design that pushes to extremes, it is a clear underst<strong>and</strong>ing of<br />
the basics that catalyzes progress. Note that the basic studies<br />
in extraterrestrial mass spectrometry (MS) extend back<br />
to the 1950s <strong>and</strong> 1960s. The designers of such instruments<br />
also had unique approaches to creating <strong>and</strong> maintaining a<br />
vacuum in the instrument. Creating a vacuum may be as<br />
simple as opening a port to space in transit. Maintaining<br />
a vacuum during descent through a planetary atmosphere<br />
requires careful consideration of the pressures that may<br />
be encountered, the composition of the gases encountered<br />
(these were in fact what was to be measured), <strong>and</strong> gas conductances<br />
<strong>with</strong>in the system <strong>and</strong> through its ports. Perhaps<br />
the design would consider a control parameter involving
18 <strong>Spectroscopy</strong> 24(11) November 2009<br />
www.spectroscopyonline.com<br />
pressure measurements taken on-site,<br />
<strong>with</strong> the readings fed into a system<br />
that makes decisions on the fly. These<br />
complex topics deserve a more detailed<br />
exposition, which will appear in this<br />
column eventually. Until then, <strong>and</strong> to<br />
return to Earth orbit, interested readers<br />
might learn about the Wake Shield<br />
Facility (described at http://www.svec.<br />
uh.edu/wsfp.html), which takes advantage<br />
of the excellent vacuum available<br />
in the wake of the space shuttle.<br />
Earlier columns in “Mass Spectrometry<br />
Forum” covered general topics<br />
of vacuum systems (as well as our<br />
sometimes confusing uses of the terms<br />
vacuum <strong>and</strong> pressure), <strong>and</strong> the operation<br />
of high vacuum pumps (1,2). Here,<br />
to keep things simple, we will call any<br />
pressure below 1 atmosphere (760<br />
Torr) a vacuum. There are subsidiary<br />
terms of rough vacuum, low vacuum,<br />
high vacuum, <strong>and</strong> ultrahigh vacuum,<br />
<strong>with</strong> such terms corresponding, in<br />
order, to lower <strong>and</strong> lower pressures.<br />
The pressure in interstellar space, by<br />
the way, is about 10 -16 Torr, <strong>and</strong> the<br />
pressure <strong>with</strong>in interplanetary space<br />
higher (depending upon where you<br />
are). These are isotropic gas pressures,<br />
<strong>and</strong> the fact that the interstellar pressure<br />
is so low is one reason why radiation<br />
pressure can be used to exert a<br />
force upon solar sails.<br />
The focus of this column is the<br />
measurement of pressure in a mass<br />
spectrometer, located somewhere on<br />
the surface of planet Earth (+/- 5 km)<br />
(3). The continued growth <strong>and</strong> diversification<br />
of MS should refocus our<br />
attention on the attainment of vacuum<br />
<strong>and</strong> the accurate measurement of pressures.<br />
At the heart of MS is the ability<br />
to create ions, to move them around,<br />
to differentiate them by their mass-tocharge<br />
ratios, <strong>and</strong> to detect them. For<br />
years, <strong>and</strong> certainly through the dominant<br />
era for electron ionization (EI)<br />
<strong>and</strong> chemical ionization (CI) sources,<br />
we thought of the MS instrument<br />
as under high vacuum from source<br />
through to the detector. We also came<br />
to know the vacuum pumping system<br />
as a high-cost, high-maintenance part<br />
of the instrument. Certainly, pumping<br />
systems evolved from the crude apparatus<br />
first used by Aston in his<br />
Source<br />
Inlet<br />
Ionization gauge<br />
Analyzer<br />
Diffusion pump<br />
Thermocouple gauge<br />
Rough<br />
pump<br />
Detector<br />
vent<br />
Figure 1: Simple diagram of placement of a thermocouple gauge (bottom) <strong>and</strong> an ionization<br />
gauge (top) on a generic mass spectrometer.<br />
Table I: Usual operational range for some common pressure gauges used<br />
in mass spectrometers.<br />
Device name<br />
Usual operational range (Torr)<br />
(760 Torr is 1 atmosphere of pressure)<br />
Mechanical gauge (various sorts) 1000 to 100<br />
Piezo or quartz sensor 760 to 1<br />
Capacitance manometer 1000 to 10 -3<br />
Thermocouple gauge 760 to 10 -3<br />
Ionization gauge 10 -4 to 10 -8<br />
parabola mass spectrographs, but the<br />
consistent general model was a highvacuum<br />
diffusion pump (or two) for<br />
the main system to achieve a high vacuum,<br />
<strong>with</strong> associated backing pumps<br />
(the rough pumps) that also could be<br />
plumbed into source interfaces for separators<br />
or direct insertion probes. Most<br />
pumps (including diffusion pumps<br />
<strong>and</strong> rotary vane backing pumps) transport<br />
gas molecules against a pressure<br />
gradient, so the ultimate exhaust for<br />
the backing pumps should be a hood<br />
vented to outside. The advent of reliable<br />
turbomolecular pumps did not<br />
shift the basic design of the pumping<br />
systems in our instruments, but added<br />
certain advantages of speed <strong>and</strong> pump<br />
placement. The basic goal still was to<br />
move the gas molecules from inside the<br />
system to outside of it.<br />
Within this general scheme, much of<br />
the plumbing intricacy of the vacuum<br />
pumping system was designed for the<br />
ionization source of the mass spectrometer,<br />
<strong>and</strong> the need to transport
www.spectroscopyonline.com<br />
samples from the outside world (760<br />
Torr) into the mass spectrometer<br />
(where the analyzer is at 10 -6 Torr).<br />
For example, a direct insertion probe<br />
would be fitted <strong>with</strong> a staged series of<br />
chambers, valves, <strong>and</strong> locks so that discrete<br />
samples at the laboratory pressure<br />
could be introduced safely into the 10 -5<br />
Torr EI source, or the 1 Torr CI source.<br />
Jet separators <strong>and</strong> membrane interfaces,<br />
<strong>and</strong> various other devices, were<br />
early interface devices that transported<br />
a stream of sample molecules from<br />
the exit of a gas chromatography (GC)<br />
system to those same under-vacuum<br />
sources, while pumping away most of<br />
the carrier gas <strong>and</strong> thereby enriching<br />
the concentration of sample. For liquid<br />
chromatography (LC), an even wider<br />
diversity of interface systems was de<strong>vis</strong>ed<br />
because the evaporation of the<br />
LC solvent placed an even greater load<br />
on the vacuum-pumping system, <strong>and</strong><br />
in the beginning at least, the ionization<br />
source was still operating at a pressure<br />
far below atmospheric pressure. Now,<br />
ionization sources operate at pressures<br />
above atmospheric pressure, <strong>and</strong> commonly<br />
at ambient pressure, such as<br />
electrospray ionization (ESI) sources,<br />
along <strong>with</strong> ambient sampling methods,<br />
<strong>and</strong> the problems of designing a successful<br />
interface are somewhat eased.<br />
At the other extreme, sources in surface<br />
science experiments may operate<br />
at pressures as low as 10 -9 Torr, <strong>and</strong> the<br />
idea of a chemical ionization reagent<br />
gas at 1 Torr pressure is anathema.<br />
Mass analyzers, however, still usually<br />
operate <strong>with</strong>in the pressure range of<br />
10 -5 to 10 -7 Torr, <strong>with</strong> the notable exception<br />
of the ion trap.<br />
Instrument operators have to be<br />
aware of what pressure regime is<br />
proper for each part of a more complicated<br />
instrument, <strong>and</strong> measure <strong>and</strong><br />
monitor those pressures for optimum<br />
<strong>and</strong> stable instrument operation. A<br />
rule-of-thumb in practical troubleshooting<br />
for erratic or deteriorating<br />
instrument operation is to “check the<br />
vacuum first.” The reason is explained<br />
directly in a short commercial publication<br />
about the need for accuracy in low<br />
pressure measurements (4): “But when<br />
it comes to high vacuum measurement,<br />
accuracy seems not to matter.<br />
We speak of being in “the 6 range” or<br />
in “the low part of the 8 range.” We<br />
seem to ignore the fact that the 6 range,<br />
that is, the pressure difference between<br />
1 X 10 -6 <strong>and</strong> 1 X 10 -5 Torr, involves<br />
a change in gas density of 10 times.<br />
We seem to think it is unimportant<br />
whether we are at 2 X 10 -8 or 1 X 10 -8<br />
Torr: “Not to worry. It’s okay. We’re in<br />
the 8 range.” Why does it matter if we<br />
pump to 2 X 10 -8 rather than to 1 X<br />
10 -8 Torr? At the higher pressure, we<br />
will have twice the density of molecules<br />
November 2009 <strong>Spectroscopy</strong> 24(11) 19<br />
present as at the lower pressure. If this<br />
presents no problem, why then are we<br />
spending time <strong>and</strong> money pumping<br />
to a lower pressure than required? If<br />
a pressure of 2 X 10 -8 Torr is satisfactory,<br />
could we use 3 X 10 -8 Torr <strong>and</strong><br />
save some pumping time? After all,<br />
nature abhors a vacuum, <strong>and</strong> reducing<br />
the pressure by a factor of two or more<br />
does not come free.” If the apparent<br />
sensitivity of an MS instrument is off<br />
10–15%, or seems to vary erratically,<br />
a “small” change in pressure in the
20 <strong>Spectroscopy</strong> 24(11) November 2009 www.spectroscopyonline.com<br />
mass analyzer may be the cause. The<br />
author of this quote addresses the need<br />
for accurate pressure measurement in<br />
a vacuum chamber used for materials<br />
processing, but the lesson is valuable.<br />
For the mass spectrometer, scattering<br />
collisions reduce ion transmission,<br />
<strong>and</strong> reduce instrument sensitivity. A<br />
“small” change in pressure can lead<br />
to an amplified degradation in performance.<br />
Pumps “burp” for various<br />
reasons, <strong>and</strong> the short pressure surge<br />
takes time to dissipate. Erratic instrument<br />
performance may be your only<br />
clue if you are not carefully monitoring<br />
the pressure. The author may be the<br />
only mass spectrometrist in the world<br />
who would become concerned <strong>with</strong> a<br />
shift in measured base pressure from<br />
2 X 10 -6 to 3 X 10 -6 Torr, but now you<br />
know why.<br />
Performance of the vacuum pumping<br />
system of a mass spectrometer<br />
is monitored through measurement<br />
of the pressure at various points in<br />
the system. These measured pressures<br />
may or may not be logged into<br />
the automated control system of the<br />
mass spectrometer. In process vacuum<br />
chambers, system pressures certainly<br />
are recorded so that the conditions of<br />
materials processing are known precisely.<br />
But in analytical mass spectrometers,<br />
pressure measurement is often<br />
manually monitored. Consider Figure<br />
1, which is a schematic of a diffusion<br />
pump attached to the main vacuum<br />
chamber, supported by the backing<br />
pump (also known as the rough pump),<br />
<strong>with</strong> the system exhaust routed to a<br />
hood. Pressures <strong>with</strong>in the backing<br />
pump lines are monitored (using the<br />
thermocouple gauge) as an indicator of<br />
the total gas load on the system, <strong>and</strong> to<br />
ensure that the main diffusion pump is<br />
properly supported. The main chamber<br />
pressure is monitored <strong>with</strong> the<br />
ionization gauge. The diffusion pump<br />
can operate for a short time at higher<br />
backing pressures, but prolonged operation<br />
leads inevitably to a rise in main<br />
system pressure <strong>and</strong> a degradation of<br />
the pumping fluid. In a simple EI mass<br />
spectrometer, monitoring the two pressures<br />
(the backing pump line thermocouple<br />
gauge <strong>and</strong> the main chamber<br />
ionization gauge) usually is sufficient<br />
for reassurance that the instrument<br />
was properly pumped.<br />
Details of how each measurement<br />
device works are explored in specialized<br />
texts (5–8) <strong>and</strong> commercial manufacturer’s<br />
applications notes, reflecting<br />
the broad application of vacuum<br />
science outside of MS. We concentrate<br />
here on the thermocouple gauge <strong>and</strong><br />
the ionization gauge, because these are<br />
the most common devices found on<br />
mass spectrometers, usually configured<br />
approximately as shown in Figure<br />
1. Table I shows the operational pressure<br />
range for the thermocouple gauge<br />
<strong>and</strong> for the ionization gauge, <strong>and</strong> a few<br />
other devices included for comparison.<br />
Performance of<br />
the vacuum<br />
pumping<br />
system of a mass<br />
spectrometer is<br />
monitored through<br />
measurement of<br />
the pressure at<br />
various points in<br />
the system.<br />
Note that in addition to monitoring<br />
the pressure in the backing lines, thermocouple<br />
gauges also can be used to<br />
monitor vacuum pressures in sample<br />
introduction interfaces. Note that for<br />
sources that operate at atmospheric<br />
pressure, the ambient pressure usually<br />
is not measured. We emphasize in this<br />
column three basic issues relevant to<br />
the vacuum pumping system in a mass<br />
spectrometer. First, the vacuum gauge<br />
produces an electrical output that can<br />
be related to pressure through a calibration,<br />
<strong>and</strong> not all residual gas mixtures<br />
follow the same calibration curve.<br />
Second, the pressure measured is the<br />
pressure at the gauge, not necessarily in<br />
the system, <strong>and</strong> so we have to consider<br />
conductance. Third <strong>and</strong> finally, proper<br />
vacuum-pumping system care<br />
maintains instrument performance.<br />
Calibration: Like any transducer,<br />
a vacuum gauge must be calibrated.<br />
In MS, that calibration entails some<br />
special issues. The composition of a gas<br />
mixture at Earth atmospheric pressure<br />
contains an expected mix of nitrogen,<br />
oxygen, water, carbon dioxide, argon,<br />
<strong>and</strong> some trace components. Does this<br />
mixture change in its relative composition<br />
as a pump lowers the pressure in<br />
a vacuum chamber? It most certainly<br />
does, because various pumps may act<br />
to pump one gas component more effectively<br />
than another. Thus the composition<br />
of that starting gas mixture<br />
at 10 -3 Torr will be slightly different<br />
from the composition at atmosphere,<br />
even more different at 10 -6 Torr, <strong>and</strong><br />
vastly different at 10 -9 Torr. For the<br />
pressure-measuring devices, a calibration<br />
should be completed so that the<br />
electrical output can be related to the<br />
actual pressure, <strong>and</strong> the calibration<br />
must factor in the composition of the<br />
gas. Any device reacts to different gases<br />
<strong>with</strong> a different sensitivity, <strong>and</strong> thus<br />
exhibits a different calibration curve.<br />
A thermocouple gauge that measures<br />
1 Torr of pressure when the composition<br />
is residual atmospheric gases will<br />
be slightly different in response from<br />
a thermocouple gauge reading 1 Torr<br />
of methane in a CI source. Many commercial<br />
companies offer calibration<br />
services for vacuum gauges. In MS,<br />
traceability to a NIST or other national<br />
st<strong>and</strong>ard is not usually necessary. NIST<br />
calibration is described in detail in<br />
publications available on the web (9,10).<br />
Conductance: The connection of<br />
a vacuum gauge to the mass spectrometer<br />
deserves some discussion.<br />
Consider the two situations depicted<br />
in Figure 1 for a thermocouple gauge<br />
<strong>and</strong> for an ionization gauge. The thermocouple<br />
gauge is connected directly<br />
into the vacuum line, <strong>and</strong> many gauges<br />
are built into threaded assemblies for<br />
such a purpose. We can be assured<br />
that the pressure measured by the<br />
thermocouple gauge is the pressure in<br />
the line because of this direct connection.<br />
On the other h<strong>and</strong>, consider the<br />
connection of an ionization gauge to<br />
the main vacuum chamber of a mass<br />
spectrometer. Sometimes the glass-en-
www.spectroscopyonline.com<br />
November 2009 <strong>Spectroscopy</strong> 24(11) 21<br />
closed ionization gauge is found in a T<br />
configuration equipped <strong>with</strong> a bolted<br />
vacuum machine flange. This vacuum<br />
flange is then bolted to the receiving<br />
flange teed off the main chamber.<br />
We want to know the pressure in the<br />
main chamber, but what we actually<br />
measure is the pressure at the gauge,<br />
which is related to the pressure in the<br />
chamber through the conductance of<br />
the connection. As a rule, instrument<br />
design should maximize conductance<br />
between the vacuum gauge <strong>and</strong> the<br />
chamber. For example, large diameter<br />
connections have better conductance<br />
than do smaller-diameter connections,<br />
<strong>and</strong> curved 90° bends have better conductance<br />
than do right-angle bends.<br />
To minimize possible issues of conductance,<br />
a direct mounting of the gauge<br />
is available <strong>with</strong> the use of a “nude” ion<br />
gauge. Here the analyst must be aware<br />
of the ionic <strong>and</strong> photonic emission of<br />
the gauge itself, as well as its fragility.<br />
Care: A vacuum pumping system<br />
does not thrive on neglect, but this<br />
author’s experience is that few currently<br />
practicing mass spectrometrists<br />
receive basic education in vacuum<br />
science. For example, a proper pumpdown<br />
technique (11,12) is part of the<br />
necessary care of a vacuum system<br />
<strong>and</strong> requires more attention than<br />
usually documented. Additionally, a<br />
good maintenance schedule includes,<br />
for example, attention to air filters,<br />
water filters, exhaust filters, flushing of<br />
water lines, pump oil replacement <strong>and</strong><br />
proper disposal, seals testing, leak testing,<br />
replacements for degraded seals<br />
<strong>and</strong> hoses, <strong>and</strong> general system cleanliness.<br />
Pumps sited away from the mass<br />
spectrometer for purposes of noise<br />
abatement or vibration isolation are<br />
especially likely to fall off the maintenance<br />
schedule. “Bake-out” is a term<br />
that is not much used anymore, <strong>and</strong> it<br />
is doubtful that the reasons for completing<br />
one are still known. Finally,<br />
while source ionization cleanliness<br />
usually is acknowledged to be vital for<br />
good instrument performance, the<br />
cleanliness of the rest of the system<br />
(comprising the preponderance of<br />
surface area for the vacuum system)<br />
rarely is considered. Maintenance is<br />
not the most pleasant work of the MS<br />
laboratory, but it is one of the more<br />
important ones. Let the author know if<br />
you have assembled a workable reward<br />
structure that results in proper maintenance<br />
— “beer <strong>and</strong> pizza” will not be<br />
considered an adequate response.<br />
Good vacuum system design is a<br />
crucial underpinning for high performance<br />
instrumentation. In “Mass<br />
Spectrometry Forum,” our range of<br />
topics is extraordinarily broad, ranging<br />
from the basics of electronic <strong>and</strong><br />
vacuum technology through to the<br />
ethical use of MS data. The important<br />
aspects of pressure <strong>and</strong> vacuum need<br />
regular teaching, <strong>and</strong> we will return<br />
to additional topics in these areas in<br />
future columns.<br />
References<br />
(1) K.L. Busch, <strong>Spectroscopy</strong> 15(9), 22<br />
(2000).<br />
(2) K.L. Busch, <strong>Spectroscopy</strong> 16(5), 14,<br />
(2001).<br />
(3) There are mass spectrometers that<br />
operate in the undersea environment,
22 <strong>Spectroscopy</strong> 24(11) November 2009 www.spectroscopyonline.com<br />
<strong>and</strong> also instruments that operate in<br />
the lower reaches of the atmosphere.<br />
Interfaces will differ, of course, but<br />
the basic pumping needs <strong>with</strong>in the<br />
instrument itself remain similar. Outside<br />
that range, design considerations<br />
diverge.<br />
(4) Granville-Phillips, Issues in Vacuum<br />
Measurement, “It’s a Myth that<br />
Less Accuracy is Needed for Low-<br />
Pressure Measurement.” Found at<br />
http://www.brooks.com/documents.<br />
cfm?documentID=4879.<br />
(5) K. Jousten, H<strong>and</strong>book of Vacuum<br />
Technology (Wiley-VCH, New York,<br />
New York, 2008).<br />
(6) J.F. O’Hanlon, A User’s Guide to<br />
Vacuum Technology (John Wiley <strong>and</strong><br />
Sons, Hoboken, New Jersey, 2003).<br />
(7) D.J. Hucknall <strong>and</strong> A. Morris, Vacuum<br />
Technology: Calculations in Chemistry,<br />
(Royal Society of Chemistry, UK,<br />
2003).<br />
(8) A very useful compendium of vacuum<br />
technology references is found at:<br />
http://www.atomwave.<br />
org/rmparticle/ao%20refs/<br />
aifm%20refs%20sorted%20by<br />
%20topic/beam%20detectors/<br />
Vacuum%20References.doc.<br />
(9) S. Dittmann, “NIST Measurement<br />
Services: High Vacuum St<strong>and</strong>ard <strong>and</strong><br />
Use, 1989.” Found at http://ts.nist.<br />
gov/MeasurementServices/Calibrations/upload/SP250-34.pdf<br />
(10) J.H. Hendricks , P.J. Abbott, J.E.<br />
Ricker, J.H. Chow, <strong>and</strong> J.D. Kelley,<br />
“Development of a New NIST Calibration<br />
Service Using the Comparison<br />
Method for Vacuum Gauges Spanning<br />
the Range 0.65 Pa to 133 kPa,” found<br />
at www.cstl.nist.gov/projects/fy06/<br />
indst0683608.pdf.<br />
(11) See http://www.vacuumlab.com/Articles/VacLab32.pdf.<br />
(12) See http://www.plasma.org/activity/<br />
groups/subject/vac/Events_Archive/<br />
file_8392.ppt.<br />
Kenneth L. Busch<br />
grew up in the era of<br />
belt-driven rough pumps.<br />
KLB always remembers to<br />
put a leak tray under his<br />
rough pumps, he knows<br />
what a sight glass is, <strong>and</strong><br />
he knows the chemical molecular composition<br />
of many diffusion pump oils. In his<br />
youth, <strong>with</strong> a steadier h<strong>and</strong>, he could replace<br />
filaments in nude ionization gauges.<br />
Extra bonus points <strong>with</strong> no redeemable<br />
cash value are sent via email to those who<br />
deduce the pun not quite hidden in this<br />
column. No hints provided. Responsibility<br />
for this column resides solely <strong>with</strong> the author,<br />
who can be reached at:<br />
wyvernassoc@yahoo.com<br />
For more information on<br />
this topic, please <strong>vis</strong>it:<br />
www.spectroscopyonline.com/busch
23 <strong>Spectroscopy</strong> 24(11) November 2009 www.spectroscopyonline.com<br />
Focus on Quality<br />
The Tiger Has Sharp New Teeth<br />
The new FDA Commissioner wants a strong FDA <strong>and</strong> is backing her words <strong>with</strong> action by initiating<br />
a program that cuts the time that firms must respond to 483 observations from 30 to<br />
15 business days. Not only is the time halved but the response must be complete. Therefore<br />
it is better <strong>and</strong> cheaper to be compliant than not.<br />
R.D. McDowall<br />
The Food <strong>and</strong> Drug Administration (FDA) has not had<br />
good press over the last few years, as they have been on<br />
the receiving end of two critical reports from the Government<br />
Audit Office (GAO). The last report covered the<br />
FDA foreign inspection program <strong>and</strong> was damning in the<br />
fact that the FDA does not know how many establishments<br />
it has to inspect, relies upon volunteers to inspect overseas,<br />
<strong>and</strong> when they do conduct inspections, the frequency is<br />
lower than in the U.S. (1).<br />
FDA Modernization Act 2009<br />
As a result of this report <strong>and</strong> also the increased threat of<br />
supply chain contamination, the FDA Modernization Act<br />
2009 (2) is being passed into law <strong>and</strong> covers the following<br />
areas:<br />
• Creates an up-to-date registry of all drug <strong>and</strong> device facilities<br />
serving American consumers.<br />
• Increases funding for more GMP inspections for ethical<br />
<strong>and</strong> generic drugs as well as introduces preapproval inspections<br />
for generic drugs.<br />
• Requires parity between foreign <strong>and</strong> domestic inspections,<br />
<strong>and</strong> to meet this, the FDA is setting up offices in<br />
China, India, Europe, <strong>and</strong> Latin America.<br />
• Denies entry to drugs coming from facilities that limit,<br />
delay, or deny FDA inspections.<br />
• Requires manufacturers to know their supply chain including<br />
the identification <strong>and</strong> mitigation of risk throughout<br />
their supply chain.<br />
• Requires country-of-origin labeling for components.<br />
Concomitantly, there also has been an increase in budget<br />
to fund this <strong>and</strong> increase the inspection program. So what<br />
does that mean for me in the laboratory? This stuff appears<br />
to be too high a level to even contemplate doing anything<br />
about. What’s this about a tiger <strong>and</strong> new teeth? It may seem<br />
that the tiger has been stuffed but the good bits start in the<br />
next section.<br />
New FDA Commissioner Acts<br />
In addition to the FDA Modernization Act 2009, there also<br />
has been a change at the top <strong>with</strong> the appointment of Dr.<br />
Margaret Hamburg as the new FDA commissioner in May<br />
2009. On August 6, 2009, the new commissioner made a<br />
speech that emphasized the need for a “strong FDA,” which<br />
highlighted the benefits of this new approach as having<br />
credibility <strong>with</strong> the public, being transparent in explaining<br />
its decisions, being able to enforce the law, <strong>and</strong> being creative<br />
in promoting health. In this speech, <strong>with</strong> an accompanying<br />
video (3), were such quotations as<br />
• “Through regular inspections <strong>and</strong> follow-up on signals<br />
indicating problems, the FDA must work to identify <strong>and</strong> resolve<br />
problems early.”<br />
• “Companies must have a realistic expectation that if<br />
they are crossing the line, they will be caught, <strong>and</strong> that if<br />
they fail to act, we will.”<br />
• “The agency must show industry <strong>and</strong> consumers that we<br />
are on the job. We must publicize our enforcement actions<br />
— <strong>and</strong> the rationale for those actions — widely <strong>and</strong><br />
effectively.”
24 <strong>Spectroscopy</strong> 24(11) November 2009 www.spectroscopyonline.com<br />
• “The agency must place greater<br />
emphasis on significant risks <strong>and</strong> violations,<br />
<strong>and</strong> use meaningful penalties<br />
to send a strong message to discourage<br />
future offenses.”<br />
The strong message coming through<br />
loud <strong>and</strong> clear is be compliant <strong>and</strong><br />
remain compliant <strong>with</strong> the regulations<br />
— or else. You’ll now see that the tiger,<br />
far from being ready for the taxidermist,<br />
is starting to sharpen its teeth.<br />
Not only does this apply to the<br />
here-<strong>and</strong>-now but also, as noted in the<br />
final bullet point, the commissioner<br />
wants to discourage future offences.<br />
So why change the FDA approach to<br />
enforcement? One of the rationales for<br />
this was mentioned in the speech as<br />
the pathways for enforcement action<br />
can be too long <strong>and</strong> arduous when the<br />
public’s health is in jeopardy. So from<br />
this <strong>and</strong> the FDA, we must infer that<br />
the FDA will be increasing inspections<br />
while tightening up <strong>and</strong> speeding up<br />
enforcement actions.<br />
Thus. it was not surprising that the<br />
FDA announced in the Federal Register<br />
of August 11 (4) the trial of a new<br />
program entitled “Review of Post-Inspection<br />
Responses.” The purpose of<br />
this program is to facilitate the timely<br />
issuance of warning letters that started<br />
on September 15, 2009 <strong>and</strong> will run for<br />
18 months (the tiger has just come back<br />
from the dentist <strong>and</strong> is feeling hungry<br />
— are you getting the message?).<br />
Issues <strong>with</strong> the Current<br />
Inspection Process<br />
Before we look in detail at the inspection<br />
goodies coming your way, I would<br />
just like to step back <strong>and</strong> review what<br />
happened before implementation of<br />
this new program. FDA inspections<br />
come in three flavors <strong>and</strong> will continue<br />
to do so:<br />
• Facility inspection: routine inspection<br />
of the facility <strong>and</strong> the six areas<br />
quality — however, we will just focus<br />
on the quality system <strong>and</strong> the laboratory<br />
in this column.<br />
• Preapproval inspection (PAI): inspection<br />
of the manufacturing facility<br />
for a new drug or a generic drug before<br />
licensing.<br />
• For cause inspection: either there<br />
is a public health issue that must be<br />
Late<br />
response<br />
Establishment<br />
Inspection<br />
Report (EIR)<br />
Regulatory<br />
action<br />
stopped<br />
Adequate<br />
response<br />
rapidly investigated or a whistleblower<br />
has alerted the agency. In either case,<br />
the first thing you’ll probably notice is<br />
the knock of the inspection team at the<br />
front door of your site.<br />
Regardless of the inspection type,<br />
the inspection follows the same format<br />
<strong>and</strong> begins <strong>with</strong> the inspectors<br />
FDA inspection<br />
483<br />
observations<br />
15 days<br />
Response<br />
letter<br />
Inadequate response<br />
Warning<br />
letter<br />
15 days<br />
Response<br />
letter<br />
Inspection<br />
follow-up<br />
Closeout<br />
letter<br />
Serious<br />
violations<br />
Figure 1: Process flow of the new FDA postinspection response program.<br />
Serious<br />
violations<br />
Further<br />
enforcement<br />
action<br />
presenting their credentials <strong>and</strong> a copy<br />
of FDA Form 482, which is the notice<br />
of inspection, at the opening meeting.<br />
During the inspection, they may notice<br />
noncompliances <strong>and</strong> these are documented<br />
on FDA Form 483 entitled<br />
“Inspectional Observations” (this is<br />
the dreaded 483!), which is given to the
www.spectroscopyonline.com<br />
November 2009 <strong>Spectroscopy</strong> 24(11) 25<br />
company at the closing meeting of the<br />
inspection. Written on each page of<br />
Form 483 is the following wording:<br />
“This document lists observations<br />
made by the FDA representative during<br />
the inspection of your facility.<br />
They are inspectional observations,<br />
<strong>and</strong> do not represent a final agency<br />
determination regarding your compliance.”<br />
The company currently has 30<br />
working days to respond to the 483 but<br />
what happens in practice is that a first<br />
response is presented <strong>with</strong>in the time<br />
limit <strong>and</strong> then further letters are fed in<br />
over a few months for the more serious<br />
issues. If you read some of the warning<br />
letters on the FDA website, you’ll see if<br />
the inspection occurred in January, the<br />
warning letter finally emerges into the<br />
light 6–9 months later. The reason for<br />
this is that there has been protracted<br />
correspondence between the company<br />
<strong>and</strong> the FDA. This will stop under the<br />
new program.<br />
Warning letters are only issued for<br />
significant violations from the regulations.<br />
After the warning letter has been<br />
sent out to the company, a copy is hung<br />
on the “Wall of Shame” in the warning<br />
letter section of the FDA’s website.<br />
Here anyone can have a good laugh<br />
about the problems of another company<br />
while secretly hoping that they<br />
will not have a starring role in a future<br />
warning letter. The response time for<br />
the company to respond to a warning<br />
letter is 15 working days; in the new<br />
program, this also will be the response<br />
time for a 483.<br />
Regardless of whether you get a<br />
483 or not, the FDA inspectors will<br />
write a detailed Establishment Inspection<br />
Report (EIR) of the inspection<br />
that details the people they had talks<br />
<strong>with</strong> <strong>and</strong> the procedures, systems,<br />
<strong>and</strong> records that were inspected; this<br />
document provides the agency <strong>with</strong><br />
its elephant’s memory. Failure to correct<br />
the noncompliances outlined in<br />
a warning letter may lead to further<br />
enforcement action by the FDA, <strong>and</strong><br />
ignoring a warning letter is not ad<strong>vis</strong>able.<br />
However, the agency has often<br />
issued further warning letters to companies<br />
in the past, a practice that will<br />
apparently stop <strong>with</strong> the new program.<br />
Further regulatory enforcement by the<br />
FDA can include a consent decree of<br />
permanent injunction, which will bind<br />
the company in perpetuity to comply<br />
<strong>with</strong> the regulations; this can cost a<br />
company millions of dollars or even its<br />
existence or <strong>with</strong>drawing a product licence.<br />
For foreign companies, the FDA<br />
can ban import of its products.<br />
483 Complaints Procedure<br />
Under the “GMP for the 21st Century”<br />
initiative, the FDA issued a guidance<br />
for industry <strong>with</strong> a delightful title of<br />
“Formal Dispute Resolution: Scientific<br />
<strong>and</strong> Technical Issues Related to Pharmaceutical<br />
CGMP” (5). In essence, this<br />
document encourages the company<br />
<strong>and</strong> the inspector to discuss <strong>and</strong> resolve<br />
everything while the inspection<br />
is still ongoing. However, if this is not<br />
possible, only <strong>with</strong> regard to observations<br />
where it is down to interpretation<br />
is a company allowed to appeal to the<br />
FDA in a formal, two-tiered response.<br />
For example, if you don’t keep<br />
complete records of a spectroscopic<br />
analysis, you will not have a leg to<br />
st<strong>and</strong> on as the regulations explicitly<br />
require you to do this. Here you are<br />
noncompliant <strong>and</strong> you have been<br />
caught — no discussion <strong>and</strong> no argument.<br />
In contrast, if the regulations are<br />
vague <strong>and</strong> it is down to differences of<br />
interpretation between the company<br />
<strong>and</strong> the inspector, then this is where<br />
the dispute procedure can be used.<br />
Postinspection Response<br />
Program<br />
So what has changed <strong>with</strong> this new<br />
program? Two changes that will impact<br />
laboratories is that a very short<br />
timeframe is being put around how<br />
quickly firms must respond to 483<br />
observations, <strong>and</strong> the second is that<br />
there will be a formal close out of<br />
warning letters to demonstrate that<br />
the noncompliances listed there have<br />
been resolved. So let’s look in detail at<br />
what you have to do <strong>and</strong> you will now<br />
see that the tiger has sharp new teeth<br />
<strong>and</strong> that they will be sinking into your<br />
flesh. Figure 1 shows the process as a<br />
diagram <strong>and</strong> readers should look at<br />
this to put the text below into context.
26 <strong>Spectroscopy</strong> 24(11) November 2009 www.spectroscopyonline.com<br />
• FDA has now set postinspection<br />
deadlines for responses by organizations.<br />
The response time for firms to<br />
respond has been halved to 15 working<br />
days. This is not just to send a letter<br />
to begin a cozy correspondence <strong>with</strong><br />
the agency but to have a complete<br />
response to all the 483 observations.<br />
If the compliance problems are significant,<br />
the timeframe for the response is<br />
critical <strong>and</strong> the response must be full,<br />
adequate, <strong>and</strong> complete. The letter will<br />
not be able to show that the problems<br />
have been resolved for all but the simplest<br />
observations but will demonstrate<br />
how they will be resolved <strong>and</strong> in what<br />
timeframe. If a response is not received<br />
in this time or the response is inadequate,<br />
then the agency can start work<br />
on a warning letter or other enforcement<br />
action. We’ll take a look at ways<br />
to respond to a 483 or warning letter in<br />
a later section of this column.<br />
An important point to underst<strong>and</strong><br />
here is that the FDA now takes the<br />
systems-based approach to inspections<br />
<strong>and</strong> coupled <strong>with</strong> ICH Q10 on<br />
pharmaceutical quality systems (6)<br />
you will need a different approach to<br />
respond to 483 observations. If there<br />
is an observation that has an impact<br />
outside of the area inspected, you will<br />
be expected to fix it as part of the systems-based<br />
approach. Remember, the<br />
wording at the end of virtually every<br />
warning letter on the FDA website:<br />
“this letter is not intended to be an<br />
all-inclusive list of the violations at<br />
your facility. It is your responsibility<br />
to ensure compliance <strong>with</strong> applicable<br />
laws <strong>and</strong> regulations administered by<br />
FDA.” However, there is an onus on<br />
the inspector to discuss findings <strong>with</strong><br />
management to minimize surprises<br />
<strong>and</strong> errors when issuing the 483 at the<br />
inspection closing meeting.<br />
• The warning letter issuing process<br />
is being streamlined <strong>and</strong> speeded<br />
up by the FDA. Instead of the FDA<br />
lawyers reviewing all warning letters,<br />
only those where there are significant<br />
legal issues will now get the legal eagle<br />
eye. The agency will not delay issuing<br />
a warning letter if you are late in<br />
responding to the 483. Even if your<br />
response to the 483 is perfect, the FDA<br />
does “not plan to routinely include a<br />
response on the apparent adequacy<br />
of the firm’s corrective actions in the<br />
warning letter (4).” Instead, the agency<br />
will respond to evaluate both your<br />
response to the 483 <strong>and</strong> the warning<br />
letter together. Therefore, the message<br />
is clear to all: Your 483 response must<br />
be timely <strong>and</strong> complete, or else you<br />
could end up <strong>with</strong> a warning letter on<br />
the front doormat pretty quickly afterwards.<br />
• Next, the FDA will prioritize<br />
enforcement follow-up. After a warning<br />
letter is issued or a major product<br />
recall occurs, the FDA will make it a<br />
priority to follow up promptly <strong>with</strong><br />
appropriate action, such as an inspection<br />
or investigation to assess whether<br />
or not a company has made required<br />
changes in its compliance practices.<br />
• In the past, it was not uncommon<br />
for a company to have a number<br />
of warning letters after several inspections;<br />
it may be the companies
www.spectroscopyonline.com<br />
November 2009 <strong>Spectroscopy</strong> 24(11) 27<br />
involved thought that they could<br />
manage the warning letters, the FDA,<br />
<strong>and</strong> still do business. However, under<br />
this new program, the agency will<br />
not issue multiple warning letters<br />
like confetti to noncompliant firms<br />
before taking greater enforcement action.<br />
The agency will move quickly<br />
<strong>and</strong> aggressively to address significant<br />
health concerns or serious violations<br />
by immediate action — even before<br />
they have issued a formal warning letter.<br />
This message is crystal clear — be<br />
compliant or there will be regulatory<br />
trouble <strong>and</strong> the FDA will move to<br />
protect public health.<br />
• In a novel approach to noncompliance,<br />
the FDA will now issue a<br />
close-out letter to companies issued<br />
warning letters to document that they<br />
have made necessary corrections. As a<br />
copy of this close-out will be posted on<br />
the FDA website alongside the warning<br />
letter, readers will be able to see<br />
how quickly companies respond to the<br />
regulator. It is hoped that this will be<br />
an important motivator for companies<br />
to fix the problem quickly.<br />
So does the FDA have sharp new<br />
teeth or are they toothless? It is your<br />
call to decide, but as a word of advice,<br />
be compliant <strong>and</strong> inspection-ready in<br />
your laboratory.<br />
Are You Inspection-Ready?<br />
Remember, the cost of compliance is<br />
always, always, cheaper than the cost<br />
of noncompliance. You can decide how<br />
to do things rather than rush through<br />
something <strong>with</strong> a regulator breathing<br />
your neck. Therefore, the easiest way<br />
to respond to a 483 observation is to be<br />
compliant <strong>and</strong> don’t get one. However,<br />
we have to manage risk in the industry<br />
<strong>and</strong> this is probably unrealistic. So,<br />
don’t get a serious 483 observation.<br />
You’ll need to have a quality system<br />
that is defendable, as this is always<br />
better than arguing <strong>with</strong> the inspector<br />
on the day of the inspection. Rather<br />
than just sit there <strong>and</strong> wait for the next<br />
inspector to drop, all staff should be<br />
vigilant <strong>and</strong> ensure that they work in a<br />
compliant manner <strong>and</strong> — this point is<br />
very important — improve the current<br />
processes <strong>and</strong> the associated compliance.<br />
This is not just a job for quality<br />
assurance personnel who conduct<br />
internal audits <strong>and</strong> document checks,<br />
it is everybody’s job. This internal effort<br />
must be coupled <strong>with</strong> an increased<br />
program of laboratory audits aimed at<br />
verifying what the real level of compliance<br />
is in your organization. It is<br />
all well <strong>and</strong> good knowing that in six<br />
months time an inspection is due <strong>and</strong><br />
that you can prepare for it. When the<br />
inspector comes around the laboratory<br />
is clean <strong>and</strong> tidy <strong>and</strong> all the staff are in<br />
their Sunday best. However, what is the<br />
reality of the day-to-day operations?<br />
Here, audits can be a very effective<br />
means to determining the real level of<br />
compliance. Not just planned audits<br />
that analytical scientists know will<br />
occur <strong>and</strong> can prepare for but unannounced<br />
audits that give the real level<br />
of compliance <strong>and</strong> inspection readiness<br />
of a laboratory. This latter type<br />
of audit can be disruptive but is a vital
28 <strong>Spectroscopy</strong> 24(11) November 2009 www.spectroscopyonline.com<br />
means of avoiding the 15-day postinspection<br />
panic that will become a<br />
feature of noncompliant organizations<br />
in the coming months. Also, from personal<br />
audit experience, it is very useful<br />
to use a digital camera to record some<br />
types of noncompliance such as untidy<br />
laboratories or missing calibration<br />
stickers on equipment as the auditee<br />
has less wiggle room when the evidence<br />
is in the report. To be effective,<br />
audits need to be conducted by trained<br />
staff external to the laboratory under<br />
audit to remove bias from the results.<br />
Responding Effectively to a 483<br />
Observation<br />
Ok, so you ignored the advice above<br />
<strong>and</strong> now you have one or more 483<br />
laboratory observations — so what are<br />
you going to do? Remember, the clock<br />
starts ticking 15 days from the closing<br />
meeting so if you want to avoid the FDA<br />
tiger taking a bite out of various portions<br />
of your anatomy, you had better<br />
start thinking <strong>and</strong> quickly. A good option<br />
is to talk through the observation<br />
<strong>with</strong> the inspector while he or she is still<br />
on site to clarify the issue <strong>and</strong> to inform<br />
the inspector what action will be taken<br />
to resolve the problem. This should help<br />
you underst<strong>and</strong> the problem <strong>and</strong> to get<br />
feedback if this is a way to bring you<br />
back into compliance.<br />
The response to the agency must be<br />
formal <strong>and</strong> that is typically <strong>with</strong> a covering<br />
letter written at a minimum by<br />
the site head or better still by the chief<br />
executive officer. This is intended to<br />
demonstrate to the FDA how seriously<br />
the firm takes the situation <strong>and</strong> that it<br />
also provides a written commitment to<br />
comply voluntarily.<br />
This will be coupled <strong>with</strong> the attachments<br />
discussing how the company will<br />
resolve the inspection observations.<br />
The documents may be sent initially<br />
by fax or e-mail but it always should be<br />
followed up <strong>with</strong> a hard copy couriered<br />
to the field office. To write the attachments,<br />
you will need to gather the experts<br />
in the organization who will help<br />
draft the response to specific observations.<br />
Also, you should know when you<br />
have to obtain external expertise to help<br />
you. This is especially important <strong>with</strong><br />
the new program, as you only have a<br />
maximum of 15 days before the time<br />
limit is up <strong>and</strong> external resources may<br />
need time to mobilize. The attachments<br />
will detail how you will resolve each of<br />
the observations or noncompliances. It<br />
is extremely important that these are<br />
laid out clearly: therefore, address each<br />
observation at the beginning of a new<br />
page. Ensure also that the response<br />
numbering is the same as the observation<br />
numbering in the 483. This makes<br />
it easier for the official at the FDA to<br />
correlate the material (remember your<br />
reader!).<br />
For each observation:<br />
• Do you agree or disagree <strong>with</strong> the<br />
inspector’s observation?<br />
Acknowledging that this is correct<br />
means you underst<strong>and</strong> the noncompliance.<br />
Coupled <strong>with</strong> this needs to be<br />
an underst<strong>and</strong>ing of the underlying<br />
regulation that has caused the observation:<br />
Is your interpretation correct <strong>and</strong><br />
how has this been documented in your<br />
SOPs?<br />
• A root cause analysis may be important<br />
for some observations as the<br />
underlying cause of the observation<br />
may not be immediately apparent in<br />
many cases.<br />
• Either provide:<br />
A description of a completed corrective<br />
action <strong>with</strong> evidence of the work<br />
carried out.<br />
A corrective action plan <strong>with</strong> evidence<br />
of work carried out to date.<br />
A corrective action plan <strong>with</strong> sufficient<br />
detail <strong>and</strong> a reasonable timescale<br />
outlining what will be done <strong>and</strong> by<br />
when. Will you be working <strong>with</strong> external<br />
experts who will help <strong>and</strong> guide you<br />
in your corrective action plan?<br />
• Make sure that the work package to<br />
resolve the observation is specific <strong>and</strong><br />
complete: for example, if an SOP is to be<br />
updated as there is an omission, provide<br />
a copy of the new SOP but also outline<br />
what training was provided to the impacted<br />
staff <strong>with</strong> copies of the material<br />
<strong>and</strong> updated training records.<br />
• Realism is important as the FDA<br />
officials reviewing your response are<br />
not idiots. As you cannot validate a<br />
laboratory information management<br />
system (LIMS) in one month, don’t<br />
expect the FDA to believe you if you put
www.spectroscopyonline.com<br />
November 2009 <strong>Spectroscopy</strong> 24(11) 29<br />
this in your response letter. Credibility<br />
is a vital commodity here — do not lose<br />
it. Therefore, be able to ensure that you<br />
can deliver on the plan <strong>and</strong> have the<br />
resourcing to do this. Strangely, at times<br />
like this, words such as “budget” <strong>and</strong><br />
“constraint” are never found together in<br />
the same sentence.<br />
• Addressing just the observation<br />
is like putting a b<strong>and</strong>-aid on a broken<br />
leg: you need to underst<strong>and</strong> what the<br />
impact is on other parts of the organization,<br />
other products, methods, instruments,<br />
systems, <strong>and</strong> so forth. This is<br />
the systems-based approach. For larger<br />
organizations, it may not be at just one<br />
site but globally. Remember, it is the<br />
EIR that will provide the FDA <strong>with</strong> ammunition<br />
to look at other sites <strong>and</strong> if<br />
they find the same problems — you are<br />
in trouble.<br />
• It’s all well <strong>and</strong> good providing<br />
plans <strong>and</strong> schedules for doing the work.<br />
How do you know the work will resolve<br />
the problem? More importantly, how<br />
do you know if the problem will not<br />
reoccur in the future? Therefore, you<br />
must anticipate these questions from<br />
the agency: How will you verify that the<br />
work has been done, what documentation<br />
will be available to demonstrate<br />
this, <strong>and</strong> how will you monitor the area<br />
to ensure that it does not happen again?<br />
A well-constructed response letter<br />
delivered <strong>with</strong>in the new 15-day timeframe<br />
will go a long way toward restoring<br />
your regulatory credibility. Still,<br />
you could look on the bright side: The<br />
program is an 18-month trial, so will<br />
the FDA drop this approach after the<br />
trial ends? I don’t think so, look at the<br />
resume of the new commissioner, read<br />
the speech <strong>and</strong> watch the video. I think<br />
this new program is here to stay. We<br />
will see an initial increase in warning<br />
letters but these will tail off as industry<br />
ensures it stays in compliance but it will<br />
be a rough time initially, as the tiger<br />
builds up momentum <strong>with</strong> its sharp<br />
new teeth.<br />
<strong>and</strong> you had better beware — complete<br />
responses to the 483 observations are<br />
required by 15 working days after the<br />
inspection or a warning letter or increased<br />
enforcement action may ensue.<br />
I have also outlined a practical way for<br />
audits to check you are in compliance<br />
but if that fails, a means to respond to<br />
483 observations. But remember, time is<br />
not on your side here.<br />
References<br />
(1) “Better Data Management <strong>and</strong> More<br />
Inspections are Needed to Strengthen<br />
FDA’s Foreign Drug Inspection Program,”<br />
U.S. Government Accountability<br />
Office, Report GAO-08-970,<br />
September 2008.<br />
(2) HR 759 FDA Modernization Act 2009.<br />
(3) “Law Enforcement <strong>and</strong> Benefits to<br />
Public Health,” Margaret Hamburg,<br />
6th August 2009.<br />
A copy of the speech is available at<br />
http://www.fda.gov/NewsEvents/<br />
Speeches/ucm175983.htm <strong>and</strong> the<br />
video of the speech can be accessed<br />
on the same page.<br />
(4) Review of Post-Inspection Responses<br />
Federal Register, August 11, 2009, 74<br />
(153) 40211–40212.<br />
(5) “Guidance for Industry, Formal Dispute<br />
Resolution: Scientific <strong>and</strong> Technical<br />
Issues Related to Pharmaceutical<br />
CGMP,” FDA January 2006.<br />
(6) International Conference on<br />
Harmonisation (ICH) Q10: Pharmaceutical<br />
Quality Systems<br />
step 4 (see www.ich.org).<br />
R.D. McDowall<br />
is principal of McDowall<br />
Consulting <strong>and</strong> director<br />
of R.D. McDowall<br />
Limited, <strong>and</strong> “Questions<br />
of Quality” column editor<br />
for LCGC Europe,<br />
<strong>Spectroscopy</strong>’s sister magazine. Address<br />
correspondence to him at 73 Murray<br />
Avenue, Bromley, Kent, BR1 3DJ, UK.<br />
www.spectroscopyonline.com<br />
Summary<br />
In this column, I have looked at the<br />
new postinspection response program,<br />
which was introduced on an 18-month<br />
trial by the FDA on the September 15,<br />
2009. The tiger’s new teeth are sharp<br />
Visit Us at MRS Fall Booth 916
30 <strong>Spectroscopy</strong> 24(11) November 2009<br />
www.spectroscopyonline.com<br />
Atomic Perspectives<br />
Advantages <strong>and</strong> Disadvantages<br />
of Different Column Types for<br />
Speciation <strong>Analysis</strong> by<br />
LC–ICP-MS<br />
With the growing popularity of speciation analysis, there are many options to consider on<br />
the chromatography side. Given that many speciation users have spectroscopy backgrounds,<br />
it is important to underst<strong>and</strong> some fundamental concepts of liquid chromatography (LC)<br />
before deciding upon methodology to pursue. This article focuses on three aspects of LC<br />
that should be considered before embarking on speciation analysis: ion exchange versus<br />
reversed-phase ion pairing separations, narrow bore versus st<strong>and</strong>ard bore LC columns, <strong>and</strong><br />
ultrahigh-pressure LC versus traditional high performance liquid chromatography (HPLC).<br />
Kenneth Neubauer<br />
Speciation analysis by liquid chromatography–inductively<br />
coupled plasma-mass spectrometry (LC–ICP-<br />
MS) has been growing rapidly in popularity <strong>and</strong> application<br />
over the past several years. Not only have people<br />
begun looking at different elements <strong>and</strong> species, but there<br />
has been an increase in the variety of matrices that speciation<br />
analysis is being performed on: various types of environmental,<br />
waste, <strong>and</strong> process waters; both solid <strong>and</strong> liquid<br />
foods; <strong>and</strong> biological fluids. With this increased interest,<br />
more laboratories are offering speciation analysis as service.<br />
When deciding upon a speciation method, many factors<br />
must be considered.<br />
The chromatographic separation of components is based<br />
upon competition between the column, mobile phase components,<br />
species, <strong>and</strong> the sample matrix. With the variety<br />
of matrices now being analyzed, there are a variety of chromatographic<br />
options available. This column will discuss<br />
three column types <strong>and</strong> the relative advantages <strong>and</strong> disadvantages<br />
of each.<br />
Ion-Exhange Versus Reversed-Phase Ion-Pairing<br />
Chromatography<br />
Two common types of separation schemes used in chromatography<br />
are ion-exchange <strong>and</strong> reversed-phase ion-pairing<br />
chromatography. These schemes differ primarily in the<br />
column stationary phase, which affects the way components<br />
compete for active sites on the column.<br />
Ion-exchange chromatography involves the interaction of<br />
ionic (that is, charged) components in the mobile phase <strong>with</strong><br />
charged stationary groups on the column packing material.<br />
Charged species in the sample compete <strong>with</strong> mobile phase<br />
components for sites on the column. Species <strong>with</strong> a stronger<br />
attraction to column sites than mobile phase components<br />
will be retained on the column longer <strong>and</strong> have longer
www.spectroscopyonline.com<br />
November 2009 <strong>Spectroscopy</strong> 24(11) 31<br />
Anion<br />
exchanger<br />
A _<br />
elution times. Species <strong>with</strong> a weaker attraction<br />
to the column than the mobile<br />
phase components will have shorter<br />
elution times. This is the mechanism<br />
by which separation is achieved <strong>and</strong> is<br />
represented in Figure 1.<br />
Reversed-phase ion-pairing chromatography<br />
involves the use of reversedphase<br />
columns that are characterized<br />
by nonpolar stationary phases composed<br />
of carbon chains, typically 18<br />
carbons (C18), although other columns<br />
exist <strong>with</strong> different length carbon<br />
chains (for example, four <strong>and</strong> eight<br />
carbons). Because most inorganic species<br />
exist in charged states in solution,<br />
it appears that reversed-phase columns<br />
A _<br />
A _<br />
NH 4<br />
+<br />
CI-<br />
CI-<br />
=Analyte - CI<br />
A _<br />
CI-<br />
+<br />
NH 4<br />
CI-<br />
A _<br />
= Counterion<br />
Figure 1: Schematic of the ion-exchange separation mechanism.<br />
Support O-C18 Organic - NH 3<br />
(+)<br />
Bonded reversedphase<br />
packing<br />
Ion pairing<br />
reagent<br />
(in mobile phase)<br />
Flow<br />
Figure 2: Diagram illustrating the reversed-phase ion-pairing mechanism.<br />
(-) O-R<br />
Ionic<br />
compound<br />
would not be able to perform the<br />
separation.<br />
This situation is rectified by incorporating<br />
an ion-pairing reagent in the<br />
mobile phase. Ion-pairing reagents<br />
consist of both nonionic <strong>and</strong> ionic<br />
parts: The nonionic sections interact<br />
<strong>with</strong> the carbon chain on the column,<br />
<strong>and</strong> the ionic sections interact <strong>with</strong><br />
the charged species in solution by<br />
mechanisms similar to those in ion-exchange<br />
chromatography. In this way, a<br />
reversed-phase column can be made to<br />
perform like an ion-exchange column.<br />
The mechanism of reversed-phase ionpairing<br />
chromatography is shown in<br />
Figure 2.<br />
Both ion-exchange <strong>and</strong> reversedphase<br />
ion-pairing chromatography<br />
each have their advantages <strong>and</strong> disadvantages.<br />
One of the main advantages<br />
of ion exchange is that there is only<br />
one interaction involved in the separation:<br />
the analytical species interacting<br />
<strong>with</strong> the stationary phase. With reversed-phase<br />
ion pairing, two interactions<br />
are involved <strong>with</strong> the separation:<br />
the ion-pairing reagent interacting<br />
<strong>with</strong> stationary phase of the column<br />
<strong>and</strong> the species interacting <strong>with</strong> the<br />
ion-pairing reagent. As a result, ionexchange<br />
chromatography may have<br />
more matrix tolerance.<br />
The downside of ion-exchange chromatography<br />
is that these columns typically<br />
are much more expensive than<br />
reversed-phase columns. Also, because<br />
reversed-phase columns have been in<br />
use for many years, they are reliable<br />
<strong>and</strong> established, meaning that results<br />
will be reproducible from one column<br />
to the next. This may not always<br />
be true <strong>with</strong> ion-exchange columns<br />
because new columns are constantly<br />
being developed <strong>with</strong> new ionic groups<br />
bound to the stationary phase. Because<br />
of this constant evolution, some ionexchange<br />
columns may not always<br />
be well established, which could lead<br />
to irreproducibility from column to<br />
column.<br />
The decision to use either ion-exhange<br />
or reversed-phase ion-pairing<br />
chromatography depends upon the<br />
application: the elements <strong>and</strong> species<br />
of interest, the sample matrix, <strong>and</strong> the<br />
levels of the different species that need<br />
to be measured.<br />
St<strong>and</strong>ard-Bore Versus<br />
Narrow-Bore Columns<br />
Regardless of which type of column<br />
is chosen, users are then faced <strong>with</strong><br />
another choice: column diameter. For<br />
speciation analysis, the two most common<br />
column diameters used are 4.6<br />
mm (referred to as st<strong>and</strong>ard bore) <strong>and</strong><br />
2.1 mm (narrow bore). Again, each diameter<br />
offers specific advantages <strong>and</strong><br />
limitations.<br />
St<strong>and</strong>ard-bore columns are available<br />
in a variety of particle sizes, ranging<br />
from 3 µm to 10 µm. Depending upon<br />
the size, the optimal high performance
32 <strong>Spectroscopy</strong> 24(11) November 2009 www.spectroscopyonline.com<br />
HETP (µm)<br />
60<br />
40<br />
20<br />
0<br />
0 2 4 6 8<br />
Flow Rate (mL/min)<br />
liquid chromatography (HPLC) flow<br />
rate for achieving the best separation<br />
can vary from 0.7 mL/min to 2 mL/<br />
min, as shown in the Van Deemter<br />
plot in Figure 3. In this figure, the<br />
HETP label on the y-axis refers to the<br />
height equivalent to a theoretical plate<br />
— the lower the HETP, the better<br />
the separation. As shown in the Van<br />
Deemter plot, the best separations are<br />
achieved <strong>with</strong> 3-µm packings <strong>and</strong> a<br />
flow rate of 1.5–2 mL/min. ICP-MS<br />
can h<strong>and</strong>le 1.5-mL/min sample introduction<br />
rates <strong>with</strong>out a problem, so<br />
the best separations are achieved <strong>with</strong><br />
a 3-µm packing <strong>and</strong> an LC flow rate<br />
of 1.5 mL/min. These conditions are<br />
well suited for st<strong>and</strong>ard-bore<br />
columns.<br />
If a 3-µm packing is used in a narrow-bore<br />
column, a flow rate of 1.5<br />
mL/min will result in a very high back<br />
pressure, typically too high to be run<br />
safely. This is the result of the smaller<br />
internal diameter of the column. As a<br />
result, narrow-bore columns usually<br />
are run <strong>with</strong> LC flow rates of 0.2–0.5<br />
mL/min. As seen in the Van Deemter<br />
plot, these low flow rates do not provide<br />
the best separation, which means<br />
that using a narrow-bore column may<br />
involve sacrificing some separation<br />
capability. This compromise may<br />
or may not be a problem, depending<br />
upon the spacing between peaks.<br />
However, this usually can be<br />
10m<br />
5m<br />
3m<br />
Figure 3: Van Deemter plots for various LC stationary phase particle diameters.<br />
compensated for by changing the<br />
mobile phase conditions.<br />
Narrow-bore columns offer two advantages<br />
compared <strong>with</strong> st<strong>and</strong>ard-bore<br />
columns: sharper peaks <strong>and</strong> less reagent<br />
consumption. The sharper peaks<br />
are a direct result of the narrower column<br />
width — there is less radial dispersion,<br />
which leads to sharper, more<br />
intense peaks than those obtained<br />
using st<strong>and</strong>ard-bore columns. The increased<br />
peak sharpness may compensate<br />
for the loss of resolution resulting<br />
from the nonoptimal flow rates. The<br />
increased peak height may also mean<br />
that lower levels of the species can be<br />
seen.<br />
A main drawback of narrow-bore<br />
columns versus st<strong>and</strong>ard-bore columns<br />
is that their capacity is reduced.<br />
Because fewer stationary phase particles<br />
can physically fit into the narrower<br />
column, there is less surface area available<br />
for species to bind. As a result,<br />
these columns can become overloaded<br />
easily, which could be a problem when<br />
analyzing unknowns.<br />
Typically, this reduced capacity<br />
is compensated for by diluting the<br />
samples more or using smaller injection<br />
volumes. Because less sample is<br />
injected onto the column, this may<br />
offset the advantage of increased peak<br />
height. Therefore, it is not always possible<br />
to measure lower levels <strong>with</strong> a<br />
narrow-bore column.<br />
Another potential disadvantage of<br />
narrow-bore versus st<strong>and</strong>ard-bore columns<br />
is sample throughput. Because<br />
lower LC flow rates are used for narrow-bore<br />
columns, separations tend to<br />
take longer than <strong>with</strong> st<strong>and</strong>ard-bore<br />
columns, which will affect sample<br />
throughput. The advantage of a lower<br />
LC flow rate is that there is less consumption<br />
of reagents <strong>and</strong> less waste to<br />
dispose.<br />
When deciding whether to use a<br />
st<strong>and</strong>ard-bore or narrow-bore column,<br />
users must consider which combination<br />
of factors is best for a particular<br />
laboratory <strong>and</strong> application. There is no<br />
single correct answer — each situation<br />
is different.<br />
HPLC Versus UHPLC for<br />
Speciation<br />
Within the past several years, a new<br />
form of LC has emerged: ultrahighpressure<br />
liquid chromatography<br />
(UHPLC). The Van Deemter plot<br />
shows that the smaller the particle size<br />
in the column, the better the separation.<br />
UHPLC uses columns <strong>with</strong><br />
particle sizes less than 3 µm, typically<br />
1.5–2.5 µm. These smaller particles<br />
provide more surface area for mobile<br />
phase <strong>and</strong> species to interact, which<br />
leads to better separation. Or, another<br />
way to think of it is that shorter<br />
columns <strong>with</strong> smaller packings can<br />
provide the same separation as longer<br />
columns <strong>with</strong> larger packings. The advantage<br />
of the shorter columns is that<br />
the time for separations are reduced<br />
greatly.<br />
The other signifcance of the smaller<br />
packings is a much higher back pressure,<br />
typically more than 10,000 psi.<br />
This increased pressure requires a special<br />
HPLC pump capable of h<strong>and</strong>ling<br />
it. Normal HPLC pumps cannot be<br />
used <strong>with</strong> columns containing packing<br />
material <strong>with</strong> a diameter of
www.spectroscopyonline.com<br />
November 2009 <strong>Spectroscopy</strong> 24(11) 33<br />
analysis times required for the separation<br />
of biological molecules (such as<br />
proteins, peptides, <strong>and</strong> so forth), which<br />
can take up to an hour or more. Most<br />
typical speciation analyses <strong>with</strong> either<br />
st<strong>and</strong>ard- or narrow-bore columns<br />
can be accomplished in less than 10<br />
min. Therefore, there would not be a<br />
great time savings.<br />
Users of UHPLC also must be aware<br />
of other factors associated <strong>with</strong> these<br />
columns. First, because the particles<br />
are so small <strong>and</strong> packed so tightly, the<br />
columns can clog easily. To eliminate<br />
particulates, all mobile phases <strong>and</strong><br />
samples must be filtered before analysis.<br />
Because ICP-MS is such a sensitive<br />
detection method, filtering can introduce<br />
conatmination, that could raise<br />
the baseline. Also, filtering samples<br />
may facilitate the interconversion of<br />
species in solution. Therefore, the effects<br />
of filtering on species conversion<br />
must be studied <strong>and</strong> understood.<br />
The additional active sites available<br />
on UHPLC columns provide the<br />
increased separation capability, but<br />
this also means that these columns<br />
take longer to equilibrate. While a<br />
typical 3-µm column may take 20<br />
min to equilibrate, a UHPLC column<br />
could take upwards of 45 min for<br />
proper equilibration. This increased<br />
time would have consequences when<br />
starting the system, changing mobile<br />
phases, running gradient methods,<br />
<strong>and</strong> performing method development.<br />
Another aspect to consider are the<br />
types of UHPLC columns available.<br />
Because UHPLC is relatively new <strong>and</strong><br />
was developed primarily for separation<br />
of biological substances, columns<br />
that will separate inorganic species<br />
of interest may not be available. For<br />
example, there are few ion-exchange<br />
UHPLC columns available.<br />
Where UHPLC could be advantageous<br />
is in the emerging field of<br />
metallomics. This field involves the<br />
separation of biological substances<br />
using ICP-MS to detect inorganic molecules<br />
associated <strong>with</strong> proteins, peptides,<br />
<strong>and</strong> other biomolecules. UHPLC<br />
columns may be available to separate<br />
the substances of interest.<br />
Summary<br />
When performing speciation analysis,<br />
there are many aspects that must be<br />
considered: separation scheme, column<br />
type, column diameter, mobile<br />
phase, species of interest, required<br />
measurement levels of each species,<br />
sample throughput, <strong>and</strong> reagent usage<br />
<strong>and</strong> disposal. There is no single right<br />
answer for every situation. Each user<br />
must consider these factors when undertaking<br />
speciation analysis.<br />
Kenneth Neubauer<br />
is a Senior Scientist<br />
at PerkinElmer LAS,<br />
where he works <strong>with</strong><br />
both ICP-MS <strong>and</strong><br />
HPLC–ICP-MS. He received<br />
a B.A. in Chemistry<br />
from Colgate University, Hamilton,<br />
New York, <strong>and</strong> a Ph.D. in Analytical Chemistry<br />
from the University of Delaware,<br />
Newark. Ken joined PerkinElmer in 1997.<br />
For more information on<br />
this topic, please <strong>vis</strong>it:<br />
www.spectroscopyonline.com
34 <strong>Spectroscopy</strong> 23(11) November 2009 www.spectroscopyonline.com<br />
Interaction of Indigo Carmine<br />
<strong>with</strong> <strong>Nucleic</strong> <strong>Acid</strong>s in the Presence<br />
of Cetyltrimethylammonium<br />
Bromide: Spectral Studies <strong>and</strong> the<br />
Confirmation of Combined Points<br />
The interaction of indigo carmine <strong>with</strong> nucleic acids in weak acid medium was studied in the<br />
presence of cetyltrimethylammonium bromide (CTMAB) by the measurements of resonance<br />
light scattering (RLS), <strong>UV</strong>–<strong>vis</strong>, <strong>and</strong> nuclear magnetic resonance (<strong>NMR</strong>) spectra. In trihydroxymethyl<br />
aminomethane (Tris) buffer (pH 5.47), indigo carmine <strong>and</strong> nucleic acids interact <strong>with</strong><br />
CTMAB to form a ternary complex, which results in the enhanced RLS signals at 285 nm,<br />
336 nm, 405.5 nm, <strong>and</strong> 548 nm, respectively. The enhanced RLS intensity at 336 nm is proportional<br />
to the concentration of nucleic acids in a wide range <strong>with</strong> a detection limit of 3.1<br />
ng/mL. And the concentrations of nucleic acids in three synthetic samples were analyzed<br />
satisfactorily. Mechanistic studies show that the enhanced RLS stems from the aggregation<br />
of indigo carmine on nucleic acids through the bridged <strong>and</strong> synergistic effect of CTMAB. The<br />
combined points of the anionic dye indigo carmine <strong>and</strong> nucleic acids-CTMAB have been confirmed<br />
tentatively by using 1 H <strong>NMR</strong> spectroscopy.<br />
Changqun Cai, Xiaoming Chen, Hang Gong<br />
Some organic dyes have important environmental effects;<br />
for instance, dye dilution methods for determining<br />
blood flow are used in a wide variety of circumstances<br />
(1). Most of them have low-potential toxicity <strong>and</strong> can<br />
be detected easily by ordinary spectrophotometric methods<br />
(2). However, some azo dyes can be decomposed to produce<br />
aromatic amine changing the structure of DNA, which results<br />
in human pathological changes <strong>and</strong> induces cancer (3).<br />
Ever since its introduction in 1903 by Voelcher <strong>and</strong> Joseph,<br />
indigo carmine (IC) has been used to test renal function <strong>and</strong><br />
it has been the subject of investigation for many years (4,5).<br />
IC usually is dispensed for intravenous injection in 0.8% of<br />
water solution in 5-cc ampules. The compound’s molecular<br />
structure is shown in Figure 1.<br />
Resonance light scattering (RLS) is a creative application<br />
of light signals to the measurement of RLS by simultaneously
36 <strong>Spectroscopy</strong> 23(11) November 2009 www.spectroscopyonline.com<br />
NaO 3 S<br />
N<br />
H<br />
Figure 1: Molecular structure of indigo carmine.<br />
scanning the excitation <strong>and</strong> emission<br />
monochromators <strong>with</strong> a common fluorescence<br />
spectrophotometer. It has been<br />
proved that RLS has the advantages of<br />
simplicity <strong>and</strong> high sensitivity for detecting<br />
cation porphrins (6–8), triphenylmethane<br />
dyes (9), phenothiazinium<br />
dyes (10,11), xanthene dyes (12,13), metal<br />
complexes (14–16), cationic surfactant<br />
(17), zwitterionics (18), <strong>and</strong> nanoparticles<br />
(19,20). Up until now, only a few<br />
investigations have been carried out to<br />
determine nucleic acids as probe reagents<br />
for anionic dye (21–23), due to the<br />
electrostatic repulsion between nucleic<br />
acids <strong>and</strong> it.<br />
In this study, we first find that the<br />
ternary complex of IC-cetyltrimethylammonium<br />
bromide (CTMAB)-<br />
nucleic acids can cause a stronger RLS<br />
signal. The enhanced intensity of RLS<br />
is proportional to the concentration of<br />
nucleic acids in a wide range. The sensitivity,<br />
selectivity, <strong>and</strong> linear range for<br />
the determination of nucleic acids by<br />
RLS are reported. The combined points<br />
of the anionic dye IC <strong>and</strong> nucleic acids-<br />
CTMAB have been tentatively confirmed<br />
by using 1 H <strong>NMR</strong> spectroscopy.<br />
The reaction mechanism <strong>and</strong> the influential<br />
factors on the variation of RLS<br />
have been investigated.<br />
b<br />
a<br />
c<br />
O<br />
H<br />
N<br />
O<br />
c<br />
a<br />
b<br />
SO 3 Na<br />
Experimental<br />
Reagents<br />
Stock solutions of nucleic acids were<br />
prepared by dissolving commercially<br />
purchased yeast DNA (Shanghai Changyan<br />
Pharmaceutical Factory, Shanghai,<br />
China), calf thymus DNA (Shanghai<br />
Changyan Pharmaceutical Factory),<br />
fish sperm DNA (fsDNA, Shanghai<br />
Institute of Biochemistry, Academy of<br />
Science, Shanghai, China), <strong>and</strong> yeast<br />
RNA (Shanghai Changyan Pharmaceutical<br />
Factory) in doubly distilled water.<br />
These stocks needed to be stored at 0–4<br />
°C <strong>with</strong> only an occasional gentle shake<br />
if needed. The concentration of DNA<br />
was determined according to the absorbance<br />
values at 260 nm by using ε DNA<br />
= 6600 mol -1 L cm -1 (24). In this experiment,<br />
all working solutions of DNA were<br />
25.0 mg/L.<br />
A 1.0 X 10 -3 mol/L stock solution of<br />
IC (Shanghai Chemical Reagents Co.<br />
Shanghai, China), was prepared by dissolving<br />
0.4664 g of the crystal product<br />
in water in a 1000-mL volumetric flask.<br />
The working solution of IC was 5.0 X 10 -5<br />
mol/L.<br />
A 5.0 X 10 -4 mol/L stock solution<br />
of cation surfactant CTMAB (Merck,<br />
Germany) was prepared by dissolving<br />
Intensity<br />
450<br />
400<br />
350<br />
300<br />
250<br />
0.3645 g of the crystal product in water<br />
in a 1000-mL volumetric flask.<br />
A 0.10 mol/L Tris-HCl buffer solution<br />
was prepared by dissolving 12.1140<br />
g of Tris in 1000 mL volumetric flash in<br />
water <strong>and</strong> then adjusting the pH to 5.47<br />
<strong>with</strong> 1.0 mol/L HCl.<br />
All reagents were of analytical reagent<br />
grade <strong>with</strong>out further purification <strong>and</strong><br />
doubly distilled water was used throughout<br />
the process.<br />
Apparatus<br />
The RLS spectrum <strong>and</strong> the intensity<br />
of RLS were measured <strong>with</strong> an RF-<br />
5301PC (Shimadzu, Japan) fluorescence<br />
spectrometer by using a 1.00-cm quartz<br />
fluorescence cell. All absorption spectra<br />
were measured on a <strong>UV</strong>-265 spectrophotometer<br />
(Shimadzu, Japan). The surface<br />
tension (σ) was measured <strong>with</strong> a Krüss<br />
KizMK5 program surface tension instrument<br />
(Krüss GmbH, Hamburg,<br />
germany) by using the suspended plate<br />
method. 1 H <strong>NMR</strong> spectra were recorded<br />
on a BRUKER 400 spectrometer (Bruker,<br />
Billerica, Massachusetts) for solution in<br />
D 2 O <strong>with</strong> tetramethylsilane (TMS) as<br />
internal st<strong>and</strong>ard. Chemical shifts are<br />
reported downfield in parts per million<br />
(ppm) <strong>and</strong> J-values are in Hz. A pHs-3C<br />
digital pH meter (Leici, Shanghai) was<br />
200<br />
2<br />
150<br />
100<br />
3<br />
50<br />
4<br />
0<br />
250 300 350 400 450 500 550 600 650 700<br />
Wavelength (nm)<br />
Figure 2: RLS spectra of IC-CTMAB-DNA system. Conditions: CIC, 3.0 X 10 -6 mol/L; pH, 5.47;<br />
CDNA, 500 µg/L; CCTMAB, 3.0 X 10 -5 mol/L. 1 = IC-CTMAB-DNA, 2 = CTMAB-DNA, 3 = IC-<br />
CTMAB, 4 = DNA-IC.<br />
1
www.spectroscopyonline.com<br />
November 2009 <strong>Spectroscopy</strong> 23(11) 37<br />
utilized to detect the pH values of the<br />
aqueous solutions.<br />
St<strong>and</strong>ard procedure<br />
Into a 25-mL volumetric test tube were<br />
successively added appropriate volumes<br />
of nucleic acids solution according to the<br />
concentration needed: 1.50 mL 5.0 X 10 -4<br />
mol/L CTMAB, 1.50 mL 5.0 X 10 -5 mol/L<br />
IC, <strong>and</strong> 2.00 mL HMTA-HCl buffer. The<br />
mixture was diluted to the mark <strong>with</strong><br />
water <strong>and</strong> mixed thoroughly before RLS<br />
was measured. All measurements were<br />
made at an ambient temperature of 25<br />
°C.<br />
All RLS spectra were obtained by scanning<br />
simultaneously the excitation <strong>and</strong><br />
emission monochromators (namely Δλ<br />
= 0 nm) from 250 to 700 nm. The intensity<br />
of RLS was measured at λ = 336 nm in<br />
a quartz fluorescence cell <strong>with</strong> slit width<br />
at 3.0 nm for the excitation <strong>and</strong> emission.<br />
The enhanced intensity of the CTMAB-<br />
IC system by DNA was represented as<br />
ΔI RLS = I RLS – I0 RLS. Here, I RLS <strong>and</strong> I 0 RLS<br />
were the intensity of the system <strong>with</strong> <strong>and</strong><br />
<strong>with</strong>out nucleic acids.<br />
Absorbance<br />
0.55<br />
0.50<br />
0.45<br />
0.40<br />
0.35<br />
0.30<br />
0.25<br />
0.20<br />
0.15<br />
0.10<br />
0.05<br />
0.00<br />
300<br />
1<br />
2<br />
3<br />
4<br />
5 5<br />
1<br />
2<br />
3<br />
4<br />
400 500 600 700<br />
Wavelength (nm)<br />
Figure 3: The absorption spectra. 1 = IC-CTMAB-DNA, 2 = IC-CTMAB, 3 = IC-DNA, 4 = IC, 5 =<br />
CTMAB-DNA. Conditions: CIC, 5.0 X 10 -5 mol/L; pH, 5.47; CCTMAB, 5.0 X 10 -4 mol/L; CDNA, 500<br />
µg/L.<br />
Results <strong>and</strong> Discussion<br />
Features of the resonance light scattering<br />
spectrum<br />
As can be seen from Figure 2 (curves 1–<br />
4), when yDNA is mixed <strong>with</strong> CTMAB,<br />
strong RLS signals could be found, because<br />
CTMAB could be aggregated on<br />
the molecular surface of nucleic acids (25)<br />
(curve 2). However, it is still much weaker<br />
than those of curve 1, which indicates that<br />
the RLS of DNA is enhanced <strong>with</strong> the<br />
help of both IC <strong>and</strong> CTMAB, <strong>and</strong> a ternary<br />
complex (26) of IC-CTMAB-DNA is<br />
produced. The CTMAB in the system acts<br />
as a bridge between IC <strong>and</strong> DNA, which<br />
results in the greatly enhanced RLS intensities.<br />
Similar RLS spectral characteristics<br />
can be surveyed when fsDNA, ctDNA,<br />
<strong>and</strong> yRNA are used.<br />
The absorption spectra of the IC-<br />
CTMAB-DNA system in the 220–700<br />
nm region are presented in Figure 3. By<br />
comparing the light-scattering <strong>and</strong> absorption<br />
spectra, it can be seen that the<br />
peaks of light scattering at 336 nm appear<br />
at the red side of the absorption b<strong>and</strong>s at<br />
292 nm. According to the theory of RLS<br />
(1,27), the peaks of light scattering at 336<br />
nm are ascribed to the absorption b<strong>and</strong>s<br />
of IC at 292 nm. Because the light-scat-
38 <strong>Spectroscopy</strong> 23(11) November 2009 www.spectroscopyonline.com<br />
Intensity<br />
450<br />
400<br />
350<br />
300<br />
250<br />
200<br />
150<br />
100<br />
50<br />
0<br />
250<br />
300 350 400 450 500 550 600 650 700<br />
Wavelength (nm)<br />
Figure 4: Effect of surfactants on the I RLS value of IC-DNA-CTMAB system. Conditions: CIC, 3.0 X<br />
10 -6 mol/L; pH, 5.47; CDNA, 500 µg/L. 1 = CTMAB, 2 = CPB, 3 = TX-100, 4 = SDBS, 5 = SDS.<br />
Surface tension (mN/m)<br />
100<br />
80<br />
60<br />
40<br />
20<br />
0<br />
1 2 3 4 5 6 7 8 9<br />
C<br />
CTMAB (10-5 )<br />
Figure 5: Effect of CTMAB concentration on surface tension. Conditions: CIC, 3.0 X 10 -6 mol/L;<br />
pH, 5.74; CDNA, 500 µg/L.<br />
I RLS<br />
450<br />
400<br />
350<br />
300<br />
250<br />
200<br />
150<br />
100<br />
50<br />
0<br />
0 0.5 1 1.5 2<br />
Indigo carmine concentration<br />
Figure 6: Effect of IC concentration on the ΔI RLS intensity. Conditions: CCTMAB, 3.0 X 10 -5 mol/L;<br />
pH, 5.47; CDNA, 500 µg/L. Top: I RLS of the system <strong>with</strong> DNA; bottom: I RLS of the system <strong>with</strong>out<br />
DNA).<br />
1<br />
2<br />
3<br />
4<br />
5<br />
tering spectrum depends on the nature<br />
of the system, also reflects the characteristics<br />
of the instrument (28), the RLS<br />
peak around 470 nm is considered to be<br />
possibly the emission of the xenon lamp<br />
in this region (29). The RLS intensity at<br />
336 nm is the maximum, so 336 nm was<br />
selected in the further study.<br />
Effect of buffer <strong>and</strong> surfactant<br />
The effects of buffer <strong>and</strong> surfactant are<br />
examined. Tris is the best buffer tested,<br />
HMTA-HCl (88.7); NH 4 Ac-HAc (19.2);<br />
NH 3 -NH 4 Cl (11.5). It can be seen from<br />
Figure 4 that CTMAB is the best surfactant.<br />
The effects of buffer <strong>and</strong> surfactant are<br />
examined (presented in Figure 4) <strong>and</strong> we<br />
know the enhanced RLS signals strongly<br />
depend upon the concentration of<br />
CTMAB. If the concentration of CTMAB<br />
is too small, the enhanced RLS intensity<br />
is not significant. However, when the<br />
concentration of CTMAB increases, the<br />
enhanced RLS signals are very strong.<br />
When the concentration of CTMAB is<br />
above 4.0 X 10 -5 mol/L, perhaps CTMAB<br />
reacts <strong>with</strong> IC directly <strong>and</strong> forms larger<br />
particles of IC-CTMAB which is not favorable<br />
for further reaction <strong>with</strong> DNA, so<br />
the ΔIRLS decreases.<br />
From the measurement of surface tension<br />
(shown in Figure 5), we can obtain<br />
the critical associate concentration (CAC)<br />
in this system, which is 3.0 X 10 -5 mol/L.<br />
So 3.0 X 10 -5 mol/L CTMAB is selected for<br />
further research.<br />
The effects of buffer are examined, <strong>and</strong><br />
the dependence of light-scattering upon<br />
pH might be relevant to the form of IC<br />
<strong>and</strong> DNA. When the pH is below 4.50,<br />
both the free base form of IC <strong>and</strong> DNA<br />
are protonized, which is not favorable for<br />
positively charged CTMAB to be close<br />
to the DNA molecule. At the same time,<br />
the concentration of IC <strong>with</strong> two negative<br />
charges is low, which is not favorable for<br />
the reaction of IC <strong>and</strong> CTMAB. When<br />
the pH is above 6.50, the ΔI RLS of IC-<br />
CTMAB-DNA system begins to decline<br />
markedly, perhaps as a result of the direct<br />
reaction CTMAB <strong>with</strong> IC. So pH 5.47 is<br />
chosen for further research.<br />
Effect of indigo carmine<br />
concentration<br />
The effect of IC concentration on<br />
ΔI RLS of the IC-CTMAB-DNA system is<br />
investigated <strong>and</strong> shown in Figure 6. As is
www.spectroscopyonline.com<br />
November 2009 <strong>Spectroscopy</strong> 23(11) 39<br />
indicated by the figure, the IC concentration<br />
has an obvious effect on ΔI RLS of<br />
the IC-CTMAB-DNA system. It is found<br />
that when the concentration of IC is in<br />
the range 2.0 X 10 -6 to 4..0 X 10 -6 mol/L,<br />
the ΔI RLS of the IC-CTMAB-DNA system<br />
reaches a maximum. So we select 3.0 X<br />
10 -6 mol/L IC for further research.<br />
Effect of the ionic strength<br />
The ionic strength of the medium<br />
has an effect on the interaction of IC,<br />
CTMAB, <strong>and</strong> DNA. As Figure 7 shows,<br />
the ΔI RLS of the IC-CTMAB-DNA system<br />
decreased slightly when NaCl was at<br />
a low concentration, while it decreased<br />
markedly <strong>with</strong> the increasing ionic<br />
strength. The reason could be that Na+<br />
shielded the phosphorus negative charge<br />
of DNA, which weakened the combination<br />
of DNA <strong>and</strong> CTMAB, so the ΔI RLS<br />
decreased, despite the strong dependence<br />
of the enhanced light scattering of IC by<br />
DNA upon ionic strength ranges from 0<br />
to 0.05.<br />
Reaction time <strong>and</strong> stability<br />
The binding reaction of DNA <strong>and</strong> IC<br />
<strong>with</strong> CTMAB occurs rapidly at room<br />
temperature after less than 2 min, <strong>and</strong><br />
the ΔI RLS remains a constant for about<br />
4 h. It shows that the reaction does not<br />
require any crucial timing <strong>and</strong> has good<br />
stability.<br />
Table I: Interference of foreign substances<br />
Foreign<br />
substance<br />
Conc.<br />
Coexisting<br />
(µg/L)<br />
Relative<br />
error<br />
(%)<br />
Foreign<br />
substance<br />
Conc.<br />
Coexisting<br />
(µg/L)<br />
Relative<br />
error<br />
(%)<br />
Ca(II) 5.0 -0.66 Fe(III) 48 -0.98<br />
Al(III) 1.5 3.88 KH 2 PO 4 30.0 -2.76<br />
Mg(II) 2.0 7.63 Co(III) 0.10 9.01<br />
Ni(II) 0.90 -1.92 Pb(II) 0.10 -6.12<br />
EDTA 12.0 3.40 L-Leucine 0.08 0.97<br />
Adenine 16.0 -2.74 DL-Alanine 15.0 2.33<br />
20.0 -3.34 Sucrate 20.0 -4.65<br />
D-Galactose 40.0 -5.02 DL-Cystine 7.5 3.27<br />
L-Lysine 30.0 7.11<br />
L-Methionine<br />
DL-Tryptophan<br />
40.0 2.18<br />
DL-Histidine 20.0 2.16 Thymine 15.0 -5.23<br />
Tolerance of Foreign Coexisting<br />
Substances<br />
The effect of substances such as metal<br />
ions, amnion acids, galactose, <strong>and</strong> adenine<br />
were examined for interference.<br />
The results are summarized in Table I. It<br />
can be seen that most of the metal ions in<br />
biological systems, such as K + , Na + , <strong>and</strong><br />
Ca 2+ , can be tolerated at high concentrations<br />
because they are hard ions (30) <strong>and</strong><br />
tend to bind almost exclusively <strong>with</strong> the<br />
phosphate groups, stabilizing the Watson–Crick<br />
double helix of DNA, so their<br />
effect on the interaction of IC is related to<br />
the shielding effects of counter ions on the<br />
negative backbone of nucleic acids, which<br />
shows that this method is very useful <strong>and</strong><br />
valuable.<br />
Calibration<br />
Under the optimum conditions, the dependence<br />
of ΔI RLS upon the concentration<br />
of DNA is determined. The analytical parameters<br />
of this method are listed in Table<br />
II, which shows that there was a good
40 <strong>Spectroscopy</strong> 23(11) November 2009 www.spectroscopyonline.com<br />
Table II: Analytical parameters<br />
<strong>Nucleic</strong> acids<br />
Linear range<br />
(mg/L)<br />
Linear regression<br />
equation<br />
(mg/L)<br />
Limit of<br />
determination<br />
(ng/mL)<br />
Correlation<br />
coefficient (r)<br />
yDNA 0–2.50<br />
ΔI = 156.53C<br />
+ 81.43<br />
ctDNA 0.05–2.00<br />
ΔI = 139.28C<br />
+ 96.26<br />
fsDNA 0.12–2.20<br />
ΔI = 128.81C<br />
+ 107.68<br />
RNA 0.10–2.30<br />
ΔI =<br />
125.56C+80.27<br />
3.10 0.9997<br />
7.59 0.9993<br />
9. 97 0.9995<br />
14.86 0.9986<br />
Table III: Chemical shifts (ppm) of individual protons of IC in the systems<br />
a b c<br />
IC 8.10 7.55 6.52<br />
IC-CTMAB-yDNA 8.13 7.58 6.58<br />
I RLS<br />
450<br />
400<br />
350<br />
300<br />
250<br />
200<br />
150<br />
100<br />
50<br />
0<br />
0 0.01 0.02 0.03 0.04 0.05 0.06<br />
Sodium ion concentration<br />
Figure 7: Effect of ion strength on the ΔI RLS value of IC-DNA-CTMAB system. Conditions:<br />
CCTMAB, 3.0 X 10 -5 mol/L; pH, 5.47; CDNA, 500 µg/L; CIC, 3.0 X 10 -6 mol/L. Top: I RLS of the system<br />
<strong>with</strong> DNA; bottom: I RLS of the system <strong>with</strong>out DNA.<br />
linear relationship between ΔI RLS <strong>and</strong><br />
nucleic acids in a wide range. It is well<br />
known that no groove or helix structure<br />
exists in RNA, However, both DNA <strong>and</strong><br />
RNA can increase the resonance light<br />
scattering intensity of IC-CTMAB in<br />
our experiment. So groove binding <strong>and</strong><br />
intercalative binding are not the reason<br />
for the RLS enhancement.<br />
Nature of the interaction of IC,<br />
CTMAB, <strong>and</strong> nucleic acids<br />
Generally, organic dyes interact <strong>with</strong><br />
DNA in the following models: intercalative,<br />
groove or electrostatic binding,<br />
<strong>and</strong> the long-range assembly on the<br />
molecular surface of DNA does not involve<br />
intercalative or groove binding. It<br />
can be seen from Figure 2 that <strong>with</strong> the<br />
addition of CTMAB, DNA can enhance<br />
the ΔI RLS <strong>with</strong>out IC, which is due to the<br />
formation of a DNA-CTMAB association,<br />
although the ΔI RLS is smaller than<br />
that in the presence of IC. IC <strong>and</strong> DNA<br />
cannot react <strong>with</strong> each other due to the<br />
electrostatic between them. By introducing<br />
a bridge, namely, cationic surfactant<br />
CTMAB into DNA-anionic dyes system,<br />
IC, CTMAB, <strong>and</strong> DNA formed a ternary<br />
complex of IC-DNA-CTMAB, which<br />
shortened the distance between IC <strong>and</strong><br />
DNA <strong>and</strong> enhanced the assembly of IC<br />
on the surface of DNA. Several other
www.spectroscopyonline.com<br />
November 2009 <strong>Spectroscopy</strong> 23(11) 41<br />
(a)<br />
(b)<br />
8.0 7.5 7.0 6.5<br />
chemical shift is attributed to the reduction<br />
of the electron cloud density. It is<br />
considered that the decrease of electron<br />
cloud density of hydrogen atoms is attributed<br />
to the fact that IC combines<br />
<strong>with</strong> nucleic acid <strong>and</strong> CTMAB. The (c)<br />
hydrogen atoms are moved downfield,<br />
<strong>and</strong> this indicates the combined points<br />
are the three hydroxyl of IC through<br />
hydrogen bond <strong>and</strong> form IC-CTMABnucleic<br />
acids ternary complex, resulting<br />
in the RLS enhancement of this system.<br />
This is consistent <strong>with</strong> the earlier<br />
studies.<br />
8.0 7.5 7.0 6.5<br />
Figure 8: The <strong>NMR</strong> spectra of the system: (a) IC, (b)-CTMAB-yDNA.<br />
surfactants have been employed to examine<br />
further the surfactant effects<br />
functioning in RLS enhancement. The<br />
cationic surfactants revealed RLS enhancement<br />
effects much more prominently,<br />
which in turn disclosed that<br />
electrostatic force performs an important<br />
function in the combination<br />
of DNA <strong>with</strong> IC <strong>and</strong> surfactant. The<br />
relatively weak RLS enhancement effects<br />
of non-ion <strong>and</strong> anion surfactant<br />
confirms that hydrophobic force is<br />
also a factor in the reaction of DNA<br />
<strong>with</strong> IC <strong>and</strong> surfactant (31)<br />
It is recognized that <strong>vis</strong>cosity is one<br />
of the important parameters in the<br />
reaction of DNA <strong>and</strong> small molecules<br />
(32). The relative <strong>vis</strong>cosities of different<br />
mixtures were examined in the experiment<br />
<strong>and</strong> the relative <strong>vis</strong>cosity of<br />
the ternary complex declining slightly<br />
indicated that there was no intercalative<br />
among CTMAB, DNA, <strong>and</strong> IC.<br />
So we can conclude that the interaction<br />
of nucleic acids, CTMAB, <strong>and</strong><br />
IC mainly depend upon electrostatic<br />
binding. Hydrophobic force is also the<br />
factor in the reaction of nucleic acids<br />
<strong>and</strong> IC <strong>with</strong> surfactant.<br />
The <strong>NMR</strong> spectra of the system<br />
To further underst<strong>and</strong> the interaction<br />
between IC, CTMAB, <strong>and</strong><br />
DNA, <strong>NMR</strong> spectra at optimum experimental<br />
conditions were measured,<br />
as is shown in Figure 8 <strong>and</strong> Table<br />
III. Corresponding to IC, the chemical<br />
shift signals of all hydrogen atoms<br />
moved downfield significantly when IC<br />
was added into the CTMAB <strong>and</strong> yDNA<br />
solution. The motion to downfield of the<br />
Conclusion<br />
In this article, a new RLS assay of nucleic<br />
acids is proposed. IC, CTMAB, <strong>and</strong> nucleic<br />
acids can form a ternary complex<br />
mainly through electrostatic binding,<br />
hydrophobic force, <strong>and</strong> hydrogen bond,<br />
which results in the enhanced DI RLS of<br />
IC-CTMAB-nucleic acids system. The<br />
combined points of the anionic dye<br />
<strong>with</strong> nucleic acids have been tentatively<br />
confirmed through the measurement<br />
of 1 H <strong>NMR</strong> spectra, which establishes a
42 <strong>Spectroscopy</strong> 23(11) November 2009 www.spectroscopyonline.com<br />
foundation for further investigation on<br />
the nucleic acids at the molecular level,<br />
<strong>and</strong> have enlarged the range of probe reagents<br />
of nucleic acids at the same time.<br />
This method enlarges the range of probe<br />
reagents of nucleic acids, which will be<br />
applied widely for quantitative determination<br />
of nucleic acids. The reaction<br />
of IC <strong>and</strong> DNA directly hope to benefit<br />
the further research on the interaction of<br />
pathological changes part of DNA <strong>and</strong><br />
the antineoplastic.<br />
Acknowledgments<br />
This work was supported by Xiangtan<br />
University (08XZX11).<br />
References<br />
(1) Dat1. W.L. William, U. Carlos, <strong>and</strong> V.N.<br />
Elliot, Circ. Res. 3, 570–574 (1955).<br />
(2) K.T. Chung, S.E. Stevens, K.T. Chung,<br />
<strong>and</strong> S.E. Stevens, Environ. Toxicol.<br />
Chem. 12, 2121–2132 (1993).<br />
(3) S.F. Chen, Y.F. Li, <strong>and</strong> C.Z. Huang, Talanta.<br />
70, 52–57 (2006).<br />
(4) C.Z. Huang, K.A. Li, <strong>and</strong> S.Y. Tong, Anal.<br />
Chem. 68, 2259–2264 (1996).<br />
(5) Z.X. Guo, L. Li, H.X. Shen, <strong>and</strong> X. Cong,<br />
Anal. Chim. Acta. 379, 45–51 (1999).<br />
(6) Z.G. Chen, W.F. Ding, Y.Z. Liang, F.L.<br />
Ren, <strong>and</strong> Y.L. Han, Microchim. Acta.<br />
150, 35–42 (2005).<br />
(7) C.Z. Huang, Y.F. Li, X.H.Huang, <strong>and</strong> M.<br />
Li, Anal. Lett. 34, 1117–1132 (2001).<br />
(8) Y.T.Wang, F.L. Zhao, K.A. Li, <strong>and</strong> S.Y.<br />
Tong, Anal. Chim. Acta. 396, 75–81<br />
(1999).<br />
(9) C.Z. Huang, Y.F. Li, X.H. Huang, <strong>and</strong> M.<br />
Li, Analyst 125, 1267–1272 (2001).<br />
(10) Y. Liu, C.Q. Ma, K.A. Li, <strong>and</strong> S.Y. Tong ,<br />
Anal. Biochem. 268, 187–192 (1999).<br />
(11) W.J. Zhang, H.P. Xu, C.X. Xue, X.G.<br />
Chen, <strong>and</strong> Z.D. Hu, Anal. Lett. 34, 553<br />
(2001).<br />
(12) Y.M. Hao <strong>and</strong> H.X. Shen, Anal. Chim.<br />
Acta. 413, 87–94 (2000).<br />
(13) Y.M. Hao <strong>and</strong> H.X. Shen, Anal. Chim.<br />
Acta. 422, 159–166 (2000).<br />
(14) G.W. Song, Z.X Cai, <strong>and</strong> L.Li, Microchim.<br />
Acta. 144, 23 (2004).<br />
(15) R.T. Li, J.H. Yang, C.X. Sun, X. Wu, X.B.<br />
Gao, <strong>and</strong> Y. Liu, Microchim. Acta. 147,<br />
105–109(2004).<br />
(16) Z.G. Chen, W.F. Ding, F.L. Ren, J.B. Liu,<br />
Y.L. Han, <strong>and</strong> Y.Z. Liang, Anal. Chim.<br />
Acta. 550, 204–209 (2005).<br />
(17) J. Yguerabide, G. Bee, K. Yamout, L.<br />
Korb, <strong>and</strong> J. Beck, Nat. Gen. 23, 67–68<br />
(1999).<br />
(18) P.Bao, A.G. Frutos, C. Greef, J. Lahiri,<br />
U. Muller, T.C. Peterson, L. Warden,<br />
<strong>and</strong> X.Y. Xie, Anal Chem. 74, 1792–<br />
1797 (2002).<br />
(19) X.M. Chen, C.Q. Cai, J.X. Zeng, Y.Z.<br />
Liao, <strong>and</strong> H.A. Luo, Spectrochim. Acta<br />
Part A 61, 1783-1788 (2005).<br />
(20) X.M. Chen, C.Q. Cai, H.A. Luo, <strong>and</strong><br />
G.H. Zhang, Spectrochim. Acta Part A<br />
61, 2215–2221 (2005).<br />
(21) M.Wang, J.H. Yang, X. Wu, <strong>and</strong> F.<br />
Huang, Anal. Chim. Acta. 422, 151–<br />
158 (2000).<br />
(22) B.A. Thomas <strong>and</strong> J.C. Birdsall, J. Am.<br />
Med. Ass. 69, 1747–1752 (1917).<br />
(23) O.S. Lowsley <strong>and</strong> T.J.Kirwin, Clin.<br />
Urol. 45 (1940).<br />
(24) Z. Chen, J. Liu, <strong>and</strong> D. Luo, Biochemistry<br />
Experiments (Chinese University of<br />
Sciences <strong>and</strong> Technology Press, Hefei,<br />
China, 1994).<br />
(25) S.P. Liu, X.L. Hu, H.Q. Long, <strong>and</strong> L.<br />
Fan, Science in China (series B) 32, 18<br />
(2002).<br />
(26) R.T. Liu, J.H. Yang, X. Wu, <strong>and</strong> T. Wu,<br />
Anal. Chim. Acta. 448, 85–91 (2001).<br />
(27) R.F. Pasternack <strong>and</strong> P.J. Collings, Science<br />
269, 935–939 (1995).<br />
(28) C.Z. Huang, Y.F. Li, <strong>and</strong> X.D. Liu, Anal.<br />
Chim. Acta. 375, 89–97 (1998).<br />
(29) F.S. Collins, A. Patrinos, E. Jordan, A.<br />
Chakravi, R. Gestelan, <strong>and</strong> L.R. Walters,<br />
Science 282, 682–689 (1998).<br />
(30) K.B. Jacobson <strong>and</strong> J. Turner, Toxicology<br />
16, 1(1980).<br />
(31) C.Z. Huang, X.D. Lu, <strong>and</strong> Y.F. Li, Anal.<br />
Chim. Acta. 494, 11–19 (2003).<br />
(32) H.Li, X.Y. Yue, J.Z. Wu, <strong>and</strong> J. Liu, Acta<br />
Chim. Sinica. 61, 245 (2003).<br />
Changqun Cai, Xiaoming Chen,<br />
<strong>and</strong> Hang Gong are <strong>with</strong> Xiangtan<br />
University, Xiangtan, Hunan, China.<br />
For more information on this topic,<br />
please <strong>vis</strong>it our homepage at:<br />
www.spectroscopyonline.com
www.spectroscopyonline.com<br />
November 2009 <strong>Spectroscopy</strong> 23(11) 43<br />
Information for Authors<br />
<strong>Spectroscopy</strong> welcomes manuscripts that describe techniques <strong>and</strong> applications of all forms of spectroscopy<br />
<strong>and</strong> that are of immediate interest to users in industry, academia, <strong>and</strong> government. Send manuscripts to:<br />
David Walsh, <strong>Spectroscopy</strong>, Woodbridge Corporate Plaza, 485 Route 1 South, Building F, First Floor, Iselin,<br />
NJ 08830, USA. Telephone: (732) 346-3082, fax: (732) 596- 0003, e-mail: david.walsh@advanstar.com.<br />
Manuscripts are reviewed <strong>with</strong> the underst<strong>and</strong>ing that they have not been published previously <strong>and</strong> are not<br />
under consideration for publication elsewhere. Authors are responsible for all statements made in their work. All<br />
manuscripts are subject to peer review <strong>and</strong> copyediting. Authors of accepted papers will have an opportunity to<br />
review galleys. Upon acceptance, copyright of the manuscript is transferred to <strong>Spectroscopy</strong>. If illustrations or<br />
other material in a manuscript have been published previously, the author is responsible for obtaining permission<br />
to republish.<br />
Editorial Focus<br />
Because <strong>Spectroscopy</strong> is directed to experienced researchers <strong>and</strong> applications personnel in the field of spectroscopy,<br />
avoid describing details or techniques that are common knowledge among such specialists.<br />
Two types of articles are suitable for <strong>Spectroscopy</strong>:<br />
Feature articles survey current techniques or emerging technologies. Manuscripts should be 10–15 pages<br />
(2500–3750 words) long. We urge authors to submit a proposal to the editor before completing a manuscript.<br />
Technical articles describe improved methods or improvements in techniques. Papers should be 5–10 pages<br />
(1250–2500 words) long <strong>and</strong> should be of immediate relevance to spectroscopy users. Manuscripts should be presented<br />
in an abbreviated scientific format <strong>and</strong> should include the following:<br />
Abstract:<br />
Very brief. Mention subjects studied, methods used, principal observations made, <strong>and</strong> conclusions reached.<br />
Introduction:<br />
Without repeating published information, discuss the relationship of your work to previously published work.<br />
Describe the novelty or importance of the research presented.<br />
Experimental<br />
Present enough information that an experienced spectroscopist would be able to reproduce the work. List<br />
those components of the experimental design that are of a specialized nature, including equipment manufacturers<br />
names <strong>and</strong> locations in parentheses after reference to specific types of equipment. Do not list equipment,<br />
reagents, or procedures that are normally found in the laboratory or that are common knowledge in the field.<br />
Results <strong>and</strong> discussion<br />
Focus your comments on the needs of users of spectroscopy, stress the practical importance of your findings.<br />
Conclusion<br />
Summarize the main points of your article, state important conclusions or recommendations.<br />
Manuscript Preparation<br />
For papers <strong>with</strong> multiple authors, designate a single author to h<strong>and</strong>le correspondence. Include this author’s<br />
full mailing address, telephone number, fax number, <strong>and</strong> e-mail address in the cover letter that accompanies the<br />
manuscript. Before submitting the completed work, authors are urged to review manuscripts for clarity of expression,<br />
details of grammar, <strong>and</strong> typographical accuracy.<br />
When submitting the manuscript, please include a high-resolution Word document or PDF to provide higher<br />
quality graphics <strong>and</strong> to avoid having to provide new graphics later in the process.<br />
Illustrations<br />
If illustrations or other material in a manuscript have been published previously, the author is responsible<br />
for obtaining permission to republish. Refer to photographs, line drawings, <strong>and</strong> graphs in the text using arabic<br />
numerals in consecutive order (Figure 1, Figure 2, etc.). Omit all illustrations that do not enhance the readers<br />
underst<strong>and</strong>ing of the text. Line drawings, graphs, <strong>and</strong> charts should be submitted <strong>with</strong> a resolution of 300 dpi<br />
or better, preferably in jpeg or tif format. Lines of graphs must be solid <strong>and</strong> heavy enough to remain legible after<br />
reduction. Provide peak labels <strong>and</strong> identification. Provide a figure caption for each illustration.<br />
Tables<br />
Refer to tables in the text by roman numerals in consecutive order (Table I, Table II, etc.). Every table <strong>and</strong> each<br />
column must have an appropriate heading. Table number <strong>and</strong> title must be placed in a continuous heading above<br />
the data presented. Omit tables that contain information already included in the text.<br />
References<br />
Literature citations in the text must be indicated by arabic numerals in parentheses. Number each reference<br />
separately in the order in which it appears in the text. List cited references at the end of the manuscript in the<br />
order of their appearance in the text not alphabetically. Designate submitted articles as in press only if they are<br />
formally accepted for publication <strong>and</strong> give the future volume number <strong>and</strong> year, if possible. Use the term “unpublished<br />
work” otherwise, giving the date when the work was completed. For personal communications, include<br />
name <strong>and</strong> date.<br />
Use the following format for references:<br />
(1) T.L. Einmann <strong>and</strong> C. Champaign, Science 387, 922–930 (1981).<br />
(2) E. Mitosouki <strong>and</strong> F.G. Pleinum, in Natural Cell-Mediated Immunity Against<br />
Infection, W.J. Kinman, Ed. (Plenum Press, New York, 1980), pp. 345-376.
44 <strong>Spectroscopy</strong> 24(11) November 2009 www.spectroscopyonline.com<br />
PRODUCT RESOURCES<br />
FT-IR spectrometer<br />
The IRAffinity-1 FT-IR spectrometer from Shimadzu Scientific Instruments<br />
is designed for high-precision IR analysis to confirm, identify,<br />
<strong>and</strong> detect foreign matter in various application areas. According to<br />
the company, the instrument features long-term stability, protection<br />
from humidity, increased reliability, <strong>and</strong> analysis-support programs.<br />
Shimadzu Scientific Instruments, Inc., Columbia, MD;<br />
www.ssi.shimadzu.co<br />
Raman microscope<br />
Renishaw’s inVia Raman microscope can be used for nondestructive<br />
testing of sperm DNA for assessing<br />
the healthiness of sperm cells.<br />
The instrument can be customized<br />
to integrate optical tweezing,<br />
which enables researchers to<br />
immobilize sperm cells <strong>with</strong> a<br />
tightly focused laser beam. The<br />
resulting Raman spectra contain<br />
information about the vibrations<br />
of molecules <strong>with</strong>in the sperm<br />
cells <strong>and</strong> can be used to assess<br />
the state of its DNA. Renishaw,<br />
Hoffman Estates, IL; www.renishaw.com<br />
ICP–OES application note<br />
An application note from<br />
Thermo Fisher Scientific details<br />
the use of the company’s iCAP<br />
6200 ICP spectrometer for<br />
the analysis of toxic trace elements<br />
in children’s toys. The<br />
note assesses the instrument’s<br />
performance for the routine<br />
analysis of toy samples for<br />
consumer safety verification. It also discusses the analysis of three<br />
samples extracted from a toy car <strong>and</strong> a baby rattle, each prepared in<br />
accordance <strong>with</strong> ASTM F963-08 <strong>and</strong> EN71 Part 3.<br />
Thermo Fisher Scientific, Waltham, MA;<br />
www.thermo.com/icap<br />
<strong>UV</strong>–<strong>vis</strong>–NIR spectrometer<br />
The model LF-500 fiber-optic input <strong>UV</strong>–<strong>vis</strong>–NIR spectrometer from<br />
Spectral Evolution has a wavelength range<br />
of 320–1100 nm. According to the company,<br />
the fiber input provides a variety<br />
of sample-interfacing configurations <strong>and</strong><br />
the optical system matched fiber optics<br />
provides an optimal signal-to-noise ratio.<br />
Other features include on-board calibration,<br />
storage, shutter–dark scan, <strong>and</strong><br />
automatic exposure. Applications include<br />
water–moisture, refining, petrochemical,<br />
food, <strong>and</strong> polymers. Spectral Evolution, North Andover, MA;<br />
www.spectralevolution.com<br />
ICP application note<br />
An application note from Teledyne Leeman Labs discusses the<br />
analysis of edible oils using the<br />
company’s Prodigy High Dispersion<br />
ICP system. The note demonstrates<br />
the instrument’s ability to determine<br />
trace elements in the oils. According<br />
to the publication, the instrument<br />
provides high sensitivity <strong>and</strong> dispersion<br />
for accurate <strong>and</strong> reliable results.<br />
Teledyne Leeman Labs,<br />
Hudson, NH; www.leemanlabs.com<br />
Mercury analyzer<br />
The model RA-3000 Gold+AFS mercury analyzer from Nippon<br />
Instruments is designed for<br />
EPA Method 1631E. According<br />
to the company, the analyzer<br />
simplifies low- to subparts-per-million<br />
mercury<br />
analysis <strong>and</strong> reduces reagent<br />
consumption <strong>and</strong> wastes.<br />
Nippon Instruments<br />
North America,<br />
College Station, TX;<br />
www.hg-nic.us<br />
NIR minispectrometer<br />
Hamamatsu’s TG long-wavelength type near-infrared minispectrometer<br />
is a polychromator<br />
integrated <strong>with</strong> optical elements<br />
<strong>and</strong> an image sensor.<br />
Light to be measured is guided<br />
into the instrument’s entrance<br />
port via an optical fiber, <strong>and</strong><br />
the spectrum is measured <strong>with</strong><br />
the built-in image sensor <strong>and</strong><br />
output from a USB port to a<br />
PC for data acquisition. According to the company, the instrument’s<br />
sensitivity extends to wavelengths as long as 2.55 µm.<br />
Hamamatsu Corporation, Bridgewater, NJ;<br />
www.hamamatsu.com<br />
Si-PIN detector<br />
Moxtek’s XPIN detector platform <strong>and</strong> MXDPP-200 digital pulse<br />
processor can be combined <strong>with</strong><br />
an X-ray source to assemble an<br />
X-ray fluorescence workstation.<br />
The detector reportedly has a 625-<br />
µm-thick Si-PIN diode, an ultralownoise<br />
JFET, a multilayer collimator,<br />
<strong>and</strong> a preamplifier, <strong>and</strong> is internally<br />
cooled <strong>with</strong> a two-stage thermoelectric<br />
cooler. The digital pulse<br />
processor is supplied <strong>with</strong> a USB<br />
computer–software interface.<br />
Moxtek, Inc., Orem, UT;<br />
www.moxtek.com
www.spectroscopyonline.com<br />
November 2009 <strong>Spectroscopy</strong> 24(11) 45<br />
Mercury analyzer<br />
The Hydra IIAA cold vapor atomic absorption mercury analyzer from<br />
Teledyne Leeman Labs is designed to<br />
provide high performance <strong>and</strong> enable<br />
increased productivity. According to<br />
the company, the analyzer has a 1-<br />
ppt detection limit, a 1-min/sample<br />
throughput rate, <strong>and</strong> a 270-position<br />
autosampler. The instrument reportedly<br />
can be configured for direct<br />
solids analysis as well as liquids<br />
analysis for sample matrices such as<br />
environmental, biological, foods, <strong>and</strong><br />
petrochemicals. Teledyne Leeman Labs,<br />
Hudson, NH; www.leemanlabs.com<br />
FT-IR<br />
spectrometer<br />
PerkinElmer’s Spectrum 65<br />
FT-IR spectrometer is based<br />
on the company’s Dynascan<br />
interferometer. According to<br />
the company, the instrument<br />
is designed for the everyday<br />
IR analyst.<br />
PerkinElmer, Inc.,<br />
Shelton, CT;<br />
www.perkinelmer.com<br />
Raman microscope<br />
The μSense-I Raman microscope from Enwave is designed for nonconfocal<br />
microscopic Raman applications<br />
in academic, industrial, <strong>and</strong><br />
research laboratories. The microscope<br />
reportedly provides a spectral<br />
resolution of −6 cm −1 , a spectral<br />
range of ~250–2350 nm, <strong>and</strong> spatial<br />
resolution of better than 5 μm.<br />
The instrument’s Raman unit can<br />
be detached from the microscope<br />
<strong>and</strong> used as a portable instrument.<br />
Enwave Optronics, Inc.,<br />
Irvine, CA; www.enwaveopt.com<br />
ATR accessory<br />
The GladiATR Vision attenuated<br />
total reflection device is designed<br />
to couple small-area infrared<br />
analysis <strong>with</strong> simultaneous viewing.<br />
According to the company, the<br />
device’s diamond crystal enables<br />
analysis of thick or nontransparent<br />
samples. The accessory reportedly<br />
is compatible <strong>with</strong> most FT-IR spectrometers.<br />
Pike Technologies,<br />
Madison, WI; www.piketech.com<br />
Elemental <strong>and</strong> depth profile analyzer<br />
The GD-Profiler 2 instrument from HORIBA Scientific couples a flexible<br />
RF glow discharge excitation source to optics for elemental bulk,<br />
surface, <strong>and</strong> depth-profile analysis. The system, which is designed<br />
for surface <strong>and</strong> interface characterization, uses controlled sputtering<br />
of a material by a 4-mm diameter<br />
plasma <strong>and</strong> analyzes all elements<br />
including gases (N, O, H, Cl) as a<br />
function of the depth in conductive or<br />
nonconductive layers <strong>and</strong> substrates.<br />
According to the company, depth<br />
resolution can be as high as 1 nm,<br />
<strong>with</strong> a sputtering rate as fast as several<br />
micrometers per minute.<br />
HORIBA Scientific, Edison, NJ;<br />
www.horiba.com/scientific<br />
Fluorescence spectrophotometer<br />
The model F-2700 fluorescence<br />
spectrophotometer<br />
from Hitachi High Technologies<br />
America is available in<br />
st<strong>and</strong>alone <strong>and</strong> PC-controlled<br />
configurations. The instrument<br />
reportedly features a<br />
signal-to-noise ratio of 800<br />
rms for the Raman b<strong>and</strong> of<br />
water at a 5-nm b<strong>and</strong>width. According to the company, <strong>with</strong> PC control<br />
the scan speed is as high as 12,000 nm/min, which makes the<br />
spectrophotometer useful for 3-D scan measurements. Accessories<br />
available for the instrument include automatic sampling, quantum<br />
yield measurement, spectral correction, <strong>and</strong> a 100-μL microcell.<br />
Hitachi High Technologies America, Inc., Pleasanton, CA;<br />
www.hitachi-hta.com/spectroscopy<br />
ICP accessory<br />
The Niagara PLUS accessory is designed to double the productivity of<br />
an ICP-OES or ICP-MS instrument. The accessory reportedly eliminates<br />
most of the sample cycle overhead required for accurate analysis by<br />
combining a switching valve <strong>and</strong> flow injection feature. According to<br />
the company, the accessory reduces sample contact <strong>with</strong> consumables.<br />
Glass Expansion, Inc., Pocasset, MA; www.geicp.com<br />
FT-NIR analyzer<br />
ABB’s MB3600-PH FT-NIR analyzer is designed for QA–QC,<br />
research <strong>and</strong> development, raw materials identification <strong>and</strong> qualification,<br />
NIR method development, <strong>and</strong> at-line PAT applications.<br />
According to the company, the benchtop analyzer can be fitted <strong>with</strong><br />
various accessories for measurements in pharmaceutical <strong>and</strong> life<br />
science applications. ABB, Quebec, Canada;<br />
www.abb.com/analytical
46 <strong>Spectroscopy</strong> 24(11) November 2009 www.spectroscopyonline.com<br />
Imaging spectrograph <strong>and</strong> scanning<br />
monochromator<br />
The SureSpectrum imaging<br />
spectrograph <strong>and</strong> scanning<br />
monochromator from Bruker<br />
Optics features a triple grating<br />
turret, st<strong>and</strong>ard motorized<br />
slits, <strong>and</strong> dual exit ports.<br />
The instrument is available in<br />
250-mm <strong>and</strong> 500-mm focal<br />
lengths.<br />
Bruker Optics, Inc.,<br />
Billerica, MA;<br />
www.brukeroptics.com<br />
Silicon drift detectors<br />
The XR-100SDD <strong>and</strong> X-123 SDD silicon drift detectors from Amptek<br />
are designed for X-ray fluorescence<br />
applications ranging from<br />
OEM h<strong>and</strong>held instruments to<br />
bench-top analyzers. According<br />
to the company, the silicon drift<br />
detectors enable extremely<br />
high count rate applications <strong>and</strong><br />
require no liquid nitrogen. The<br />
detectors reportedly are housed<br />
inside the same TO-8 package<br />
as the company’s other<br />
detectors. Amptek, Inc.,<br />
Bedford, MA; www.amptek.com<br />
Fiber-optic vacuum feedthrough<br />
Fiberguide Industries’ fiber-optic vacuum feedthroughs are available<br />
in unlimited cell, flange, <strong>and</strong> port designs. The feedthroughs<br />
reportedly can be used at temperatures as high as 175 °C (250<br />
°C for pigtail) using the company’s<br />
gold-coated fiber. Fiber selection<br />
includes Multimode, Single<br />
Mode, <strong>and</strong> Polarization Maintaining<br />
<strong>with</strong> core diameters ranging from<br />
50–1500 μm <strong>and</strong> connector interface<br />
selections of SMA (st<strong>and</strong>ard),<br />
ST, FC, <strong>and</strong> ferrule style. According<br />
to the company, the fibers are<br />
helium leak-tested <strong>and</strong> certified to<br />
10 −7 torr. Fiberguide Industries,<br />
Stirling, NJ; www.fiberguide.com<br />
Air-jet sieve<br />
The AS 200 Jet air-jet sieve is designed for separating light, fine<br />
particle sizes. The sieve is intended for use <strong>with</strong> 203-mm (8-in.)<br />
diameter sieves as small as 10<br />
μm (~1200 mesh). According<br />
to the company, an industrial<br />
vacuum generates a jet of air that<br />
evenly disperses the particles via<br />
a slotted nozzle. The material that<br />
passes through the sieve is either<br />
discarded through the vacuum or<br />
collected in an attached cyclone.<br />
The procedure reportedly<br />
requires 2–3 min.<br />
Retsch, Inc., Newtown, PA;<br />
www.retsch-us.com<br />
XRF inorganic elemental analyzer<br />
EDAX’s Orbis micro-XRF inorganic elemental analyzer is designed to<br />
perform nondestructive measurements that require minimal sample<br />
preparation <strong>and</strong> provide improved<br />
sensitivity over SEM <strong>and</strong> EDS<br />
methods. The analyzer includes a<br />
motorized turret for coaxial sample<br />
view <strong>and</strong> X-ray analysis. Primary<br />
beam filters can be used <strong>with</strong><br />
X-ray optics for micrometer to millimeter<br />
spot elemental analyses.<br />
Applications include forensics,<br />
materials analysis, failure analysis,<br />
<strong>and</strong> elemental imaging.<br />
EDAX Inc., Mahwah, NJ;<br />
www.edax.com<br />
DPSS laser<br />
Cobolt’s Zouk CW DPSS laser is designed for <strong>UV</strong>-range applications.<br />
The 355-nm laser reportedly<br />
has an output power of 10 mW<br />
<strong>and</strong> a TEM00 beam. According<br />
to the company, the laser is an<br />
alternative to the Ar/Kr-ion <strong>UV</strong><br />
lines, quasi-CW <strong>UV</strong> lasers, <strong>and</strong><br />
diode lasers for applications<br />
such as fluorescence-based bioanalysis,<br />
semiconductor inspection,<br />
Raman spectroscopy, <strong>and</strong><br />
microlithography.<br />
Cobolt AB, Stockholm, Sweden;<br />
www.cobolt.se<br />
Custom st<strong>and</strong>ards<br />
Custom inorganic st<strong>and</strong>ards from Inorganic Ventures can be used<br />
in applications such as ICP, ICP-MS,<br />
atomic absorption, <strong>and</strong> ion chromatography.<br />
Each st<strong>and</strong>ard is supplied<br />
<strong>with</strong> a certificate of analysis that<br />
details NIST traceability, certified<br />
values, <strong>and</strong> trace impurities. The st<strong>and</strong>ards<br />
reportedly are manufactured in<br />
a “green” manufacturing facility.<br />
Inorganic Ventures, Lakewood, NJ;<br />
www.inorganicventures.com<br />
Confocal mapping FLIM system<br />
The DynaMac fluorescence lifetime imaging microscopy system<br />
from HORIBA Scientific is a<br />
confocal mapping system<br />
designed to provide information<br />
about molecular motion,<br />
sizes, local environment,<br />
interaction, <strong>and</strong> binding <strong>with</strong><br />
respect to microscopic locations<br />
in a sample. The st<strong>and</strong>alone<br />
system reportedly<br />
includes software control<br />
of light source, camera, pinholes,<br />
<strong>and</strong> filters. HORIBA<br />
Scientific, Edison, NJ;<br />
www.horiba.com/scientific
www.spectroscopyonline.com<br />
November 2009 <strong>Spectroscopy</strong> 24(11) 47<br />
Calendar of Events<br />
January 2010<br />
Contact: Email: info@ifpacnet.org,<br />
Website: www.ifpac.com;<br />
November 2009<br />
16–19 Eastern Analytical Symposium<br />
<strong>and</strong> Exposition, Garden State Exhibit<br />
Center, Somerset, NJ;<br />
Contact: E-mail: askEAS@eas.org,<br />
Website: www.eas.org<br />
18–22 16th Annual Meeting SFRBM<br />
— The Society for Free Radical<br />
Biology <strong>and</strong> Medicine,<br />
San Francisco, CA<br />
Contact: Society for Free Radical Biology<br />
<strong>and</strong> Medicine, 8365 Keystone Crossing,<br />
Suite 107, Indianapolis, IN 46240; Tel.<br />
(317) 205-9482;<br />
E-mail: info@sfrbm.org, Website: www.<br />
sfrbm.org/annualMeetings.cfm<br />
19–23 30th SETAC Annual Meeting,<br />
New Orleans, LA<br />
Contact: Society of Environmental<br />
Toxicology <strong>and</strong> Chemistry, 1010 N. 12th<br />
Avenue, Pensacola, FL 32501-3367;<br />
E-mail: setac@setac.org,<br />
Website: www.setac.org<br />
24–27 LILS — Light in Life Sciences<br />
Conference, Melbourne, Australia;<br />
Contact: Website: http://www.physics.<br />
mq.edu.au/research/fluoronet/LILS09/<br />
30 – 4 December, Materials Research<br />
Society, Boston, Massachusetts<br />
Contact: E-mail: info@mrs.org, Ph:<br />
(724)779-3003, Fax: (724)779-8313; Website:<br />
www.mrs.org<br />
December 2009<br />
2–5 10th European Meeting on<br />
Environmental Chemistry (EMEC10),<br />
Limoges, France<br />
Contact: EMEC 10 Secretary;<br />
E-mail: emec10@unilim.fr<br />
Website: www.unilim.fr<br />
3–9 2010 Winter Conference on<br />
Plasma Spectrochemistry,<br />
Fort Myers, FL<br />
Contact: Ramon Barnes, University Research<br />
Institute for Analytical Chemistry,<br />
P.O. Box 666, Hadley, MA 01035-0666;<br />
E-mail: wc2010@chem.umass.edu,<br />
Website: http://icpinformation.org<br />
22–25 Sanibel Conference on Mass<br />
Spectrometry, “From Structural Biology<br />
to Drug Discovery: New Roles<br />
for Mass Spectrometry of <strong>Nucleic</strong><br />
<strong>Acid</strong>s,” St. Petersburg Beach, Florida<br />
Contact: ASMS, 2019 Galisteo Street,<br />
Building I-1, Santa Fe, NM 87505, E-mail:<br />
asms@asms.org, Ph: (505)989-4517 or<br />
(800)825-3220, Fax: (412)825-3224;<br />
Website: www.asms.org<br />
23–28 SPIE Photonics West,<br />
San Francisco, CA<br />
Contact: Tel. (888) 504-8171; E-mail:<br />
customerservice@spie.org, Website:<br />
http://spie.org/x2584.xml<br />
24–27 LabAutomation2010, Palm<br />
Springs, CA<br />
Contact: Association for Laboratory Automation,<br />
330 West State Street, Geneva,<br />
IL 60134, E-mail: Brenda Dreier, bdreier@<br />
labautomation.org, Ph: (888) 733-1252,<br />
Fax: (630) 578-0172;<br />
Website: www.labautomation.org<br />
31–February 3 Applications of Lasers<br />
for Sensing <strong>and</strong> Free Space<br />
Communications, San Diego, CA<br />
Contact: Kristin Mirabal, E-mail: kmirab@<br />
osa.org<br />
February 2010<br />
2–4 IFPAC 2010 24th International<br />
Forum Process Analytical<br />
Technology, Baltimore Marriott Waterfront,<br />
Baltimore, MD<br />
6–9 SPIE Medical Imaging<br />
San Diego, CA<br />
Contact: Website: http://spie.org/<br />
x12166.xml<br />
28–March 5 Pittcon 2010, Orl<strong>and</strong>o, FL;<br />
Contact: Website: http://www.pittcon.<br />
org<br />
March 2010<br />
3–6 IRUG9 — Ninth Biennial International<br />
Conference of the Infrared<br />
<strong>and</strong> Raman Users Group, Buenos<br />
Aires, Argentina; Contact: E-mail: irug9@<br />
qu.fcen.uba.ar, Website: www.irug9.com<br />
5–9 Defense, Security, <strong>and</strong> Sensing<br />
2010<br />
Orl<strong>and</strong>o World Center Marriott Resort &<br />
Convention Center, Orl<strong>and</strong>o, Florida.<br />
Contact:Website: http://spie.org/defense-security-sensing.xml<br />
21–25 239th ACS National Meeting &<br />
Exposition, San Francisco, CA;<br />
Contact: Website: http://portal.acs.org<br />
May 2010<br />
2–6 Joint Conference of the 14th In<br />
Vivo ESR/EPR <strong>Spectroscopy</strong> & Imaging<br />
<strong>and</strong> the 11th International EPR<br />
Spin Trapping/Spin Labeling (EPR<br />
2010), San Juan, Puerto Rico<br />
Contact: Antonio E. Alegria, Ph.D, Scientific<br />
Secretariat, Department of Chemistry,<br />
University of Puerto Rico at Humacao,<br />
Estacion Postal CUH, Humacao, P. R.<br />
00791, E-mail: antonio.alegria1@upr.<br />
edu, Ph: (787)309-6961, Fax: (787)850-<br />
9422. Website: www.epr2010.org
48 <strong>Spectroscopy</strong> 24(11) November 2009 www.spectroscopyonline.com<br />
16–21 CLEO/QELS 2010, Laser Science<br />
to Photonic Applications,<br />
San Jose McEnery Convention Center,<br />
San Jose, CA<br />
Contact: E-mail: Angela Stark, astark@<br />
osa.org; Website: www.cleoconference.<br />
org<br />
17–19 SPIE Scanning Microscopy<br />
2010, Monterey, CA;<br />
Contact: Website: www.spie.org/<br />
x19036.xml<br />
23–27 58th ASMS Conference on<br />
Mass Spectrometry (ASMS 2010),<br />
Salt Lake City, UT<br />
Contact: American Society for Mass<br />
Spectrometry, 2019 Galisteo Street,<br />
Building I, Santa Fe, NM 87505; Tel.<br />
(505) 989-4517, Fax: (505) 989-1073;<br />
E-mail: office@asms.org<br />
June 2010<br />
6–9 5th Nordic Conference on<br />
Plasma Spectrochemistry, Loen,<br />
Norway<br />
Contact: Yngvar Thomassen, National<br />
Institute of Occupational Health, P.O. Box<br />
8149 DEP, N-0033 Oslo, Norway; E-mail:<br />
yngvar.thomassen@stami.no,<br />
Website: www.nordicplasma.com<br />
28–July 2 Laser Optics 2010,<br />
St. Petersburg, Russia<br />
Contact: E-mail: conf2010@laseroptics.<br />
ru, Website: www.laseroptics.ru<br />
July 2010<br />
13–16 International Symposium on<br />
Luminescence Spectrometry, Prague,<br />
Czech Republic<br />
Contact: Symposium Secretariat,<br />
CZECH-IN s.r.o., Professional Event &<br />
Congress Organiser, Prague Congress<br />
Centre, Prague, Czech Republic, E-mail:<br />
info@isls2010.org, Ph: 420 261 174 301,<br />
Fax: 420 261 174 307;<br />
Website: www.isls.org<br />
31–August 6 IDRC 2010 —<br />
International Diffuse Reflectance<br />
Conference, Chambersburg, PA<br />
Contact: Website: www.idrc-chambersburg.org/<br />
August 2010<br />
1–5 SPIE Optics & Photonics 2010,<br />
San Diego, CA<br />
Contact: Website: www.spie.org<br />
2–6 Denver X-Ray Conference 2010,<br />
Denver Marriott Tech Center Hotel<br />
Denver, CO<br />
Contact: Website: http://www.dxcidd.<br />
com/
www.spectroscopyonline.com<br />
November 2009 <strong>Spectroscopy</strong> 24(11) 49<br />
8–13 XXII International Conference<br />
on Raman <strong>Spectroscopy</strong>, Boston, MA<br />
Contact: ICORS 2010 Conference Office,<br />
2019 Galisteo Street, Building I-1, Santa<br />
Fe, NM 87505; Tel. (505) 989-4735; E-<br />
mail: office@icors2010.org<br />
September 2010<br />
13–17 Laser Induced Breakdown<br />
<strong>Spectroscopy</strong> 2010 (LIBS 2010),<br />
Memphis, TN<br />
Contact: Dr. Jagdish P Singh, E-mail:<br />
LIBS2010@icet.msstate.edu, Ph:<br />
(662)325-7375, Fax: (662)325-8465;<br />
19–22 European Symposium on<br />
Polymer <strong>Spectroscopy</strong> (ESOPS 18),<br />
Zadar, Croatia;<br />
Contact: Prof. Vesna Volovšek, ESOPS<br />
18 Secretariat, Faculty of Chemical Engineering<br />
<strong>and</strong> Technology, University of<br />
Zagreb, Zagreb, Croatia, E-mail: esops18@<br />
fkit.hr, Ph: 385 1 4597135.<br />
Website: www.esops18.com<br />
21–24 SRI 2010 — 50th U.S. National<br />
Conference on Synchrotron Radiation<br />
Instrumentation, Argonne, IL;<br />
Contact: Website: www.lightsources.org<br />
October 2010<br />
17–21 Annual Conference of the Federation<br />
of Analytical Chemistry <strong>and</strong><br />
<strong>Spectroscopy</strong> Societies (FACSS),<br />
Raleigh, NC<br />
Contact: FACSS, P.O. Box 24379, Santa<br />
Fe, New Mexico 87502, E-mail: facss@<br />
facss.org, Ph: (505)820-1648, Fax:<br />
(505)989-1073; Website: www.facss.org<br />
18–21 26th Annual International<br />
Conference on Contaminated Soils,<br />
Sediments, <strong>and</strong> Water, Amherst, MA<br />
Contact: Denise Leonard, Environmental<br />
Health Sciences, N344 Morrill, University<br />
of Massachusetts, 639 North Pleasant<br />
Street, Amherst, MA 01003-9298;<br />
E-mail: dleonard@schoolph.umass.edu<br />
Website: www.umass-soils.com<br />
November 2010<br />
7–11 31st SETAC Annual Meeting,<br />
Portl<strong>and</strong>, OR<br />
Contact: Society of Environmental Toxicology<br />
<strong>and</strong> Chemistry, 1010 N. 12th Avenue,<br />
Pensacola, FL 32501-3367; E-mail:<br />
setac@setac.org, Website: www.setac.org<br />
TBA Eastern Analytical Symposium<br />
<strong>and</strong> Exposition, Garden State Exhibit<br />
Center, Somerset, NJ;<br />
Contact: E-mail: askEAS@eas.org,<br />
Website: www.eas.org<br />
December 2010<br />
15–20 Pacifichem 2010, Honolulu, HI<br />
Contact: Pacifichem 2010 Congress<br />
Secretariat, c/o American Chemical<br />
Society, 1155 16th St. N.W., Washington,<br />
DC, 20036; E-mail: pacifichem@acs.org,<br />
Website: http://pacifichem.org/<br />
Please <strong>vis</strong>it our homepage at:<br />
www.spectroscopyonline.com<br />
STATEMENT OF OWNERSHIP, MANAGEMENT, AND CIRCULATION<br />
(Required by 39 USC 3685)<br />
1. Publication Title: <strong>Spectroscopy</strong><br />
2. Publication Number: 0887-6703<br />
3. Filing Date: 9/30/09<br />
4. Issue Frequency: Monthly<br />
5. Number of Issues Published Annually: 12<br />
6. Annual Subscription Price (if any): $79.95<br />
7. Complete Mailing Address of Known Office of Publication: 131 West First Street, Duluth, St.<br />
Louis County, Minnesota 55802-2065<br />
Contact Person: Peggy Olson<br />
Telephone: (218) 740-6359<br />
8. Complete Mailing Address of Headquarters or General Business Office of the Publisher: 6200<br />
Canoga Avenue, 2nd Floor, Woodl<strong>and</strong> Hills, CA 91367<br />
9. Full Names <strong>and</strong> Complete Mailing Addresses of Publisher: Michael J. Tessalone, 485F US<br />
Highway 1 S, Ste. 100, Iselin, NJ 08830-3009<br />
Editor In Chief: David Walsh, 485F US Highway 1 S, Ste. 100, Iselin, NJ 08830-3009<br />
10. This publication is owned by: Advanstar Communications Inc., 6200 Canoga Avenue, 2nd<br />
Floor, Woodl<strong>and</strong> Hills, CA 91367. The sole shareholder of Advanstar Communications Inc. is:<br />
Advanstar, Inc., whose mailing address is 6200 Canoga Avenue, 2nd Floor, Woodl<strong>and</strong> Hills, CA<br />
91367.<br />
11. Advanstar Communications Inc. is a borrower under Credit Agreements dated May 31, 2007,<br />
<strong>with</strong> various lenders as named therein from time to time. As of June 30, 2009, the agent for the<br />
lenders is: Credit Suisse, Administrative Agent, Eleven Madison Avenue, New York, NY 10010.<br />
Advanstar Communications Inc is a borrower under an agreement <strong>with</strong> VSS-AHC Holdings,<br />
LLC., 350 Park Avenue, New York, NY 10022<br />
12. Does Not Apply<br />
13. Publication Title: <strong>Spectroscopy</strong><br />
14. Issue Date for Circulation Data Below: August 2009<br />
15. Extent <strong>and</strong> Nature of Circulation<br />
Average<br />
Number Copies Number Copies of<br />
Each Issue Single Issue<br />
During<br />
Published<br />
Preceding Nearest to<br />
12 Months Filing Date<br />
A. Total Number of Copies 24,338 22,870<br />
B. Legitimate Paid <strong>and</strong>/or Requested Distribution<br />
1. Outside County Paid/Requested<br />
Mail Subscriptions Stated on PS Form 3541 21,829 19,633<br />
2. In County Paid/Requested Mail Subscriptions<br />
Stated on PS Form 3451 0 0<br />
3. Sales Through Dealers <strong>and</strong> Carriers,<br />
Street Vendors, Counter Sales, <strong>and</strong> Other<br />
Paid or Requested Distribution 45 21<br />
Outside USPS<br />
4. Requested Copies Distributed by<br />
Other Mail Classes through the USPS 0 0<br />
C. Total Paid <strong>and</strong>/or Requested Circulation 21,874 19,654<br />
D. Non-requested Distribution<br />
1. Outside County Non-requested Copies as 1,638 1,692<br />
Stated on Form 3541<br />
2. In-County Non-requested Copies 0 0<br />
Stated on PS Form 3451<br />
3. Non-requested Copies Distributed 0 0<br />
Through the USPS by Other Classes of Mail<br />
4. Non-requested Copies Distributed 784 1,483<br />
Outside the Mail<br />
E. Total Non-requested Distribution 2,422 3,175<br />
F. Total Distribution 24,296 22,829<br />
G. Copies not Distributed 42 41<br />
H. Total 24,338 22,870<br />
I. Percent Paid <strong>and</strong>/or Requested Circulation 90.03% 86.09%<br />
16. Publication for a Requester Publication is required. Will be printed in the November 2009<br />
issue of this publication.<br />
17. Name <strong>and</strong> Title of Editor, Publisher,<br />
Business Manager, or Owner: Christine Shappell, Audience Development Director<br />
Date: 9/30/2009<br />
I certify that the statements made by me above are correct <strong>and</strong> complete.
50 <strong>Spectroscopy</strong> 24(11) November 2009 www.spectroscopyonline.com<br />
®<br />
Showcase<br />
Ad Index<br />
application notes that describe techniques <strong>and</strong> applications<br />
ADVERTISER<br />
of PG# all forms of spectroscopy that are of immediate interest<br />
text_adindex 00 to users text_adindex industry, academia, <strong>and</strong> government. 00<br />
If your company is interested in participating<br />
text_adindex 00 in text_adindex this special supplement, contact:<br />
00<br />
text_adindex 00 text_adindex 00<br />
Michael J. Tessalone, Group Publisher • (732) 346-3016<br />
text_adindex 00 text_adindex 00<br />
Edward Fantuzzi, Publisher • (732) 346-3015<br />
text_adindex 00 text_adindex or<br />
00<br />
Stephanie Shaffer, East Coast Sales Manager • (508) 481-5885<br />
text_adindex 00 text_adindex 00<br />
text_adindex 00<br />
Ad Index<br />
text_adindex 00 text_adindex 00<br />
ADVERTISER PG# ADVERTISER PG#<br />
text_adindex 2008 Winter Conference on Plasma Spectrochemistry 00 48<br />
Amptek Inc. 11<br />
text_adindex Andor Technology 004<br />
Applied Spectra 25<br />
text_adindex BaySpec, Inc. 00 42<br />
Bruker Optics 19,21<br />
text_adindex EDAX, Inc. 00 29<br />
Enwave Optronics, Inc. 50<br />
text_adindex Fiberguide Industries 00 40<br />
Glass Expansion 7<br />
text_adindex Hamamatsu Corp 00 43<br />
Hellma Cells, Inc. 28<br />
text_adindex Hitachi High Technologies<br />
CV4 00<br />
IFPAC<br />
CV3<br />
Call for Application Notes<br />
<strong>Spectroscopy</strong> is planning to publish the next edition<br />
of The Application Notebook in February 2010.<br />
As always, the publication will include paid position vendor<br />
text_adindex 00<br />
text_adindex Inorganic Ventures 009<br />
LECO Corporation 22<br />
text_adindex MDC Vacuum Products, LLC 00 10<br />
Moxtek, Inc. 33<br />
text_adindex New Era Enterprises, Inc. 00 50<br />
Nippon Instruments North America 50<br />
text_adindex PerkinElmer 003<br />
Pike Technologies 5,50<br />
text_adindex StellarNet, Inc. 00 41<br />
Teledyne Leeman Labs 26,27,37,39<br />
text_adindex Thermo Scientific Elemental <strong>Analysis</strong><br />
00<br />
(part of Thermo fisher Scientific)<br />
CV2<br />
Wavelength Electronics 10