Nucleic Acid Analysis with UV-vis and NMR - Spectroscopy
Nucleic Acid Analysis with UV-vis and NMR - Spectroscopy
Nucleic Acid Analysis with UV-vis and NMR - Spectroscopy

Create successful ePaper yourself
Turn your PDF publications into a flip-book with our unique Google optimized e-Paper software.
32 <strong>Spectroscopy</strong> 24(11) November 2009 www.spectroscopyonline.com<br />
HETP (µm)<br />
60<br />
40<br />
20<br />
0<br />
0 2 4 6 8<br />
Flow Rate (mL/min)<br />
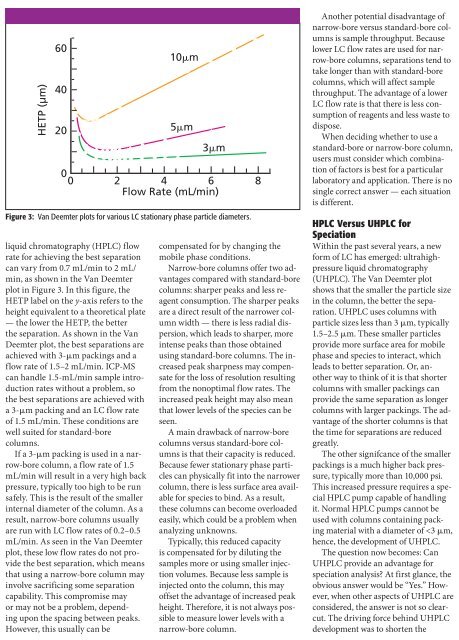
liquid chromatography (HPLC) flow<br />
rate for achieving the best separation<br />
can vary from 0.7 mL/min to 2 mL/<br />
min, as shown in the Van Deemter<br />
plot in Figure 3. In this figure, the<br />
HETP label on the y-axis refers to the<br />
height equivalent to a theoretical plate<br />
— the lower the HETP, the better<br />
the separation. As shown in the Van<br />
Deemter plot, the best separations are<br />
achieved <strong>with</strong> 3-µm packings <strong>and</strong> a<br />
flow rate of 1.5–2 mL/min. ICP-MS<br />
can h<strong>and</strong>le 1.5-mL/min sample introduction<br />
rates <strong>with</strong>out a problem, so<br />
the best separations are achieved <strong>with</strong><br />
a 3-µm packing <strong>and</strong> an LC flow rate<br />
of 1.5 mL/min. These conditions are<br />
well suited for st<strong>and</strong>ard-bore<br />
columns.<br />
If a 3-µm packing is used in a narrow-bore<br />
column, a flow rate of 1.5<br />
mL/min will result in a very high back<br />
pressure, typically too high to be run<br />
safely. This is the result of the smaller<br />
internal diameter of the column. As a<br />
result, narrow-bore columns usually<br />
are run <strong>with</strong> LC flow rates of 0.2–0.5<br />
mL/min. As seen in the Van Deemter<br />
plot, these low flow rates do not provide<br />
the best separation, which means<br />
that using a narrow-bore column may<br />
involve sacrificing some separation<br />
capability. This compromise may<br />
or may not be a problem, depending<br />
upon the spacing between peaks.<br />
However, this usually can be<br />
10m<br />
5m<br />
3m<br />
Figure 3: Van Deemter plots for various LC stationary phase particle diameters.<br />
compensated for by changing the<br />
mobile phase conditions.<br />
Narrow-bore columns offer two advantages<br />
compared <strong>with</strong> st<strong>and</strong>ard-bore<br />
columns: sharper peaks <strong>and</strong> less reagent<br />
consumption. The sharper peaks<br />
are a direct result of the narrower column<br />
width — there is less radial dispersion,<br />
which leads to sharper, more<br />
intense peaks than those obtained<br />
using st<strong>and</strong>ard-bore columns. The increased<br />
peak sharpness may compensate<br />
for the loss of resolution resulting<br />
from the nonoptimal flow rates. The<br />
increased peak height may also mean<br />
that lower levels of the species can be<br />
seen.<br />
A main drawback of narrow-bore<br />
columns versus st<strong>and</strong>ard-bore columns<br />
is that their capacity is reduced.<br />
Because fewer stationary phase particles<br />
can physically fit into the narrower<br />
column, there is less surface area available<br />
for species to bind. As a result,<br />
these columns can become overloaded<br />
easily, which could be a problem when<br />
analyzing unknowns.<br />
Typically, this reduced capacity<br />
is compensated for by diluting the<br />
samples more or using smaller injection<br />
volumes. Because less sample is<br />
injected onto the column, this may<br />
offset the advantage of increased peak<br />
height. Therefore, it is not always possible<br />
to measure lower levels <strong>with</strong> a<br />
narrow-bore column.<br />
Another potential disadvantage of<br />
narrow-bore versus st<strong>and</strong>ard-bore columns<br />
is sample throughput. Because<br />
lower LC flow rates are used for narrow-bore<br />
columns, separations tend to<br />
take longer than <strong>with</strong> st<strong>and</strong>ard-bore<br />
columns, which will affect sample<br />
throughput. The advantage of a lower<br />
LC flow rate is that there is less consumption<br />
of reagents <strong>and</strong> less waste to<br />
dispose.<br />
When deciding whether to use a<br />
st<strong>and</strong>ard-bore or narrow-bore column,<br />
users must consider which combination<br />
of factors is best for a particular<br />
laboratory <strong>and</strong> application. There is no<br />
single correct answer — each situation<br />
is different.<br />
HPLC Versus UHPLC for<br />
Speciation<br />
Within the past several years, a new<br />
form of LC has emerged: ultrahighpressure<br />
liquid chromatography<br />
(UHPLC). The Van Deemter plot<br />
shows that the smaller the particle size<br />
in the column, the better the separation.<br />
UHPLC uses columns <strong>with</strong><br />
particle sizes less than 3 µm, typically<br />
1.5–2.5 µm. These smaller particles<br />
provide more surface area for mobile<br />
phase <strong>and</strong> species to interact, which<br />
leads to better separation. Or, another<br />
way to think of it is that shorter<br />
columns <strong>with</strong> smaller packings can<br />
provide the same separation as longer<br />
columns <strong>with</strong> larger packings. The advantage<br />
of the shorter columns is that<br />
the time for separations are reduced<br />
greatly.<br />
The other signifcance of the smaller<br />
packings is a much higher back pressure,<br />
typically more than 10,000 psi.<br />
This increased pressure requires a special<br />
HPLC pump capable of h<strong>and</strong>ling<br />
it. Normal HPLC pumps cannot be<br />
used <strong>with</strong> columns containing packing<br />
material <strong>with</strong> a diameter of