Nucleic Acid Analysis with UV-vis and NMR - Spectroscopy
Nucleic Acid Analysis with UV-vis and NMR - Spectroscopy
Nucleic Acid Analysis with UV-vis and NMR - Spectroscopy

You also want an ePaper? Increase the reach of your titles
YUMPU automatically turns print PDFs into web optimized ePapers that Google loves.
38 <strong>Spectroscopy</strong> 23(11) November 2009 www.spectroscopyonline.com<br />
Intensity<br />
450<br />
400<br />
350<br />
300<br />
250<br />
200<br />
150<br />
100<br />
50<br />
0<br />
250<br />
300 350 400 450 500 550 600 650 700<br />
Wavelength (nm)<br />
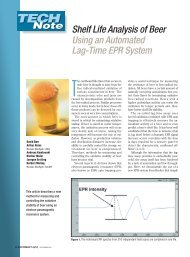
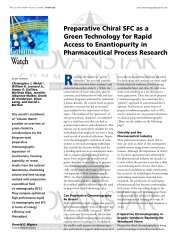
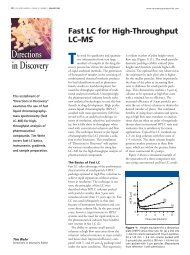
Figure 4: Effect of surfactants on the I RLS value of IC-DNA-CTMAB system. Conditions: CIC, 3.0 X<br />
10 -6 mol/L; pH, 5.47; CDNA, 500 µg/L. 1 = CTMAB, 2 = CPB, 3 = TX-100, 4 = SDBS, 5 = SDS.<br />
Surface tension (mN/m)<br />
100<br />
80<br />
60<br />
40<br />
20<br />
0<br />
1 2 3 4 5 6 7 8 9<br />
C<br />
CTMAB (10-5 )<br />
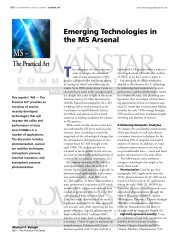
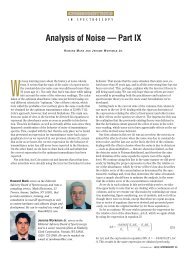
Figure 5: Effect of CTMAB concentration on surface tension. Conditions: CIC, 3.0 X 10 -6 mol/L;<br />
pH, 5.74; CDNA, 500 µg/L.<br />
I RLS<br />
450<br />
400<br />
350<br />
300<br />
250<br />
200<br />
150<br />
100<br />
50<br />
0<br />
0 0.5 1 1.5 2<br />
Indigo carmine concentration<br />
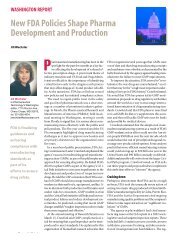
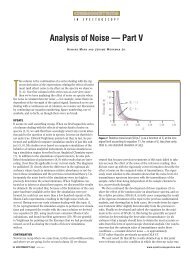
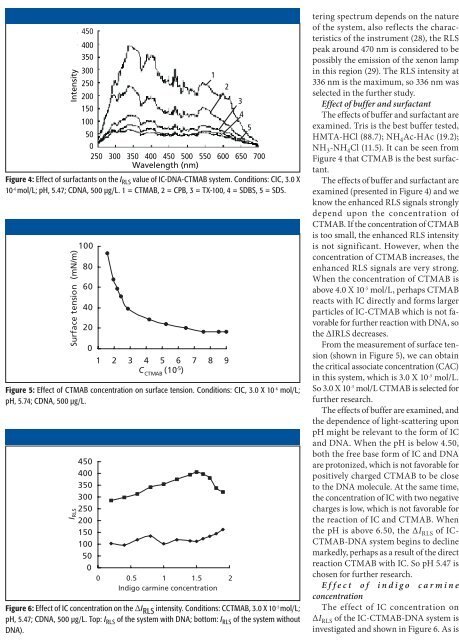
Figure 6: Effect of IC concentration on the ΔI RLS intensity. Conditions: CCTMAB, 3.0 X 10 -5 mol/L;<br />
pH, 5.47; CDNA, 500 µg/L. Top: I RLS of the system <strong>with</strong> DNA; bottom: I RLS of the system <strong>with</strong>out<br />
DNA).<br />
1<br />
2<br />
3<br />
4<br />
5<br />
tering spectrum depends on the nature<br />
of the system, also reflects the characteristics<br />
of the instrument (28), the RLS<br />
peak around 470 nm is considered to be<br />
possibly the emission of the xenon lamp<br />
in this region (29). The RLS intensity at<br />
336 nm is the maximum, so 336 nm was<br />
selected in the further study.<br />
Effect of buffer <strong>and</strong> surfactant<br />
The effects of buffer <strong>and</strong> surfactant are<br />
examined. Tris is the best buffer tested,<br />
HMTA-HCl (88.7); NH 4 Ac-HAc (19.2);<br />
NH 3 -NH 4 Cl (11.5). It can be seen from<br />
Figure 4 that CTMAB is the best surfactant.<br />
The effects of buffer <strong>and</strong> surfactant are<br />
examined (presented in Figure 4) <strong>and</strong> we<br />
know the enhanced RLS signals strongly<br />
depend upon the concentration of<br />
CTMAB. If the concentration of CTMAB<br />
is too small, the enhanced RLS intensity<br />
is not significant. However, when the<br />
concentration of CTMAB increases, the<br />
enhanced RLS signals are very strong.<br />
When the concentration of CTMAB is<br />
above 4.0 X 10 -5 mol/L, perhaps CTMAB<br />
reacts <strong>with</strong> IC directly <strong>and</strong> forms larger<br />
particles of IC-CTMAB which is not favorable<br />
for further reaction <strong>with</strong> DNA, so<br />
the ΔIRLS decreases.<br />
From the measurement of surface tension<br />
(shown in Figure 5), we can obtain<br />
the critical associate concentration (CAC)<br />
in this system, which is 3.0 X 10 -5 mol/L.<br />
So 3.0 X 10 -5 mol/L CTMAB is selected for<br />
further research.<br />
The effects of buffer are examined, <strong>and</strong><br />
the dependence of light-scattering upon<br />
pH might be relevant to the form of IC<br />
<strong>and</strong> DNA. When the pH is below 4.50,<br />
both the free base form of IC <strong>and</strong> DNA<br />
are protonized, which is not favorable for<br />
positively charged CTMAB to be close<br />
to the DNA molecule. At the same time,<br />
the concentration of IC <strong>with</strong> two negative<br />
charges is low, which is not favorable for<br />
the reaction of IC <strong>and</strong> CTMAB. When<br />
the pH is above 6.50, the ΔI RLS of IC-<br />
CTMAB-DNA system begins to decline<br />
markedly, perhaps as a result of the direct<br />
reaction CTMAB <strong>with</strong> IC. So pH 5.47 is<br />
chosen for further research.<br />
Effect of indigo carmine<br />
concentration<br />
The effect of IC concentration on<br />
ΔI RLS of the IC-CTMAB-DNA system is<br />
investigated <strong>and</strong> shown in Figure 6. As is