RSS East Of England Plan - Broads Authority
RSS East Of England Plan - Broads Authority
RSS East Of England Plan - Broads Authority

You also want an ePaper? Increase the reach of your titles
YUMPU automatically turns print PDFs into web optimized ePapers that Google loves.
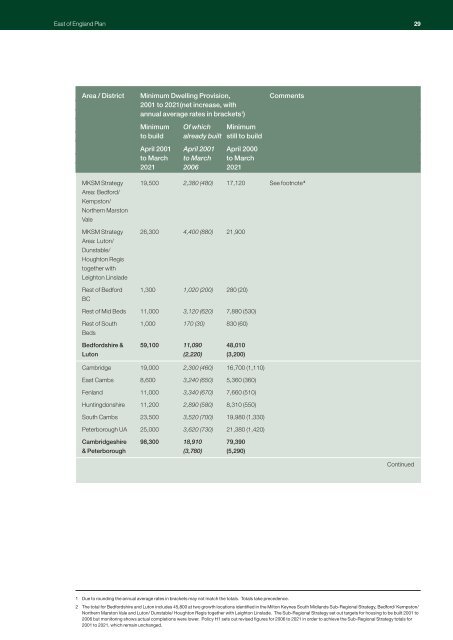
<strong>East</strong> of <strong>England</strong> <strong>Plan</strong> 29<br />
Area / District Minimum Dwelling Provision, Comments<br />
2001 to 2021(net increase, with<br />
annual average rates in brackets 1 )<br />
Minimum <strong>Of</strong> which Minimum<br />
to build already built still to build<br />
April 2001 April 2001 April 2000<br />
to March to March to March<br />
2021 2006 2021<br />
MKSM Strategy 19,500 2,380 (480) 17,120 See footnote 2<br />
Area: Bedford/<br />
Kempston/<br />
Northern Marston<br />
Vale<br />
MKSM Strategy 26,300 4,400 (880) 21,900<br />
Area: Luton/<br />
Dunstable/<br />
Houghton Regis<br />
together with<br />
Leighton Linslade<br />
Rest of Bedford 1,300 1,020 (200) 280 (20)<br />
BC<br />
Rest of Mid Beds 11,000 3,120 (620) 7,880 (530)<br />
Rest of South 1,000 170 (30) 830 (60)<br />
Beds<br />
Bedfordshire & 59,100 11,090 48,010<br />
Luton (2,220) (3,200)<br />
Cambridge 19,000 2,300 (460) 16,700 (1,110)<br />
<strong>East</strong> Cambs 8,600 3,240 (650) 5,360 (360)<br />
Fenland 11,000 3,340 (670) 7,660 (510)<br />
Huntingdonshire 11,200 2,890 (580) 8,310 (550)<br />
South Cambs 23,500 3,520 (700) 19,980 (1,330)<br />
Peterborough UA 25,000 3,620 (730) 21,380 (1,420)<br />
Cambridgeshire 98,300 18,910 79,390<br />
& Peterborough (3,780) (5,290)<br />
Continued<br />
1 Due to rounding the annual average rates in brackets may not match the totals. Totals take precedence.<br />
2 The total for Bedfordshire and Luton includes 45,800 at two growth locations identified in the Milton Keynes South Midlands Sub-Regional Strategy, Bedford/ Kempston/<br />
Northern Marston Vale and Luton/ Dunstable/ Houghton Regis together with Leighton Linslade. The Sub-Regional Strategy set out targets for housing to be built 2001 to<br />
2006 but monitoring shows actual completions were lower. Policy H1 sets out revised figures for 2006 to 2021 in order to achieve the Sub-Regional Strategy totals for<br />
2001 to 2021, which remain unchanged.