Annual Report 2001-2002 - Tourism Western Australia - The ...
Annual Report 2001-2002 - Tourism Western Australia - The ...
Annual Report 2001-2002 - Tourism Western Australia - The ...

You also want an ePaper? Increase the reach of your titles
YUMPU automatically turns print PDFs into web optimized ePapers that Google loves.
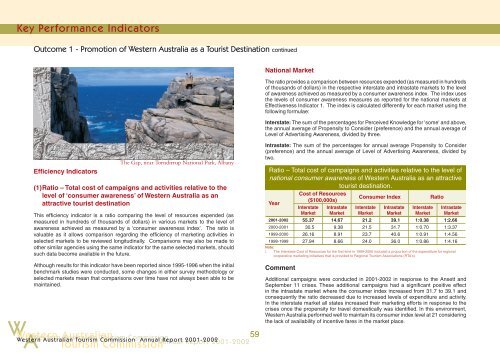
Key Performance Indicators<br />
Outcome 1 - Promotion of <strong>Western</strong> <strong>Australia</strong> as a Tourist Destination continued<br />
National Market<br />
<strong>The</strong> ratio provides a comparison between resources expended (as measured in hundreds<br />
of thousands of dollars) in the respective interstate and intrastate markets to the level<br />
of awareness achieved as measured by a consumer awareness index. <strong>The</strong> index uses<br />
the levels of consumer awareness measures as reported for the national markets at<br />
Effectiveness Indicator 1. <strong>The</strong> index is calculated differently for each market using the<br />
following formulae:<br />
Interstate: <strong>The</strong> sum of the percentages for Perceived Knowledge for 'some' and above,<br />
the annual average of Propensity to Consider (preference) and the annual average of<br />
Level of Advertising Awareness, divided by three.<br />
W A<br />
Efficiency Indicators<br />
(1) Ratio – Total cost of campaigns and activities relative to the<br />
level of ‘consumer awareness’ of <strong>Western</strong> <strong>Australia</strong> as an<br />
attractive tourist destination<br />
This efficiency indicator is a ratio comparing the level of resources expended (as<br />
measured in hundreds of thousands of dollars) in various markets to the level of<br />
awareness achieved as measured by a 'consumer awareness index'. <strong>The</strong> ratio is<br />
valuable as it allows comparison regarding the efficiency of marketing activities in<br />
selected markets to be reviewed longitudinally. Comparisons may also be made to<br />
other similar agencies using the same indicator for the same selected markets, should<br />
such data become available in the future.<br />
Although results for this indicator have been reported since 1995-1996 when the initial<br />
benchmark studies were conducted, some changes in either survey methodology or<br />
selected markets mean that comparisons over time have not always been able to be<br />
maintained.<br />
<strong>Western</strong> <strong>Australia</strong>n<br />
<strong>Tourism</strong> Commission<br />
<strong>The</strong> Gap, near Torndirrup National Park, Albany<br />
<strong>Western</strong> <strong>Australia</strong>n <strong>Tourism</strong> Commission<br />
59<br />
<strong>Annual</strong> <strong>Report</strong> <strong>2001</strong>-<strong>2002</strong>02<br />
Wester n <strong>Australia</strong>n <strong>Tourism</strong> Commission <strong>Annual</strong> <strong>Report</strong> <strong>2001</strong>-<strong>2002</strong><br />
Intrastate: <strong>The</strong> sum of the percentages for annual average Propensity to Consider<br />
(preference) and the annual average of Level of Advertising Awareness, divided by<br />
two.<br />
Ratio – Total cost of campaigns and activities relative to the level of<br />
national consumer awareness of <strong>Western</strong> <strong>Australia</strong> as an attractive<br />
tourist destination.<br />
Cost of Resources<br />
Consumer Index<br />
Ratio<br />
($100,000s)<br />
Year<br />
Interstate<br />
Market<br />
Intrastate<br />
Market<br />
Interstate<br />
Market<br />
Intrastate<br />
Market<br />
Interstate<br />
Market<br />
Intrastate<br />
Market<br />
<strong>2001</strong>-<strong>2002</strong> 55.37 14.67 21.2 39.1 1:0.38 1:2.66<br />
2000-<strong>2001</strong> 30.5 9.38 21.5 31.7 1:0.70 1:3.37<br />
1999-2000 26.16 8.91 23.7 40.6 1:0.91 1:4.56<br />
1998-1999 27.94 8.66 24.0 36.0 1:0.86 1:4.16<br />
Note:<br />
i. <strong>The</strong> Interstate Cost of Resources for the first time in 1999-2000 included a proportion of the expenditure for regional<br />
cooperative marketing initiatives that is provided to Regional <strong>Tourism</strong> Associations (RTA’s).<br />
Comment<br />
Additional campaigns were conducted in <strong>2001</strong>-<strong>2002</strong> in response to the Ansett and<br />
September 11 crises. <strong>The</strong>se additional campaigns had a significant positive effect<br />
in the intrastate market where the consumer index increased from 31.7 to 39.1 and<br />
consequently the ratio decreased due to increased levels of expenditure and activity.<br />
In the interstate market all states increased their marketing efforts in response to the<br />
crises once the propensity for travel domestically was identified. In this environment,<br />
<strong>Western</strong> <strong>Australia</strong> performed well to maintain its consumer index level at 21 considering<br />
the lack of availability of incentive fares in the market place.
![Annual Report 2002 - 2003 [pdf ] - Tourism Western Australia](https://img.yumpu.com/27124309/1/186x260/annual-report-2002-2003-pdf-tourism-western-australia.jpg?quality=85)

![Our Direction in China 2012 - 2015 [pdf ] - Tourism Western Australia](https://img.yumpu.com/27124271/1/184x260/our-direction-in-china-2012-2015-pdf-tourism-western-australia.jpg?quality=85)

![Naturebank Program 2011 [pdf ] - Tourism Western Australia](https://img.yumpu.com/27124244/1/184x260/naturebank-program-2011-pdf-tourism-western-australia.jpg?quality=85)