Annual Report 2001-2002 - Tourism Western Australia - The ...
Annual Report 2001-2002 - Tourism Western Australia - The ...
Annual Report 2001-2002 - Tourism Western Australia - The ...

You also want an ePaper? Increase the reach of your titles
YUMPU automatically turns print PDFs into web optimized ePapers that Google loves.
Key Performance Indicators<br />
Outcome 2 - An Enhanced <strong>Tourism</strong> Industry, Infrastructure and Product Base continued<br />
Efficiency Indicators<br />
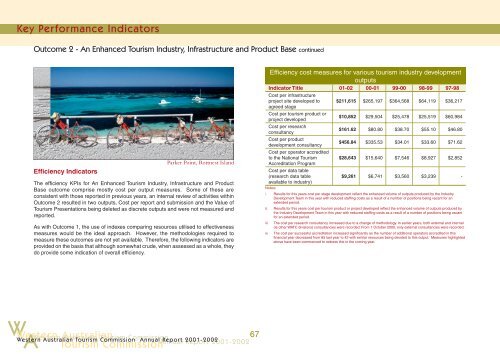
Parker Point, Rottnest Island<br />
<strong>The</strong> efficiency KPIs for An Enhanced <strong>Tourism</strong> Industry, Infrastructure and Product<br />
Base outcome comprise mostly cost per output measures. Some of these are<br />
consistent with those reported in previous years, an internal review of activities within<br />
Outcome 2 resulted in two outputs, Cost per report and submission and the Value of<br />
<strong>Tourism</strong> Presentations being deleted as discrete outputs and were not measured and<br />
reported.<br />
As with Outcome 1, the use of indexes comparing resources utilised to effectiveness<br />
measures would be the ideal approach. However, the methodologies required to<br />
measure these outcomes are not yet available. <strong>The</strong>refore, the following indicators are<br />
provided on the basis that although somewhat crude, when assessed as a whole, they<br />
do provide some indication of overall efficiency.<br />
Efficiency cost measures for various tourism industry development<br />
outputs<br />
Indicator Title 01-02 00-01 99-00 98-99 97-98<br />
Cost per infrastructure<br />
project site developed to<br />
agreed stage<br />
Cost per tourism product or<br />
project developed<br />
Cost per research<br />
consultancy<br />
Cost per product<br />
development consultancy<br />
Cost per operator accredited<br />
to the National <strong>Tourism</strong><br />
Accreditation Program<br />
Cost per data table<br />
(research data table<br />
available to industry)<br />
Notes:<br />
$211,615 $265,197 $364,568 $64,119 $36,217<br />
$10,852 $29,504 $25,478 $25,519 $60,984<br />
$161.62 $80.80 $38.70 $55.10 $46.80<br />
$456.84 $335.53 $34.01 $33.60 $71.62<br />
$28,643 $15,640 $7,546 $8,927 $2,852<br />
$9,261 $6,741 $3,560 $3,239 -<br />
i. Results for this years cost per stage development reflect the enhanced volume of outputs produced by the Industry<br />
Development Team in this year with reduced staffing costs as a result of a number of positions being vacant for an<br />
extended period.<br />
ii.<br />
iii.<br />
iv.<br />
Results for this years cost per tourism product or project developed reflect the enhanced volume of outputs produced by<br />
the Industry Development Team in this year with reduced staffing costs as a result of a number of positions being vacant<br />
for an extended period.<br />
<strong>The</strong> cost per research consultancy increased due to a change of methodology. In earlier years, both external and internal<br />
(ie other WATC divisions) consultancies were recorded. From 1 October 2000, only external consultancies were recorded.<br />
<strong>The</strong> cost per successful accreditation increased significantly as the number of additional operators accredited in this<br />
financial year decreased from 85 last year to 42 with similar resources being devoted to this output. Measures highlighted<br />
above have been commenced to redress this in the coming year.<br />
W A<br />
<strong>Western</strong> <strong>Australia</strong>n<br />
<strong>Tourism</strong> Commission<br />
<strong>Western</strong> <strong>Australia</strong>n <strong>Tourism</strong> Commission<br />
67<br />
<strong>Annual</strong> <strong>Report</strong> <strong>2001</strong>-<strong>2002</strong>02<br />
Wester n <strong>Australia</strong>n <strong>Tourism</strong> Commission <strong>Annual</strong> <strong>Report</strong> <strong>2001</strong>-<strong>2002</strong>
![Annual Report 2002 - 2003 [pdf ] - Tourism Western Australia](https://img.yumpu.com/27124309/1/186x260/annual-report-2002-2003-pdf-tourism-western-australia.jpg?quality=85)

![Our Direction in China 2012 - 2015 [pdf ] - Tourism Western Australia](https://img.yumpu.com/27124271/1/184x260/our-direction-in-china-2012-2015-pdf-tourism-western-australia.jpg?quality=85)
![Naturebank Program 2011 [pdf ] - Tourism Western Australia](https://img.yumpu.com/27124244/1/184x260/naturebank-program-2011-pdf-tourism-western-australia.jpg?quality=85)