Annual Report 2001-2002 - Tourism Western Australia - The ...
Annual Report 2001-2002 - Tourism Western Australia - The ...
Annual Report 2001-2002 - Tourism Western Australia - The ...

You also want an ePaper? Increase the reach of your titles
YUMPU automatically turns print PDFs into web optimized ePapers that Google loves.
Key Performance Indicators<br />
Outcome 1 - Promotion of <strong>Western</strong> <strong>Australia</strong> as a Tourist Destination continued<br />
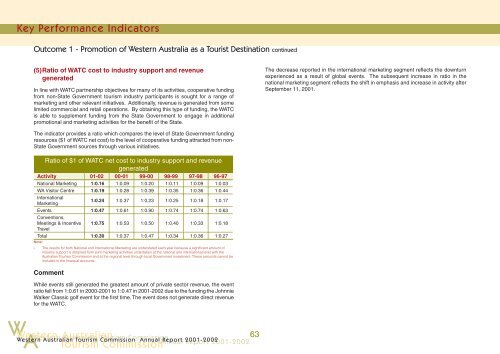
(5) Ratio of WATC cost to industry support and revenue<br />
generated<br />
In line with WATC partnership objectives for many of its activities, cooperative funding<br />
from non-State Government tourism industry participants is sought for a range of<br />
marketing and other relevant initiatives. Additionally, revenue is generated from some<br />
limited commercial and retail operations. By obtaining this type of funding, the WATC<br />
is able to supplement funding from the State Government to engage in additional<br />
promotional and marketing activities for the benefit of the State.<br />
<strong>The</strong> decrease reported in the international marketing segment reflects the downturn<br />
experienced as a result of global events. <strong>The</strong> subsequent increase in ratio in the<br />
national marketing segment reflects the shift in emphasis and increase in activity after<br />
September 11, <strong>2001</strong>.<br />
<strong>The</strong> indicator provides a ratio which compares the level of State Government funding<br />
resources ($1 of WATC net cost) to the level of cooperative funding attracted from non-<br />
State Government sources through various initiatives.<br />
Ratio of $1 of WATC net cost to industry support and revenue<br />
generated<br />
Activity 01-02 00-01 99-00 98-99 97-98 96-97<br />
National Marketing 1:0.16 1:0.09 1:0.20 1:0.11 1:0.09 1:0.03<br />
WA Visitor Centre 1:0.19 1:0.28 1:0.39 1:0.35 1:0.36 1:0.44<br />
International<br />
Marketing<br />
1:0.24 1:0.37 1:0.23 1:0.25 1:0.18 1:0.17<br />
Events 1:0.47 1:0.61 1:0.90 1:0.74 1:0.74 1:0.63<br />
Conventions,<br />
Meetings & Incentive<br />
Travel<br />
1:0.75 1:0.53 1:0.50 1:0.40 1:0.33 1:0.18<br />
Total 1:0.30 1:0.37 1:0.47 1:0.34 1:0.36 1:0.27<br />
Note:<br />
i. <strong>The</strong> results for both National and International Marketing are understated each year because a significant amount of<br />
industry support is obtained from joint marketing activities undertaken at the national and international level with the<br />
<strong>Australia</strong>n <strong>Tourism</strong> Commission and at the regional level through local Government investment. <strong>The</strong>se amounts cannot be<br />
included in the financial accounts.<br />
Comment<br />
While events still generated the greatest amount of private sector revenue, the event<br />
ratio fell from 1:0.61 in 2000-<strong>2001</strong> to 1:0.47 in <strong>2001</strong>-<strong>2002</strong> due to the funding the Johnnie<br />
Walker Classic golf event for the first time. <strong>The</strong> event does not generate direct revenue<br />
for the WATC.<br />
W A<br />
<strong>Western</strong> <strong>Australia</strong>n<br />
<strong>Tourism</strong> Commission<br />
<strong>Western</strong> <strong>Australia</strong>n <strong>Tourism</strong> Commission<br />
63<br />
<strong>Annual</strong> <strong>Report</strong> <strong>2001</strong>-<strong>2002</strong>02<br />
Wester n <strong>Australia</strong>n <strong>Tourism</strong> Commission <strong>Annual</strong> <strong>Report</strong> <strong>2001</strong>-<strong>2002</strong>
![Annual Report 2002 - 2003 [pdf ] - Tourism Western Australia](https://img.yumpu.com/27124309/1/186x260/annual-report-2002-2003-pdf-tourism-western-australia.jpg?quality=85)

![Our Direction in China 2012 - 2015 [pdf ] - Tourism Western Australia](https://img.yumpu.com/27124271/1/184x260/our-direction-in-china-2012-2015-pdf-tourism-western-australia.jpg?quality=85)
![Naturebank Program 2011 [pdf ] - Tourism Western Australia](https://img.yumpu.com/27124244/1/184x260/naturebank-program-2011-pdf-tourism-western-australia.jpg?quality=85)