PDF file: Annual Report 2002/2003 - Scottish Crop Research Institute
PDF file: Annual Report 2002/2003 - Scottish Crop Research Institute
PDF file: Annual Report 2002/2003 - Scottish Crop Research Institute

You also want an ePaper? Increase the reach of your titles
YUMPU automatically turns print PDFs into web optimized ePapers that Google loves.
SH43<br />
SL03<br />
SH44<br />
SH12<br />
B20<br />
SL22<br />
B47<br />
B01<br />
B07<br />
B19<br />
B14<br />
SM06<br />
Genes to Products<br />
Diversity of wild barley in ‘Evolution Canyon’<br />
J.R. Russell, R.C. Meyer, C.A. Hackett, P. Lawrence, G.R. Young, B.P. Forster & W. Powell<br />
Lower Nahal Oren is a seasonally dry canyon on<br />
Mount Carmel in Israel. Although the geology of<br />
the canyon is uniform the opposing slopes, facing<br />
north and south, vary substantially in the amount of<br />
sunlight received. The south facing slope is hot and<br />
dry and characterised by a savannah ecosystem with<br />
typically African flora and fauna; the north facing<br />
slope is cooler and covered by a dense oak forest with<br />
associated European flora and fauna, hence the name<br />
“Evolution Canyon”. Genetic diversity has been studied<br />
in several species in “Evolution Canyon”, but wild<br />
barley, Hordeum spontaneum is of particular interest as<br />
it grows on both slopes.<br />
The wild barley population in “Evolution Canyon”<br />
has been sampled by our collaborator, Prof. Eviatar<br />
Nevo (University of Haifa, Israel) at seven stations on<br />
a transect across the canyon: North High, North<br />
Middle, North Low, Canyon Bottom, South Low,<br />
South Middle and South High. Genetic diversity has<br />
been studied using single sequence repeat (SSR) variation<br />
in both nuclear and chloroplast DNA of 275<br />
plants. Over 200 alleles were detected for 19 nuclear<br />
SSR loci and, in addition, 12 chloroplast haplotypes<br />
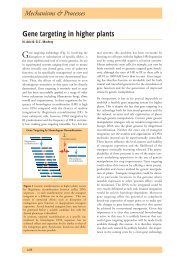
were detected in the population. A phylogenetic tree<br />
was constructed from the data: the branches of all<br />
individuals from the north facing slope have been<br />
coloured red, south facing slope individuals green<br />
branches and canyon bottom individuals blue (Figure<br />
1). The tree shows that nuclear SSR variation in the<br />
canyon is non-randomly distributed, as there is a<br />
strong tendency for individuals to cluster together<br />
according to slope of origin. We have also colourcoded<br />
the 12 chloroplast haplotypes red, green, blue<br />
etc. and have placed these at the end of the branches<br />
of the phylogenetic tree. Linkage disequilibrium is<br />
evident between the nuclear and chloroplast data as<br />
colour-coded branches and disks match up in the<br />
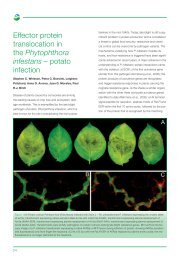
majority of cases. Inter-slope contrasts for chloroplast<br />
haplotypes can be seen clearly when the frequency of<br />
the two most common haplotypes (red and green) is<br />
superimposed on the collection sites in the canyon<br />
(Figure 2). The pie charts shows a clear swing in haplotype<br />
dominance from one side of the canyon to the<br />
other.<br />
0.1<br />
The inter-slope patterns of nuclear and chloroplast<br />
genetic variation suggest adaptive divergence to contrasting<br />
environmental conditions. Of the two slopes,<br />
greater SSR variation was found in the less stressed,<br />
north facing slope. In other studies, using anonymous<br />
genetic markers such as RAPDs and AFLPs, the opposite<br />
was found. The apparent discrepancy is probably<br />
due to the fact that SSRs sample a different portion of<br />
the genome as they are associated with genic regions.<br />
SSRs may, therefore, provide a valuable tool in searching<br />
for genes involved in adaptation and species divergence.<br />
Figure 1 Phenogram of the genetic relationships among<br />
seven H. spontaneum subpopulations in “Evolution<br />
Canyon” based on UPGMA method branches are<br />
coloured based on their slope, SFS (green), NFS (red)<br />
and bottom (blue). Chloroplast haplotypes are<br />
represented by coloured disks, haplotypes A (green), C<br />
(red) and D (blue).<br />
NH<br />
NM<br />
NL<br />
Figure 2 Chloroplast variation for haplotypes A (green),<br />
and C (red) in ‘Evolution Canyon’.<br />
B<br />
SL<br />
SM<br />
SH<br />
115