A regional perspective on poverty in Myanmar - United Nations ...
A regional perspective on poverty in Myanmar - United Nations ...
A regional perspective on poverty in Myanmar - United Nations ...

Create successful ePaper yourself
Turn your PDF publications into a flip-book with our unique Google optimized e-Paper software.
Poverty <strong>in</strong> <strong>Myanmar</strong> 10<br />
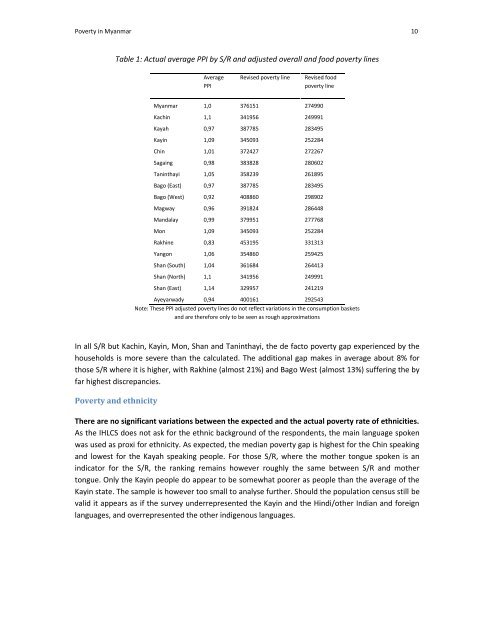
Table 1: Actual average PPI by S/R and adjusted overall and food <strong>poverty</strong> l<strong>in</strong>es<br />
Average<br />
PPI<br />
Revised <strong>poverty</strong> l<strong>in</strong>e<br />
Revised food<br />
<strong>poverty</strong> l<strong>in</strong>e<br />
<strong>Myanmar</strong> 1,0 376151 274990<br />
Kach<strong>in</strong> 1,1 341956 249991<br />
Kayah 0,97 387785 283495<br />
Kay<strong>in</strong> 1,09 345093 252284<br />
Ch<strong>in</strong> 1,01 372427 272267<br />
Saga<strong>in</strong>g 0,98 383828 280602<br />
Tan<strong>in</strong>thayi 1,05 358239 261895<br />
Bago (East) 0,97 387785 283495<br />
Bago (West) 0,92 408860 298902<br />
Magway 0,96 391824 286448<br />
Mandalay 0,99 379951 277768<br />
M<strong>on</strong> 1,09 345093 252284<br />
Rakh<strong>in</strong>e 0,83 453195 331313<br />
Yang<strong>on</strong> 1,06 354860 259425<br />
Shan (South) 1,04 361684 264413<br />
Shan (North) 1,1 341956 249991<br />
Shan (East) 1,14 329957 241219<br />
Ayeyarwady 0,94 400161 292543<br />
Note: These PPI adjusted <strong>poverty</strong> l<strong>in</strong>es do not reflect variati<strong>on</strong>s <strong>in</strong> the c<strong>on</strong>sumpti<strong>on</strong> baskets<br />
and are therefore <strong>on</strong>ly to be seen as rough approximati<strong>on</strong>s<br />
In all S/R but Kach<strong>in</strong>, Kay<strong>in</strong>, M<strong>on</strong>, Shan and Tan<strong>in</strong>thayi, the de facto <strong>poverty</strong> gap experienced by the<br />
households is more severe than the calculated. The additi<strong>on</strong>al gap makes <strong>in</strong> average about 8% for<br />
those S/R where it is higher, with Rakh<strong>in</strong>e (almost 21%) and Bago West (almost 13%) suffer<strong>in</strong>g the by<br />
far highest discrepancies.<br />
Poverty and ethnicity<br />
There are no significant variati<strong>on</strong>s between the expected and the actual <strong>poverty</strong> rate of ethnicities.<br />
As the IHLCS does not ask for the ethnic background of the resp<strong>on</strong>dents, the ma<strong>in</strong> language spoken<br />
was used as proxi for ethnicity. As expected, the median <strong>poverty</strong> gap is highest for the Ch<strong>in</strong> speak<strong>in</strong>g<br />
and lowest for the Kayah speak<strong>in</strong>g people. For those S/R, where the mother t<strong>on</strong>gue spoken is an<br />
<strong>in</strong>dicator for the S/R, the rank<strong>in</strong>g rema<strong>in</strong>s however roughly the same between S/R and mother<br />
t<strong>on</strong>gue. Only the Kay<strong>in</strong> people do appear to be somewhat poorer as people than the average of the<br />
Kay<strong>in</strong> state. The sample is however too small to analyse further. Should the populati<strong>on</strong> census still be<br />
valid it appears as if the survey underrepresented the Kay<strong>in</strong> and the H<strong>in</strong>di/other Indian and foreign<br />
languages, and overrepresented the other <strong>in</strong>digenous languages.