A regional perspective on poverty in Myanmar - United Nations ...
A regional perspective on poverty in Myanmar - United Nations ...
A regional perspective on poverty in Myanmar - United Nations ...

Create successful ePaper yourself
Turn your PDF publications into a flip-book with our unique Google optimized e-Paper software.
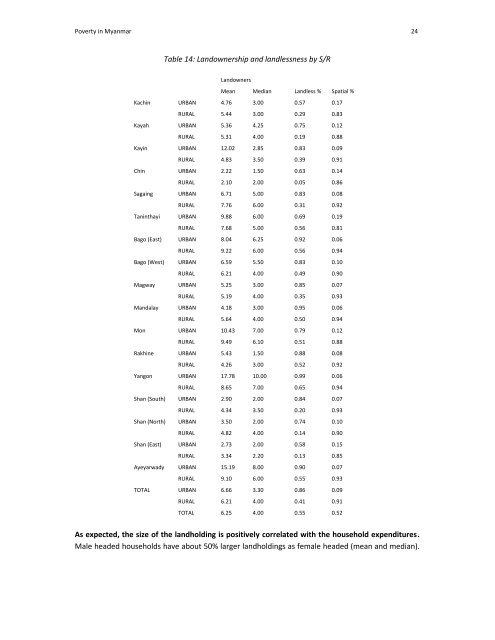
Poverty <strong>in</strong> <strong>Myanmar</strong> 24<br />
Table 14: Landownership and landlessness by S/R<br />
Landowners<br />
Mean Median Landless % Spatial %<br />
Kach<strong>in</strong> URBAN 4.76 3.00 0.57 0.17<br />
RURAL 5.44 3.00 0.29 0.83<br />
Kayah URBAN 5.36 4.25 0.75 0.12<br />
RURAL 5.31 4.00 0.19 0.88<br />
Kay<strong>in</strong> URBAN 12.02 2.85 0.83 0.09<br />
RURAL 4.83 3.50 0.39 0.91<br />
Ch<strong>in</strong> URBAN 2.22 1.50 0.63 0.14<br />
RURAL 2.10 2.00 0.05 0.86<br />
Saga<strong>in</strong>g URBAN 6.71 5.00 0.83 0.08<br />
RURAL 7.76 6.00 0.31 0.92<br />
Tan<strong>in</strong>thayi URBAN 9.88 6.00 0.69 0.19<br />
RURAL 7.68 5.00 0.56 0.81<br />
Bago (East) URBAN 8.04 6.25 0.92 0.06<br />
RURAL 9.22 6.00 0.56 0.94<br />
Bago (West) URBAN 6.59 5.50 0.83 0.10<br />
RURAL 6.21 4.00 0.49 0.90<br />
Magway URBAN 5.25 3.00 0.85 0.07<br />
RURAL 5.19 4.00 0.35 0.93<br />
Mandalay URBAN 4.18 3.00 0.95 0.06<br />
RURAL 5.64 4.00 0.50 0.94<br />
M<strong>on</strong> URBAN 10.43 7.00 0.79 0.12<br />
RURAL 9.49 6.10 0.51 0.88<br />
Rakh<strong>in</strong>e URBAN 5.43 1.50 0.88 0.08<br />
RURAL 4.26 3.00 0.52 0.92<br />
Yang<strong>on</strong> URBAN 17.78 10.00 0.99 0.06<br />
RURAL 8.65 7.00 0.65 0.94<br />
Shan (South) URBAN 2.90 2.00 0.84 0.07<br />
RURAL 4.34 3.50 0.20 0.93<br />
Shan (North) URBAN 3.50 2.00 0.74 0.10<br />
RURAL 4.82 4.00 0.14 0.90<br />
Shan (East) URBAN 2.73 2.00 0.58 0.15<br />
RURAL 3.34 2.20 0.13 0.85<br />
Ayeyarwady URBAN 15.19 8.00 0.90 0.07<br />
RURAL 9.10 6.00 0.55 0.93<br />
TOTAL URBAN 6.66 3.30 0.86 0.09<br />
RURAL 6.21 4.00 0.41 0.91<br />
TOTAL 6.25 4.00 0.55 0.52<br />
As expected, the size of the landhold<strong>in</strong>g is positively correlated with the household expenditures.<br />
Male headed households have about 50% larger landhold<strong>in</strong>gs as female headed (mean and median).