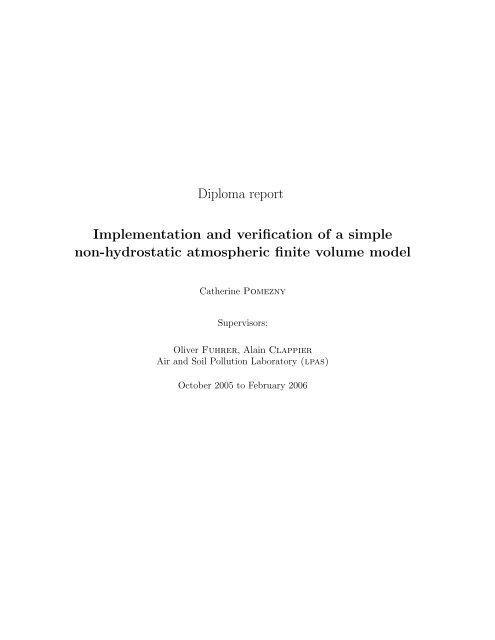
Diploma report Implementation and verification of a simple ... - LPAS
Diploma report Implementation and verification of a simple ... - LPAS
Diploma report Implementation and verification of a simple ... - LPAS

You also want an ePaper? Increase the reach of your titles
YUMPU automatically turns print PDFs into web optimized ePapers that Google loves.
<strong>Diploma</strong> <strong>report</strong><br />
<strong>Implementation</strong> <strong>and</strong> <strong>verification</strong> <strong>of</strong> a <strong>simple</strong><br />
non-hydrostatic atmospheric finite volume model<br />
Catherine Pomezny<br />
Supervisors:<br />
Oliver Fuhrer, Alain Clappier<br />
Air <strong>and</strong> Soil Pollution Laboratory (lpas)<br />
October 2005 to February 2006
Contents<br />
1 Introduction 4<br />
2 Formulation 4<br />
2.1 Continuous equations . . . . . . . . . . . . . . . . . . . . . . . . . . . . . . . 4<br />
2.1.1 Hyperbolic systems . . . . . . . . . . . . . . . . . . . . . . . . . . . . . 4<br />
2.1.2 Derivation <strong>of</strong> Euler equations . . . . . . . . . . . . . . . . . . . . . . . 5<br />
3 <strong>Implementation</strong> 8<br />
3.1 Finite volume discretization . . . . . . . . . . . . . . . . . . . . . . . . . . . . 8<br />
3.2 Stability <strong>and</strong> convergence . . . . . . . . . . . . . . . . . . . . . . . . . . . . . 11<br />
3.2.1 Consistency . . . . . . . . . . . . . . . . . . . . . . . . . . . . . . . . . 11<br />
3.2.2 Stability . . . . . . . . . . . . . . . . . . . . . . . . . . . . . . . . . . . 11<br />
3.3 Numerical fluxes . . . . . . . . . . . . . . . . . . . . . . . . . . . . . . . . . . 13<br />
3.3.1 Flux Averaging Scheme . . . . . . . . . . . . . . . . . . . . . . . . . . 13<br />
3.3.2 Central Difference Scheme . . . . . . . . . . . . . . . . . . . . . . . . . 13<br />
3.3.3 Lax-Friedrichs Method . . . . . . . . . . . . . . . . . . . . . . . . . . . 13<br />
3.3.4 Richtmeyer Two-Step Lax-Wendr<strong>of</strong>f Method . . . . . . . . . . . . . . 14<br />
3.4 Time integration . . . . . . . . . . . . . . . . . . . . . . . . . . . . . . . . . . 14<br />
3.4.1 Forward Scheme . . . . . . . . . . . . . . . . . . . . . . . . . . . . . . 15<br />
3.4.2 Leapfrog Scheme . . . . . . . . . . . . . . . . . . . . . . . . . . . . . . 15<br />
3.4.3 Third-order Runge-Kutta Scheme . . . . . . . . . . . . . . . . . . . . . 15<br />
3.5 Dimensional splitting . . . . . . . . . . . . . . . . . . . . . . . . . . . . . . . . 16<br />
3.6 Initial conditions . . . . . . . . . . . . . . . . . . . . . . . . . . . . . . . . . . 16<br />
3.6.1 Gas dynamics (c = 1) . . . . . . . . . . . . . . . . . . . . . . . . . . . 17<br />
3.6.2 Unstratified atmosphere (g = 0) . . . . . . . . . . . . . . . . . . . . . 17<br />
3.6.3 Stratified atmosphere (N = const) . . . . . . . . . . . . . . . . . . . . 17<br />
3.7 Boundary conditions . . . . . . . . . . . . . . . . . . . . . . . . . . . . . . . . 18<br />
3.7.1 Periodic boundary conditions . . . . . . . . . . . . . . . . . . . . . . . 19<br />
3.7.2 Solid wall boundary conditions . . . . . . . . . . . . . . . . . . . . . . 19<br />
3.7.3 Solid wall with hydrostatic pressure . . . . . . . . . . . . . . . . . . . 20<br />
3.7.4 Solid wall with background . . . . . . . . . . . . . . . . . . . . . . . . 20<br />
3.7.5 Prolongation <strong>of</strong> hydrostatic balance . . . . . . . . . . . . . . . . . . . 20<br />
3.8 Damping terms . . . . . . . . . . . . . . . . . . . . . . . . . . . . . . . . . . . 21<br />
3.8.1 Time filtering . . . . . . . . . . . . . . . . . . . . . . . . . . . . . . . . 21<br />
3.8.2 Spatial filtering . . . . . . . . . . . . . . . . . . . . . . . . . . . . . . . 21<br />
4 Results 23<br />
4.1 Comparison <strong>of</strong> different methods . . . . . . . . . . . . . . . . . . . . . . . . . 23<br />
4.2 Hydrostatic balance . . . . . . . . . . . . . . . . . . . . . . . . . . . . . . . . 24<br />
4.3 Sound waves . . . . . . . . . . . . . . . . . . . . . . . . . . . . . . . . . . . . 28<br />
4.4 Advection . . . . . . . . . . . . . . . . . . . . . . . . . . . . . . . . . . . . . . 31<br />
4.5 Buoyant bubble . . . . . . . . . . . . . . . . . . . . . . . . . . . . . . . . . . . 35<br />
5 Conclusion 38<br />
2
6 Acknowledgements 38<br />
A Derivation <strong>of</strong> the differential form from the integral form 39<br />
3
1 Introduction<br />
Numerical models <strong>of</strong> the atmosphere <strong>of</strong>ten solve the Euler equations on grids which conform<br />
to the geometry <strong>of</strong> the boundary, leading to irregular-shaped grid cells. Even though facilitating<br />
the formulation <strong>of</strong> the lower boundary conditions, this can lead to a myriad <strong>of</strong> numerical<br />
truncation errors related to the grid deformation, especially over steep <strong>and</strong> complex topography.<br />
Another approach is to keep the grid Cartesian, but implement a cut-cell approach for<br />
the lower boundary conditions. To this end, a straightforward two-dimensional finite volume<br />
discretization <strong>of</strong> the fully non-hydrostatic Euler equations on a Cartesian grid was developped.<br />
In the first part <strong>of</strong> this <strong>report</strong>, discretization <strong>and</strong> implementation are described. In<br />
the second part, sensitivity to numerical filtering, source term formulation <strong>and</strong> time-stepping<br />
method is discussed. Model <strong>verification</strong> is presented using hydrostatic equilibrium, sound<br />
wave <strong>and</strong> buoyant bubble simulations.<br />
2 Formulation<br />
2.1 Continuous equations<br />
The Euler equations describe the flow phenomena <strong>of</strong> compressible inviscid gas dynamics.<br />
They model the conservation <strong>of</strong> mass, momentum <strong>and</strong> energy. It is a system <strong>of</strong> nonlinear<br />
hyperbolic equations. The nonlinearity <strong>of</strong> these equations leads to some computational<br />
challenges. And the use <strong>of</strong> a method which is able to treat strong gradients is required.<br />
2.1.1 Hyperbolic systems<br />
Hyperbolic systems <strong>of</strong> partial differential equations can be used to model a large variety <strong>of</strong><br />
phenomena in different disciplines. An important class <strong>of</strong> homogeneous hyperbolic equations<br />
are the conservation laws, since many <strong>of</strong> the partial differential equations arising in fluid<br />
dynamics can be expressed as a system <strong>of</strong> conservation laws. In two dimensions, a first-order<br />
system <strong>of</strong> conservation laws has the form<br />
q t + f(q) x + g(q) z = 0, (1)<br />
where q = q(x, z, t) : R × R × R → R m is a m-components vector representing the unknown<br />
functions <strong>of</strong> conserved quantities we want to determine <strong>and</strong> f(q) <strong>and</strong> g(q) are flux functions<br />
in the x- <strong>and</strong> z-directions. This equation states that the rate <strong>of</strong> change <strong>of</strong> q at each point<br />
is determined by the fluxes at that point. Equation (1) can be rewritten in the quasilinear<br />
form<br />
q t + f ′ (q)q x + g ′ (q)q z = 0, (2)<br />
where the Jacobian matrices f ′ (q) <strong>and</strong> g ′ (q) are constant m × m real matrices. This suggests<br />
that the equation is hyperbolic if the matrix ⃗n · ⃗f ′ (q) = n x f ′ (q) + n z g ′ (q) is diagonalizable<br />
with real eigenvalues <strong>and</strong> m corresponding linearly independant eigenvectors, for any<br />
arbitrary direction ⃗n = (n x , n z ). This means that any vector in R m can be uniquely decomposed<br />
as a linear combination <strong>of</strong> these eigenvectors <strong>and</strong> this provides the decomposition into<br />
distinct waves. The corresponding eigenvalues give the speeds at which each wave propagates.<br />
4
In practice, however, many physical problems give rise to nonlinear conservation laws<br />
where f(q) <strong>and</strong> g(q) are not linear functions <strong>of</strong> q. In this case, the solution deforms as it<br />
evolves <strong>and</strong>, in particular, shock waves can form, across which the solution is discontinuous.<br />
If a function contains a discontinuity, it cannot be the solution to a partial differential equation<br />
in the classical sense, because derivatives are not defined at the discontinuity. Instead,<br />
the solution is required to satisfy the corresponding, more fundamental, integral equation.<br />
For any arbitrary spatial domain Ω, the integral formulation <strong>of</strong> a conservation law has<br />
the form<br />
∫∫<br />
∫<br />
d<br />
q(x, z, t)dxdz = − ⃗n ·<br />
dt<br />
⃗f(q)ds, (3)<br />
Ω<br />
where ∂Ω denotes the boundary <strong>of</strong> the domain, ⃗ f(q) = (f(q), g(q)) is the flux vector <strong>and</strong><br />
⃗n(s) = (n x (s), n z (s)) the outer unit normal vector to ∂Ω at point (x(s), z(s)) on ∂Ω. If each<br />
component <strong>of</strong> q represents the density <strong>of</strong> a conserved quantity, then equation (3) states that<br />
the total mass <strong>of</strong> this quantity within the domain Ω can change only due to the flux across<br />
the boundary ∂Ω <strong>of</strong> the domain.<br />
In the case where the domain is rectangular, Ω = [x 1 , x 2 ] × [z 1 , z 2 ], the normal vector<br />
always points in either the x- or z-direction. The formula (3) simplifies <strong>and</strong> the normal flux<br />
is given by f(q) along the left <strong>and</strong> right edges <strong>and</strong> by g(q) along the top <strong>and</strong> bottom :<br />
d<br />
dt<br />
∫∫<br />
Ω<br />
q(x, z, t)dxdz =<br />
∫ z2<br />
z<br />
∫ 1<br />
x2<br />
x 1<br />
∂Ω<br />
f(q(x 1 , z, t))dz −<br />
g(q(x, z 1 , t))dx −<br />
∫ z2<br />
z 1<br />
f(q(x 2 , z, t))dz +<br />
∫ x2<br />
x 1<br />
g(q(x, z 2 , t))dx. (4)<br />
In general, the derivation <strong>of</strong> conservation laws from physical principles gives first an integral<br />
form <strong>and</strong> the differential equation is derived from this by imposing smoothness assumptions<br />
on the solution (see appendix A). An important point is that, unlike the differential form,<br />
the integral form can be satisfied by piecewise-continuous functions.<br />
2.1.2 Derivation <strong>of</strong> Euler equations<br />
Euler equations consist in a system <strong>of</strong> conservation laws that model the conservation <strong>of</strong> mass,<br />
momentum <strong>and</strong> energy <strong>and</strong> where the laws <strong>of</strong> physics determine the flux functions. In this<br />
section, these equations will be derived in two dimensions.<br />
Consider a fluid in two dimensions. The description <strong>of</strong> mass flow requires two quantities:<br />
the density ρ(x, z, t) <strong>and</strong> the velocity vector ⃗u = (u(x, z, t), w(x, z, t)) at any point (x, z)<br />
<strong>and</strong> time t. Then the total mass <strong>of</strong> fluid in an area [x 1 , x 2 ] × [z 1 , z 2 ] <strong>of</strong> the region occupied<br />
by the fluid at time t is given by the integral <strong>of</strong> the density<br />
∫ z2<br />
∫ x2<br />
z 1<br />
x 1<br />
ρ(x, z, t)dxdz. (5)<br />
If there is no creation or destruction <strong>of</strong> fluid quantities within this area, then the total mass<br />
can change only due to the fluxes, or flow <strong>of</strong> particles, through the boundary <strong>of</strong> the area. We<br />
5
have<br />
∫<br />
d z2<br />
∫ x2<br />
ρ(x, z, t)dxdz = F 1 (z, t) − F 2 (z, t) + G 1 (x, t) − G 2 (x, t), (6)<br />
dt z 1 x 1<br />
where F i (z, t) are the flux functions at the lateral boundaries x i , i = 1, 2, <strong>and</strong> G i (x, t) the<br />
fluxes at the top <strong>and</strong> bottom boundaries z i , i = 1, 2. Note that F 1 (z, t) corresponds to the<br />
flux to the right <strong>and</strong> −F 2 (z, t) represents the flux to the left.<br />
Equation (6) represents the integral from <strong>of</strong> a conservation law for the mass <strong>and</strong> the<br />
flux functions are to be related to ρ(x, z, t) in order to obtain an equation that might be<br />
solvable for ρ. The mass flux through boundary x i is associated with the mass transported<br />
with velocity u through x i so that F is given by ρu. Similarly, G is given by ρw. The integral<br />
form <strong>of</strong> the conservation law becomes then<br />
d<br />
dt<br />
∫ z2<br />
∫ x2<br />
z 1<br />
x 1<br />
ρ(x, z, t)dxdz = −ρu∣ x 2<br />
− ρw∣ z 2<br />
. (7)<br />
x 1 z 1<br />
Assuming that ρ, u <strong>and</strong> w are smooth functions, the integral form <strong>of</strong> the conservation law can<br />
be transformed into a partial differential equation (see appendix A). The differential form <strong>of</strong><br />
the conservation law for ρ is then<br />
ρ t + (ρu) x + (ρw) z = 0. (8)<br />
This equation called the continuity equation models the conservation <strong>of</strong> mass.<br />
In addition to ρ(x, z, t), the velocity components u(x, z, t) <strong>and</strong> w(x, z, t) are also to be determined<br />
<strong>and</strong> two equations are needed for this. The velocities themselves are not conserved<br />
quantities, but the x-momentum ρu <strong>and</strong> the z-momentum ρw are. Each <strong>of</strong> these momenta<br />
are transported with the flow <strong>and</strong>, by analogy with the density flux in (8), this will give<br />
contributions <strong>of</strong> ((ρu)u) x + ((ρu)w) z <strong>and</strong> ((ρw)u) x + ((ρw)w) z to the x- <strong>and</strong> z-momentum<br />
respectively. Beside this, there are additional microscopic terms for the momentum fluxes<br />
that are due to the pressure in the fluid. These microscopic fluxes are caused by the fact that<br />
all nearby molecules are not moving at the same speed in a gas. Pressure variation in the<br />
x-direction, measured by p x appears in the equation for ρu, while p z appears in the equation<br />
for ρw.<br />
In the vertical direction, there are external gravity forces acting on the gas that accelerate<br />
downward individual molecules. These forces must be integrated over the domain<br />
<strong>and</strong> this contribution added to the integral conservation law for z-momentum (if z is aligned<br />
with the gravitational acceleration). Thus the differential form <strong>of</strong> the z-momentum equation<br />
will contain a source term <strong>of</strong> s = −ρ∇Φ, where Φ = gz is the gravitational potential.<br />
The differential forms <strong>of</strong> the conservation laws for momentum are then<br />
(ρu) t + (ρu 2 + p) x + (ρuw) z = 0, (9)<br />
(ρw) t + (ρwu) x + (ρw 2 + p) z = −ρ∇Φ. (10)<br />
6
In developing the conservation laws for momentum a new variable, the pressure, has been<br />
introduced. A fourth differential equation is therefore needed <strong>and</strong> a fourth conserved quantity<br />
is the energy. The total density <strong>of</strong> energy, denoted ρe, consists <strong>of</strong> two terms<br />
ρe = ρe int + 1 2 ρ(u2 + w 2 ), (11)<br />
where ρe int is the internal energy <strong>of</strong> the molecular motion <strong>and</strong> 1 2 ρ(u2 + w 2 ) is the kinetic<br />
energy <strong>of</strong> the macroscopic motion <strong>of</strong> the fluid. Moreover, the total energy ρe will contain a<br />
contribution due to the potential so that<br />
ρe → ρe + ρΦ. (12)<br />
The total energy is advected with the flow, leading to macroscopic contributions to the<br />
energy flux <strong>of</strong> (ρe)u in x-direction <strong>and</strong> (ρe)w in z-direction. In addition, the microscopic momentum<br />
fluxes lead to fluxes <strong>of</strong> energy due to work done by pressure <strong>of</strong> pu <strong>and</strong> pw respectively.<br />
The differential form <strong>of</strong> the conservation law for total energy is then<br />
(ρe + ρΦ) t + [(ρe + ρΦ + p)u] x + [(ρe + ρΦ + p)w] z = 0. (13)<br />
Taking out the terms due to the contribution <strong>of</strong> the potential energy yields<br />
(ρe) t + [(ρe + p)u] x + [(ρe + p)w] z + (ρΦu) x + (ρΦw) z = −(ρΦ) t (14)<br />
Finally, putting equations (8), (9), (10) <strong>and</strong> (14) together gives the system <strong>of</strong> Euler<br />
equations in two dimensions<br />
⎡ ⎤ ⎡ ⎤ ⎡ ⎤ ⎡ ⎤ ⎡ ⎤ ⎡ ⎤ ⎡ ⎤<br />
ρ ρu<br />
ρw 0 0 0 0<br />
⎢ ρu<br />
⎥<br />
⎣ρw⎦+<br />
⎢ ρu 2 + p<br />
⎥<br />
⎣ ρuw ⎦ + ⎢ ρuw<br />
⎥<br />
⎣ ρw 2 + p ⎦ + ⎢ 0<br />
⎥<br />
⎣ 0 ⎦ + ⎢ 0<br />
⎥<br />
⎣ 0 ⎦ = ⎢ 0<br />
⎥<br />
⎣−ρ∇Φ⎦ + ⎢ 0<br />
⎥<br />
⎣ 0 ⎦ . (15)<br />
ρe (ρe + p)u (ρe + p)w ρΦu ρΦw 0 −∂ t (ρΦ)<br />
t<br />
This can be written in the form<br />
x<br />
z<br />
x<br />
q t + f(q) x + g(q) z + f corr (q) x + g corr (q) z = s(q) + r(q), (16)<br />
with q the vector <strong>of</strong> conserved quantities ,f(q) <strong>and</strong> g(q) the flux functions <strong>and</strong> s(q) the source<br />
term due to gravity. f corr (q) <strong>and</strong> g corr (q) are the correction fluxes <strong>and</strong> r(q) is the correction<br />
term that are due to the contribution <strong>of</strong> the potential energy in the energy term.<br />
⎡ ⎤<br />
ρ<br />
q = ⎢ ρu<br />
⎥<br />
⎣ρw⎦ ,<br />
ρe<br />
⎡<br />
f(q)= ⎢<br />
⎣<br />
f corr (q)= ⎢<br />
⎣<br />
ρu<br />
ρu 2 + p<br />
ρuw<br />
(ρe + p)u<br />
⎡<br />
0<br />
0<br />
0<br />
ρΦu<br />
⎤<br />
⎥<br />
⎦ ,<br />
⎤<br />
⎥<br />
⎦ ,<br />
⎡<br />
g(q)= ⎢<br />
⎣<br />
gcorr (q)=<br />
7<br />
z<br />
ρw<br />
ρuw<br />
ρw 2 + p<br />
(ρe + p)w<br />
⎡<br />
⎢<br />
⎣<br />
0<br />
0<br />
0<br />
ρΦw<br />
⎤ ⎡ ⎤<br />
0<br />
⎥<br />
⎦ , s(q)= ⎢ 0<br />
⎥<br />
⎣−ρ∇Φ⎦<br />
0<br />
⎤ ⎡ ⎤<br />
0<br />
⎥<br />
⎦ , r(q)= ⎢ 0<br />
⎣ 0<br />
−∂ t (ρΦ)<br />
⎥<br />
⎦ . (17)
To close the system <strong>of</strong> equations, the pressure p must be specified as a function <strong>of</strong> ρ,<br />
ρu, ρw <strong>and</strong> ρe in order that the fluxes are functions <strong>of</strong> the conserved quantities alone. This<br />
additional equation is called the equation <strong>of</strong> state <strong>and</strong> depends on physical properties <strong>of</strong> the<br />
gas. For a polytropic ideal gas :<br />
ρe int =<br />
p<br />
γ − 1 , (18)<br />
where γ is the ratio <strong>of</strong> specific heats C p /C v . The equation for the pressure is then<br />
p = (ρe − 1 2 ρ(u2 + w 2 ))(γ − 1). (19)<br />
The form (15) is the differential form <strong>of</strong> the Euler equations, which holds in the usual sense<br />
only where the solutions are smooth. But the Euler equations are clearly nonlinear, since<br />
products <strong>of</strong> the unknowns appear. In this case, discontinuities can develop spontaneously in<br />
the flow quantities.<br />
As seen in the previous section, at a discontinuity in q, the partial differential equations<br />
(1) do not hold in the classical sense, while the more fundamental integral conservation<br />
laws (3) do still make sense. For this reason, classical finite difference discretization methods,<br />
in which derivatives are approximated by finite differences, can be expected to break down<br />
near discontinuities in the solution. To compute solutions containing discontinuities, finite<br />
volume discretization methods, which are based on the integral formulation instead <strong>of</strong> the<br />
differential equation, are much more effective.<br />
3 <strong>Implementation</strong><br />
3.1 Finite volume discretization<br />
In finite volume methods, the spatial domain is subdivided into grid cells (finite volumes)<br />
<strong>and</strong> cell averages <strong>of</strong> the solution q are approximated over each <strong>of</strong> these volumes. Considering<br />
a Cartesian grid, the regular grid cell C ij is given by C ij = [x i−1/2 , x i+1/2 ] × [z j−1/2 , z j+1/2 ].<br />
The numerical approximation to q over the (i, j) grid cell at time t is<br />
Q ij (t) ≈ 1<br />
∆x∆z<br />
∫∫<br />
C ij<br />
q(x, z, t)dxdz, (20)<br />
where ∆x = x i+1/2 − x i−1/2 <strong>and</strong> ∆z = z j+1/2 − z j−1/2 are the length <strong>of</strong> the cell in the x- <strong>and</strong><br />
z-directions.<br />
Approximating the integral form <strong>of</strong> the conservation law (4) over the volume <strong>of</strong> each<br />
grid cell yields<br />
∫∫<br />
∫<br />
d<br />
zj+1/2<br />
∫ zj+1/2<br />
q(x, z, t)dxdz = f(q(x<br />
dt<br />
i−1/2 , z, t))dz − f(q(x i+1/2 , z, t))dz +<br />
C ij z j−1/2<br />
z j−1/2<br />
∫ xi+1/2<br />
x i−1/2<br />
g(q(x, z j−1/2 , t))dx −<br />
8<br />
∫ xi+1/2<br />
x i−1/2<br />
g(q(x, z j+1/2 , t))dx, (21)
<strong>and</strong> this expression can be used to obtain a numerical method.<br />
A possible approach would be to develop a fully discrete method, discretized in both<br />
space <strong>and</strong> time. An other possibility, which will be done here, is to perform the discretization<br />
process in two stages, first discretizing only in space, leaving the problem continuous in time.<br />
This leads to a system <strong>of</strong> ordinary differential equations (ODEs) in time. The advantage <strong>of</strong><br />
this semidiscrete method is that the system <strong>of</strong> ODEs can then be solved by any ODE method.<br />
Rearranging expression (21) <strong>and</strong> dividing by the cell area ∆x∆z gives<br />
∫∫<br />
1 d<br />
q(x, z, t)dxdz =<br />
∆x∆z dt C ij<br />
[ ∫<br />
− 1 zj+1/2<br />
∫ zj+1/2<br />
f(q(x<br />
∆x∆z<br />
i+1/2 , z, t))dz − f(q(x i−1/2 , z, t))dz<br />
z j−1/2<br />
z j−1/2<br />
− 1<br />
∆x∆z<br />
[ ∫ xi+1/2<br />
x i−1/2<br />
∫ xi+1/2<br />
g(q(x, z j+1/2 , t))dx − g(q(x, z j−1/2 , t))dx<br />
x i−1/2<br />
]<br />
]<br />
. (22)<br />
Equation (22) is then used to derive a system <strong>of</strong> ordinary differential equations for the evolution<br />
<strong>of</strong> cell averages Q ij (t)<br />
d<br />
dt Q ij(t) = − 1<br />
∆x (F i+1/2,j − F i−1/2,j ) − 1<br />
∆z (G i,j+1/2 − G i,j−1/2 ), (23)<br />
where F i−1/2,j = F i−1/2,j (Q(t)) is some approximation to the flux along the interface x =<br />
x i−1/2 <strong>and</strong> G i,j−1/2 = G i,j−1/2 (Q(t)) an approximation along the interface z = z j−1/2 :<br />
F i−1/2,j (Q(t)) ≈ 1<br />
∆z<br />
∫ zj+1/2<br />
z j−1/2<br />
f(q(x i−1/2 , z, t))dz,<br />
G i,j−1/2 (Q(t)) ≈ 1 ∫ xi+1/2<br />
g(q(x, z<br />
∆x<br />
j−1/2 , t))dx.<br />
x i−1/2<br />
(24)<br />
Equation (23) represents a st<strong>and</strong>ard finite volume method capable <strong>of</strong> treating discontinuities.<br />
The values Q ij are advanced in time using approximations to the fluxes through the edges <strong>of</strong><br />
the grid cells. (This is illustrated in Figure 1.)<br />
Finite volume methods are appropriate for problems where some quantity should be<br />
conserved because they guarantee exact conservation numerically. Therefore they are said<br />
to be in conservative form. Summing ∆x∆z d dt Q ij(t) from (23) over all <strong>of</strong> the cells in the<br />
domain, i.e. from cell I 1 to cell I 2 in x-direction <strong>and</strong> from cell J 1 to cell J 2 in z-direction,<br />
yields<br />
∆x∆z<br />
∑<br />
I 2 ∑<br />
i=I 1<br />
J 2<br />
j=J 1<br />
d<br />
dt Q ij(t) = −∆z<br />
−∆x<br />
9<br />
∑J 2<br />
j=J 1<br />
(F I2 +1/2,j − F I1 −1/2,j)<br />
I 2 ∑<br />
i=I 1<br />
(G i,J2 +1/2 − G i,J1 −1/2), (25)
Figure 1: Illustration <strong>of</strong> a finite volume method where the average value Q ij is updated by<br />
the fluxes at the cell edges.<br />
which is a discrete approximation to the integral equation (22). The sum <strong>of</strong> the flux differences<br />
cancels out except for the fluxes at the extreme edges x I1 −1/2, x I2 +1/2, z J1 −1/2 <strong>and</strong><br />
z J2 +1/2. Therefore there will be exact conservation <strong>of</strong> the total quantity within the computational<br />
domain <strong>and</strong> this quantity will vary only due to the fluxes at the boundary.<br />
In order to obtain a fully discrete numerical method the second step is to discretize (23)<br />
in time. Some techniques <strong>of</strong> time integration will be discussed in section 3.4. One possibility<br />
<strong>of</strong> discretization is given here as an example <strong>and</strong> a fully discrete method is derived.<br />
Let ∆t = t n+1 − t n be the length <strong>of</strong> a time step, <strong>and</strong> let Q n ij represent the fully discrete<br />
approximation to Q ij (t n ). Then the time discretization <strong>of</strong> (23) is done by simply taking the<br />
difference between the values Q n+1<br />
ij<br />
<strong>and</strong> Q n ij <strong>and</strong> dividing by ∆t. The numerical method thus<br />
obtained has the form<br />
Q n+1<br />
ij<br />
= Q n ij − ∆t<br />
∆x (F i+1/2,j n − F i−1/2,j n ) − ∆t<br />
∆z (Gn i,j+1/2 − Gn i,j−1/2<br />
), (26)<br />
where the numerical fluxes Fi−1/2,j n <strong>and</strong> Gn i,j−1/2<br />
are some approximations to the time averages<br />
<strong>of</strong> the fluxes along the cell interfaces over the time interval [t n , t n+1 ]:<br />
Fi−1/2,j n ≈ 1 ∫ tn+1<br />
∫ zj+1/2<br />
f(q(x<br />
∆t∆z<br />
i−1/2 , z, t))dzdt,<br />
t n z j−1/2<br />
G n i,j−1/2 ≈ 1 ∫ tn+1<br />
∫ xi+1/2<br />
g(q(x, z<br />
∆t∆x<br />
j−1/2 , t))dxdt.<br />
t n x i−1/2<br />
(27)<br />
If these average fluxes can be computed based on the values Q n , then we will have a fully<br />
discrete method.<br />
For hyperbolic problems, information propagates with finite speed, so F n<br />
i−1/2,j <strong>and</strong> Gn i,j−1/2<br />
can be assumed to be based only on the cell averages on both sides <strong>of</strong> the interfaces x i−1/2<br />
10
<strong>and</strong> z j−1/2 respectively. They can be expressed as<br />
F n<br />
i−1/2,j = F(Qn i−1j , Qn ij ),<br />
G n i,j−1/2 = G(Qn ij−1 , Qn ij ). (28)<br />
where F <strong>and</strong> G are some numerical flux functions. It follows that, in (26), Q n+1<br />
ij<br />
will depend<br />
only on the five values Q n i−1j , Qn ij−1 , Qn ij , Qn i+1,j <strong>and</strong> Qn i,j+1 at the previous time level.<br />
The methods thus obtained are explicit methods with a three-point stencil in both x- <strong>and</strong><br />
z-directions.<br />
3.2 Stability <strong>and</strong> convergence<br />
In finite volume methods, one difficulty is to determine good numerical flux functions F<br />
that approximate the correct fluxes reasonably well. One essential requirement is that the<br />
numerical solution should converge to the true solution <strong>of</strong> the differential equation as the grid<br />
is refined, i.e as ∆x, ∆z <strong>and</strong> ∆t go to zero. This dem<strong>and</strong>s two conditions for the numerical<br />
method: consistency <strong>and</strong> stability.<br />
3.2.1 Consistency<br />
Consistency for a numerical method means that the method should approximate the differential<br />
equation well locally. For a finite volume method, the numerical flux functions F <strong>and</strong> G<br />
are expected to reduce to the true fluxes f <strong>and</strong> g for the case <strong>of</strong> constant flow. If q(x, z, t) ≡ q,<br />
then q does not change with time or height <strong>and</strong> the first integral (27) simply reduces to f(q).<br />
On the other h<strong>and</strong>, as Q n i−1j = Qn ij = q, the numerical flux function F <strong>of</strong> (28) is expected to<br />
reduce to<br />
F(q, q) = f(q) (29)<br />
for any value <strong>of</strong> q. Moreover, continuity in this function is also generally required as Q i−1j<br />
<strong>and</strong> Q ij vary, so that F(Q i−1j , Q ij ) → f(q) as Q i−1j , Q ij → q.<br />
3.2.2 Stability<br />
Stability for a numerical method means that the small errors made in each time step do<br />
not grow too fast in later time steps. A necessary condition for stability <strong>and</strong> hence convergence<br />
that must be satisfied by any finite volume method is that the numerical domain <strong>of</strong><br />
dependence <strong>of</strong> the method contains the true domain <strong>of</strong> dependence <strong>of</strong> the partial differential<br />
equation, at least in the limit as ∆x, ∆z <strong>and</strong> ∆t go to zero. This condition is known as the<br />
CFL condition after Courant, Friedrichs <strong>and</strong> Lewy who first recognized it. In one dimension,<br />
the CFL condition can be interpreted intuitively as requiring that the distance v∆t traveled<br />
by a wave in one time step not exceed one spatial step ∆x.<br />
To illustrate this, consider the case <strong>of</strong> advection with the constant velocity u > 0 in<br />
x-direction. In this way, the exact solution simply translates at speed u <strong>and</strong> travels a distance<br />
u∆t in one time step. In one dimension, the last term in the method (26) drops. Thus<br />
the value Q n+1<br />
i<br />
depends only on the three values Q n i−1 , Qn i <strong>and</strong> Q n i+1 at the previous time<br />
step <strong>and</strong> the computation <strong>of</strong> the numerical flux at x i−1/2 is assumed to be based on Q n i−1<br />
11
<strong>and</strong> Q n i alone. This is effectively true if the time step is small enough so that information<br />
propagates less than one grid cell in a single time step, <strong>and</strong> this is the situation shown in<br />
figure 2(a). In figure 2(b), a larger time step is used so that u∆t is bigger than ∆x. In this<br />
case, the true flux clearly depends on Q n i−2 . For this reason, the one-dimensional version <strong>of</strong><br />
method (26) would most probably be unstable when applied with such a large time step, if<br />
the numerical flux was computed with Q n i−1 <strong>and</strong> Qn i only.<br />
Figure 2: Characteristics for the advection equation with u > 0, showing the information<br />
that flows into cell C i during a single time step. (a) For a small enough time step, the flux<br />
at x i−1/2 depends only on Q n i−1 . (b) For a larger time step, the flux should also depend on<br />
Q n i−2 .<br />
Still in one dimension, the quantity<br />
cn = v max∆t<br />
∆x , (30)<br />
where v max is the maximum characteric speed occuring in the solution, is called the Courant<br />
number for a particular calculation. Thus, a necessary condition for stability <strong>of</strong> three-point<br />
stencil methods is that the Courant number be no greater than 1. For methods with fivepoint<br />
stencils in which Q n+1<br />
i<br />
depends also on Q n i−2 <strong>and</strong> Qn i+2 , the CFL condition would give<br />
cn 2.<br />
In two dimensions, the shortest spatial step is in the diagonal <strong>of</strong> the cell <strong>and</strong> it is given<br />
by 1 2√<br />
∆x 2 + ∆z 2 . The courant number can then be expressed as<br />
cn =<br />
2v max∆t<br />
√<br />
∆x 2 + ∆z 2 . (31)<br />
For the method (26), the condition cn 1 should be satisfied. Again this is only a necessary<br />
condition for stability <strong>and</strong> it is not always sufficient to guarantee stability.<br />
Rigorous stability analysis is <strong>of</strong>ten only possible for linear equations. In the case <strong>of</strong><br />
nonlinear equation, the CFL condition may however provide a good indication for the size <strong>of</strong><br />
the temporal <strong>and</strong> spatial steps to use.<br />
12
3.3 Numerical fluxes<br />
There are different ways in which the numerical flux functions <strong>of</strong> (28) can be defined, leading<br />
to different finite volume methods. Some possibilities <strong>of</strong> fluxes that fulfil the consistency<br />
requirement are given in this chapter.<br />
3.3.1 Flux Averaging Scheme<br />
The average flux Fi−1/2,j n at x i−1/2 was assumed to be based only on the values Q n i−1j <strong>and</strong><br />
Q n ij . The <strong>simple</strong>st way to compute the numerical flux functions is to take the arithmetic<br />
average <strong>of</strong> the flux evaluations at Q n i−1j <strong>and</strong> Qn ij<br />
F n<br />
i−1/2,j = F(Qn i−1j, Q n ij) = 1 2 [f(Qn i−1j) + f(Q n ij)]. (32)<br />
Taking the corresponding definition for the flux functions G <strong>and</strong> replacing in (26) yields the<br />
following method<br />
Q n+1<br />
ij<br />
= Q n ij − ∆t<br />
2∆x [f(Qn i+1j) − f(Q n i−1j)] − ∆t<br />
2∆z [g(Qn ij+1) − g(Q n ij−1)]. (33)<br />
However, for hyperbolic problems this method is generally unstable, even when the CFL<br />
condition is satisfied.<br />
3.3.2 Central Difference Scheme<br />
In the Central Difference scheme, the average <strong>of</strong> the cell values Q n i−1j <strong>and</strong> Qn ij at the left- <strong>and</strong><br />
right-h<strong>and</strong> side <strong>of</strong> the interface x i−1/2 is first computed. Then the flux at x i−1/2 is evaluated<br />
for this value<br />
Fi−1/2,j n = F(Qn i−1j, Q n ij) = f( 1 2 (Qn i−1j + Q n ij)). (34)<br />
This scheme has the advantage <strong>of</strong> being second-order accurate <strong>and</strong>, when used with an<br />
appropriate time integration scheme, it generally leads to methods that are stable (if the<br />
CFL condition is respected).<br />
3.3.3 Lax-Friedrichs Method<br />
The numerical flux in the classical Lax-Friedrichs method is defined as<br />
F n<br />
i−1/2,j = F(Qn i−1j, Q n ij) = 1 2 [f(Qn i−1j) + f(Q n ij)] − ∆x<br />
2∆t (Qn ij − Q n i−1j). (35)<br />
Replacing in (26), with an analogous definition for G, gives the general form <strong>of</strong> the Lax-<br />
Friedrichs method<br />
Q n+1<br />
ij<br />
= Q n ij +1 2 (Qn i−1j − 2Q n ij + Q n i+1j) − ∆t<br />
2∆x [f(Qn i+1j) − f(Q n i−1j)]<br />
+ 1 2 (Qn ij−1 − 2Q n ij + Q n ij+1) − ∆t<br />
2∆z [g(Qn ij+1) − g(Q n ij−1)]. (36)<br />
The Lax-Friedrichs flux (35) is similar to the Averaging flux (32) but with an additionnal<br />
diffusion term which has the effect <strong>of</strong> damping the instabilities arising in (33). Therefore, the<br />
Lax-Friedrichs method is generally stable provided the CFL condition is satisfied.<br />
13
3.3.4 Richtmeyer Two-Step Lax-Wendr<strong>of</strong>f Method<br />
The Richtmeyer Two-Step Lax-Wendr<strong>of</strong>f method is <strong>of</strong> second order. This is achieved by using<br />
a better approximation to the average flux (27). In this method a half step in time is first<br />
made using the Lax-Friedrichs method at the cell interfaces (∆x, ∆z <strong>and</strong> ∆t are replaced<br />
by 1/2∆x, 1/2∆z <strong>and</strong> 1/2∆t). The numerical approximation <strong>of</strong> q at the midpoint in time<br />
t n+1/2 = t n + 1 2∆t is given by<br />
<strong>and</strong> the flux is evaluated at this point<br />
Q n+1/2<br />
i−1/2j = 1 2 (Qn i−1j + Q n ij) − ∆t<br />
2∆x [f(Qn ij) − f(Q n i−1j)], (37)<br />
F n<br />
i−1/2,j = f(Qn+1/2 i−1/2j ) (38)<br />
Although more accurate than the Lax-Friedrichs method, this method <strong>of</strong>ten leads to oscillations<br />
in solutions.<br />
3.4 Time integration<br />
In section 3.1, a system <strong>of</strong> ordinary differential equations (23) for the evolution <strong>of</strong> cell averages<br />
Q ij (t) in time was derived. Our model solves the partial differential equation (16) that<br />
contains source <strong>and</strong> correction terms in addition to the flux terms. This is done using a<br />
splitting technique, first solving<br />
<strong>and</strong> then making the post update<br />
q t + ˜f(q) x + ˜g(q) z = s(q), (39)<br />
q t = r(q). (40)<br />
The flux terms in (39) are tilded as, in addition to the regular fluxes, they contain the flux<br />
correction terms due to the potential energy.<br />
Performing a finite volume discretization for (39) yields the following system <strong>of</strong> ODEs<br />
dQ<br />
dt = RHS x(Q) + RHS z (Q) + S(Q), (41)<br />
where RHS x (Q) <strong>and</strong> RHS z (Q) consist in the x- <strong>and</strong> z-flux terms <strong>and</strong> S(Q) is the source term.<br />
For simplicity, these three terms can be replaced by F(Q) giving<br />
dQ<br />
dt<br />
= F(Q). (42)<br />
The discretization in time can then be done by using any st<strong>and</strong>ard method for systems <strong>of</strong><br />
ODEs. Some time-discretization methods will be presented in this section.<br />
14
3.4.1 Forward Scheme<br />
The forward scheme is the most natural time-discretization method. It is a single-stage twotime-level<br />
scheme as it advances the variables from time level t n to time level t n+1 <strong>and</strong> the<br />
right-h<strong>and</strong> sides <strong>of</strong> the equations are generally evaluated at t n . It has the form<br />
Q n+1 − Q n<br />
∆t<br />
= F(Q n ). (43)<br />
The forward scheme is <strong>of</strong> first order <strong>and</strong> it is said to be explicit, as the calculation <strong>of</strong> Q n+1<br />
does not depend on Q n+1 . Explicit methods generally require much less computation per<br />
time step than implicit methods, in which the calculation <strong>of</strong> Q n+1 does depend on Q n+1 .<br />
A quite natural way to derive a numerical method is to use a forward-in-time approximation<br />
in combination with a spatially centered approximation, such as the central difference<br />
scheme defined in section 3.3.2. Unfortunately this method suffers from severe stability problems.<br />
But there are other explicit schemes, such as Lax-Friedrichs <strong>and</strong> Lax-Wendr<strong>of</strong>f that<br />
may be used with a forward approximation <strong>and</strong> are stable with reasonable size time steps.<br />
3.4.2 Leapfrog Scheme<br />
The Leapfrog scheme is an explicit three-time-level method. With this method, the variables<br />
are stepped forward from time level t n−1 to time level t n+1 where the right-h<strong>and</strong> sides <strong>of</strong> the<br />
corresponding equations are evaluated at the mid-time level t n . The Leapfrog method has<br />
the general form<br />
Q n+1 − Q n−1<br />
= F(Q n ). (44)<br />
2∆t<br />
Its advantages are that it is stable when used togheter with spatially centered approximations,<br />
it is <strong>of</strong> second order, <strong>and</strong> it requires only one function evaluation per time step. The weakness<br />
<strong>of</strong> the Leapfrog scheme is its undamped computational mode. Numerical noise is generated<br />
by numerical dispersion leading to the initiation <strong>and</strong> amplification <strong>of</strong> nonlinear instabilities.<br />
A way to avoid the growth <strong>of</strong> the computational mode will be given in section 3.8.<br />
3.4.3 Third-order Runge-Kutta Scheme<br />
Higher-order time-integration methods are in general not used because <strong>of</strong> limitations on<br />
computational ressources. Nevertheless, the third-order Runge-Kutta scheme has interesting<br />
characteristics: it is stable with strongly damped computational modes. Furthermore, it can<br />
be computed in a low-storage variant:<br />
k 1 = ∆tF(Q n ),<br />
k 2 = ∆tF(Q 1 ) − 5k 1 /9,<br />
k 3 = ∆tF(Q 2 ) − 153k 2 /128,<br />
Q 1 = Q n + k 1 /3,<br />
Q 2 = Q 1 + 15k 2 /16,<br />
Q n+1 = Q 2 + 8k 3 /15.<br />
(45)<br />
If m is the size <strong>of</strong> Q, this variant, called the Williamson-Runge-Kutta scheme, uses only 2m<br />
storage locations, m for each <strong>of</strong> the arrays k <strong>and</strong> Q, which are overwritten three times during<br />
each step. The storage requirement <strong>of</strong> the Williamson-Runge-Kutta scheme is the same as<br />
that <strong>of</strong> the forward <strong>and</strong> the st<strong>and</strong>ard leapfrog schemes. This method <strong>of</strong>fers the possibility<br />
15
to achieve better than second-order accuracy without overstepping the storage limitations.<br />
However, the third-order Runge-Kutta scheme has not yet been implemented in our model.<br />
It will be used in a future version.<br />
3.5 Dimensional splitting<br />
In our model, equation q t + f(q) x + g(q) z = s(q) must be solved. The straightforward<br />
approach is to evaluate the three terms f, g, s at the same time <strong>and</strong> thus updating q with the<br />
three contributions at once. However an other possibility is to split the problem into three<br />
sub-problems <strong>and</strong> solve them in turn<br />
x-sweeps: q t + f(q) x = 0, (46)<br />
z-sweeps: q t + g(q) z = 0, (47)<br />
source-addition: q t = s(q). (48)<br />
The application <strong>of</strong> a splitting technique generally gives more accurate results as the values<br />
q are updated between the computation <strong>of</strong> each term. The successive steps will be detailed<br />
using a forward-in-time integration.<br />
In the x-sweeps we start with cell averages Q n ij at time t n <strong>and</strong> solve the one-dimensional<br />
problem (46) along each row <strong>of</strong> cells C ij with j fixed, computing an intermediate solution Q ∗ ij :<br />
Q ∗ ij = Q n ij + ∆t RHS x (Q n ). (49)<br />
In the z-sweeps the values Q ∗ ij are then used as data <strong>and</strong> (47) is solved along each column <strong>of</strong><br />
cells with i fixed. This results in Q ∗∗<br />
ij :<br />
Finally the values Q ∗∗<br />
ij<br />
Q ∗∗<br />
ij = Q ∗ ij + ∆t RHS z (Q ∗ ). (50)<br />
are used to solve (48) <strong>and</strong> the new value Qn+1<br />
ij<br />
at t n+1 is obtained<br />
Q n+1<br />
ij<br />
= Q ∗∗<br />
ij + ∆t S(Q ∗∗ ). (51)<br />
Without flux splitting, the information that is contained in the adjacent cells C i−1j <strong>and</strong><br />
C ij−1 is transmitted to cell C ij at the same time. However this does not take into account the<br />
information that is contained in the diagonally adjacent cell C i−1j−1 , which is transported by<br />
diagonal winds. If a flux splitting technique is used <strong>and</strong> x-sweeps are preceeding z-sweeps,<br />
then information contained in the diagonally adjacent cell C i−1j−1 is first transmitted to cell<br />
C ij−1 during the x-sweep <strong>and</strong> it is then further conveyed to cell C ij during the z-sweep.<br />
3.6 Initial conditions<br />
To determine the quantities q(x, z, t) for all times t > t 0 , initial conditions at time t 0 must be<br />
specified. An initial ”background” state is computed for the whole domain <strong>and</strong> cell averages<br />
are determined for every grid cell. This background state is stored in a variable q 0 , as it<br />
might be further needed for boundary conditions computation (section 3.7) <strong>and</strong> filtering<br />
(section 3.8). Then, a perturbation is <strong>of</strong>ten initiated in one <strong>of</strong> the variables q depending on<br />
the problem to be solved. Different possibilities <strong>of</strong> initial states are given is this section.<br />
16
3.6.1 Gas dynamics (c = 1)<br />
A <strong>simple</strong> way to initialise the grid cells is to set ρ 0 = ρe 0 = 1 <strong>and</strong> ρu 0 = ρw 0 = 0. This<br />
initial conditions were used in particular during the different stages <strong>of</strong> model implementation<br />
in order to facilitate the <strong>verification</strong> <strong>of</strong> its functioning.<br />
3.6.2 Unstratified atmosphere (g = 0)<br />
A more ”physical” but still unstratified atmosphere is initialised by setting ρ 0 equal to<br />
1.25 kgm −2 in all grid cells. Lateral <strong>and</strong> vertical wind speed intensities u 0 <strong>and</strong> w 0 are then<br />
chosen <strong>and</strong> the initial momenta are given by the products ρ 0 u 0 <strong>and</strong> ρ 0 w 0 . To initialise the<br />
energy variable, a value for the temperature T 0 must also be specified an it is assumed to be<br />
constant in the whole domain. The energy is computed from<br />
ρe 0 = ρ 0 C v T 0 + 1 2 ρ 0(u 2 0 + w 2 0). (52)<br />
with ρe int = C v T where C v = 717 Jkg −1 K −1 is the specific heat at constant volume.<br />
3.6.3 Stratified atmosphere (N = const)<br />
In the absence <strong>of</strong> atmospheric motion, there is a balance between vertical pressure gradient<br />
<strong>and</strong> buoyancy forces. In the atmosphere, the pressure <strong>of</strong> air decreases with increasing altitude.<br />
This creates an upward force, called the pressure gradient force. The force <strong>of</strong> gravity, on the<br />
other h<strong>and</strong>, almost exactly balances this out. Explicitly, hydrostatic balance is expressed as<br />
∂p<br />
∂z<br />
= −ρg. (53)<br />
The two variables, pressure <strong>and</strong> density, are related through the ideal gas law<br />
p = ρR d T, (54)<br />
where R d = 287 Jkg −1 K −1 is the gas constant for dry air. The temperature can be expressed<br />
as<br />
T = πθ, (55)<br />
where θ <strong>and</strong> π are the temperature <strong>and</strong> pressure that a parcel <strong>of</strong> dry air at temperature T <strong>and</strong><br />
pressure p would have if it were brought at a st<strong>and</strong>ard pressure p s . θ is called the potential<br />
temperature <strong>and</strong> π the Exner function which is defined explicitely as<br />
π =<br />
( p<br />
p s<br />
) Rd /C p. (56)<br />
p s is the pressure at ground level <strong>and</strong> C p = 1004 Jkg −1 K −1 the specific heat at constant<br />
pressure. A last equation that is relevant for hydrostatic balance is<br />
N 2 = g θ<br />
where N is the buoyancy frequency usually taken to be 0.01 s −1 .<br />
∂θ<br />
∂z , (57)<br />
17
In order to compute hydrostatic balance we need to express θ <strong>and</strong> π as functions <strong>of</strong> z<br />
only. θ(z) can be obtained by integrating equation (57) in z :<br />
( N<br />
2 )<br />
θ(z) = θ s exp<br />
g z . (58)<br />
where θ s = θ(0). Substituting (54) in (53) <strong>and</strong> then writing this in terms <strong>of</strong> π <strong>and</strong> θ yields<br />
Integrating in z gives the equation for π<br />
π(z) = 1 −<br />
∂π<br />
∂z = − g<br />
C p θ . (59)<br />
g2<br />
(1 − exp(−N2 z)), (60)<br />
C p θ s N 2 g<br />
<strong>and</strong> this equation is used to compute hydrostatic stratification. Then performing a backsubstitution<br />
T = πθ,<br />
p = p s π Cp/R d,<br />
ρ =<br />
R p<br />
d T ,<br />
(61)<br />
ρe =<br />
γ − p<br />
1 ,<br />
yields the values for the components <strong>of</strong> q.<br />
3.7 Boundary conditions<br />
In an atmospheric limited area model, only the lower boundary is physical. The other sides<br />
<strong>of</strong> the spatial domain are unbounded, meaning that the fluid flows in an exterior domain,<br />
<strong>and</strong> artificial boundaries must be introduced. In order to deal with the boundaries <strong>of</strong> the<br />
computational domain boundary conditions must be specified, for both artificial <strong>and</strong> physical<br />
boundaries.<br />
F n<br />
In the methods studied here, the value Q n ij<br />
is updated by computing the fluxes F<br />
n<br />
i−1/2,j ,<br />
i+1/2,j , Gn i,j−1/2 <strong>and</strong> Gn i,j+1/2 . For doing that the neighboring cell values Qn i−1j , Qn i+1j , Qn ij−1<br />
<strong>and</strong> Q n ij+1 are needed. But for the cells at the edges <strong>of</strong> the computational domain one or<br />
more <strong>of</strong> these values are missing. The general approach to this problem is to extend the<br />
computational domain to include a few additional cells, called ghost cells, on each side.<br />
Figure 3 shows a portion <strong>of</strong> a grid on the computational domain that consists <strong>of</strong> interior<br />
cells labelled by i = 1, 2, ..., N x <strong>and</strong> j = 1, 2, ..., N z <strong>and</strong> that is extended by introducing<br />
two ghost cells on each side, for i = −1, 0 <strong>and</strong> i = N x + 1, N x + 2 <strong>and</strong> for j = −1, 0 <strong>and</strong><br />
j = N z + 1, N z + 2. The values in the ghost cells are set at the beginning <strong>of</strong> each time step<br />
based on data in the interior cells in a manner that depends on the boundary conditions.<br />
This provides the neighboring cell values needed in updating the cells near the boundary <strong>of</strong><br />
the domain.<br />
The number <strong>of</strong> ghost cells depends on the stencil <strong>of</strong> the method. For a three-point method,<br />
only one ghost cell on each side is needed to compute the fluxes, while two are required with<br />
a five-point stencil.<br />
18
Figure 3: The lower left corner <strong>of</strong> a typical computational domain. Interior grid cells (in<br />
black) are labeled with i = 1,2,... <strong>and</strong> j = 1,2,... . The domain is extended with two rows <strong>of</strong><br />
ghost cells (in grey) on each side.<br />
3.7.1 Periodic boundary conditions<br />
For a two-dimensional domain [a, b] × [c, d], the periodic boundary conditions in x-direction<br />
can be expressed as q(a, z, t) = q(b, z, t). Therefore the values Q n 0j in the column <strong>of</strong> ghost<br />
cells before the left-h<strong>and</strong> boundary should be equal to the values Q n N xj<br />
in the last column <strong>of</strong><br />
internal cells. Therefore we set Q n 0j = Qn N xj<br />
before computing the fluxes. For a method in<br />
which two ghost cells are needed, these are filled by setting<br />
for j = 1, 2, ..., N z .<br />
Q n −1,j = Qn N x−1,j , Qn 0,j = Qn N x,j , Qn N x+1,j = Qn 1,j , Qn N x+2,j = Qn 2,j (62)<br />
In z-direction, the periodic boundary conditions are given by q(x, c, t) = q(x, d, t) <strong>and</strong><br />
the ghost cells are filled with a similar procedure<br />
Q n i,−1, = Qn i,N z−1 , Qn i,0 = Qn i,N z<br />
, Q n i,N z+1 = Qn i,1 , Qn i,N z+2 = Qn i,2 (63)<br />
for i = −1, 0, 1, 2, ..., N x + 1, N x + 2.<br />
Note that in the second direction the procedure is applied for the interior cells as well as<br />
the ghost cells (i = −1, 0 <strong>and</strong> i = N x + 1, N x + 2) in order to have all the ghost cells filled,<br />
including the sixteen corner cells.<br />
3.7.2 Solid wall boundary conditions<br />
A possible condition for the boundaries is to consider a solid wall that the fluid cannot cross.<br />
This means that the velocity normal to the boundary must be zero. Therefore the solid wall<br />
boundary conditions can be written as ⃗u · ⃗n = 0.<br />
Consider first the lateral boundaries <strong>of</strong> the domain, where the x-component, u, <strong>of</strong> the<br />
19
velocity should be zero. The ghost cells are filled by extrapolating all components <strong>of</strong> Q in<br />
a symmetric manner, except for the x-momentum ρu that must also be negated so that it<br />
vanishes at the boundary<br />
for j = 1, 2, ..., N z .<br />
Q n −1,j = Qn 2,j , Qn 0,j = Qn 1,j , Qn N x+1,j = Qn N x,j , Qn N x+2,j = Qn N x−1,j (64)<br />
A similar extrapolation can be performed for the ghost cells at the top <strong>and</strong> bottom<br />
edges <strong>and</strong> the z-component <strong>of</strong> momentum ρw should be negated.<br />
3.7.3 Solid wall with hydrostatic pressure<br />
In many fluid dynamics models, the pressure is made to decrease with altitude in order to<br />
mimic the true atmospheric conditions. In this case, the usual solid wall boundary conditions<br />
are not very appropriate for the top <strong>and</strong> bottom boundaries as, by symmetry, the pressure<br />
would be decreasing instead <strong>of</strong> increasing under the bottom boundary. For this reason, the<br />
solid wall conditions must be adapted to take into account the increase <strong>of</strong> pressure with lowering<br />
height.<br />
Integrating equation (53) that describes hydrostatic balance over two cells yields a way to<br />
extrapolate the components <strong>of</strong> Q that correspond to the energy (<strong>and</strong> therefore to the pressure)<br />
in the ghost cells under <strong>and</strong> above the computational domain. For the energy components in<br />
the two bottom cells this gives<br />
ρe i,−1 = ρe i,1 + 2∆z ρ i,0g<br />
(γ − 1) , ρe i,0 = ρe i,2 + 2∆z ρ i,1g<br />
(γ − 1)<br />
for i = −1, 0, 1, 2, ..., N x + 1, N x + 2. A similar extension for ρe i,Nz+1 <strong>and</strong> ρe i,Nz+2 in the top<br />
ghost cells is performed. The other components <strong>of</strong> Q in the ghost cells obey the usual solid<br />
wall extension <strong>of</strong> section 3.7.2.<br />
3.7.4 Solid wall with background<br />
Instead <strong>of</strong> straightly performing the extrapolation <strong>of</strong> the values Q n , the solid wall extension<br />
can be done on the difference between the current <strong>and</strong> the background states Q n − Q 0 . Then<br />
(65)<br />
Q n i,−1 = Q0 i,−1 + Qn i,2 − Q0 i,2 , Qn i,0 = Q0 i,0 + Qn i,1 − Q0 i,1 (66)<br />
for i = −1, 0, 1, 2, ..., N x + 1, N x + 2. This technique permits to preserve the hydrostatic<br />
tendency <strong>of</strong> pressure that is to increase with lowering altitude as only the differences from the<br />
hydrostatic background state are copied from the interior cells <strong>and</strong> added to the background<br />
values in the ghost cells.<br />
3.7.5 Prolongation <strong>of</strong> hydrostatic balance<br />
An other way to deal with hydrostatic situations is to perform an extrapolation <strong>of</strong> the pressure<br />
under <strong>and</strong> above the boundaries <strong>of</strong> the domain. Hydrostatic balance is computed with the<br />
help <strong>of</strong> accessory variables among which the potential temperature θ <strong>and</strong> the Exner function<br />
20
π. In order to fill the ghost cells, a first order extrapolation <strong>of</strong> θ, based on fitting a linear<br />
function through the interior solution is done. For the bottom cells this gives<br />
θ i,0 = θ i,1 − ∆θ i,3/2 = θ i,1 − (θ i,2 − θ i,1 ) = 2θ i,1 − θ i,2 ,<br />
θ i,−1 = θ i,0 − ∆θ i,1/2 = θ i,0 − (θ i,1 − θ i,0 ) = 2θ i,0 − θ i,1 , (67)<br />
for i = −1, 0, 1, 2, ..., N x + 1, N x + 2. Using these values, the Exner function can be computed<br />
for the ghost cells by integrating equation (59).<br />
2g<br />
π i,0 = π i,1 + ∆z<br />
C p (θ i,0 + θ i,1 ) ,<br />
π 2g<br />
i,−1 = π i,0 + ∆z<br />
C p (θ i,−1 + θ i,0 )<br />
(68)<br />
for i = −1, 0, 1, 2, ..., N x + 1, N x + 2. Finally the components <strong>of</strong> Q are found using the set <strong>of</strong><br />
equations (61).<br />
3.8 Damping terms<br />
Non-linear instabilities <strong>and</strong> small-scale computational noise can be controlled by introducing<br />
artificial numerical damping terms acting on the computational grid. Numerical noise <strong>of</strong> such<br />
type is continuousely generated by numerical dispersion, especially with the Leapfrog time<br />
integration using centerd difference operators for advection.<br />
3.8.1 Time filtering<br />
A way to control the growth <strong>of</strong> the computational mode when using a Leapfrog integration<br />
(section 3.4.2) is to apply a centered second-order time filter to the mid-time level t n after<br />
each Leapfrog step. The Robert-Asselin time filter has the form<br />
˜Q n ij = Q n ij + µ(Q n+1<br />
ij<br />
− 2Q n ij +<br />
˜Q<br />
n−1<br />
ij<br />
), (69)<br />
where Q n ij is the solution at time t n, ˜Qn ij the solution after filtering <strong>and</strong> µ is a positive real<br />
coefficient that determines the strength <strong>of</strong> the filter. Typical values <strong>of</strong> µ are between 0.05<br />
<strong>and</strong> 0.2. Note that the last term in (69) is the usual finite-difference approximation to the<br />
second derivative <strong>and</strong> preferentially damps the high-frequency components. Therefore, the<br />
filter permits to control rapid oscillations <strong>and</strong> instabilities <strong>of</strong> the computational mode, which<br />
are generated by the Leapfrog integration. The temporal decoupling <strong>of</strong> the physical <strong>and</strong> the<br />
computational modes <strong>of</strong> the numerical solution is thus avoided.<br />
3.8.2 Spatial filtering<br />
In a simulation, numerical dispersion continuously generates numerical noise <strong>of</strong> wavelength<br />
near the two grid interval (at the 2∆x-scale), especially when using centered difference<br />
schemes. These schemes preserve the amplitude <strong>of</strong> each wave component, but the various<br />
components propagate at different speeds <strong>and</strong> thus the superposition <strong>of</strong> these components<br />
does not properly represent the true solution anymore. It is therefore <strong>of</strong>ten useful to add<br />
artificial diffusion in order to damp this small scale noise. This is generally realized by<br />
introducing a scale-selective spatial filter <strong>of</strong> the form<br />
dQ<br />
dt = (−1)m/2+1 K m ∇ m Q, (70)<br />
21
where m is the order <strong>of</strong> the diffusion term, that must be even, <strong>and</strong> K m is the corresponding<br />
diffusion coefficient.<br />
Note that these filters not only damp the two grid interval wavelength but may also<br />
act on longer wave components. However, the fourth <strong>and</strong> sixth order filters are more scaleselective<br />
than the second order filter as they have very little damping for these longer waves.<br />
Nevertheless, they have the disadvantage to introduce spatial oscillations <strong>and</strong> thus creating<br />
possible new maxima or minima. This does not happen with a second order filter as it has<br />
a Lapacien form <strong>and</strong> thus it is always monotonic: it simply transfers quantities from regions<br />
with higher values to regions with smaller values.<br />
In the case <strong>of</strong> our model, a second order spatial filter is applied to the variables ρ, ρu<br />
<strong>and</strong> ρw after each time step. It is not applied to ρe because pressure, which is related to<br />
energy, should not be smoothed. If it was so, the pressure values would be moved from their<br />
equilibrium values <strong>and</strong> this would lead to the creation <strong>of</strong> winds. This filter has the form<br />
˜Q n+1<br />
ij<br />
= Q n+1<br />
ij<br />
+ ν 8 (Qn−1 i+1j − 2Qn−1 ij<br />
+ Q n−1<br />
i−1j + Qn−1 ij+1 − 2Qn−1 ij<br />
˜Q<br />
n+1<br />
+ Q n−1<br />
ij−1<br />
), (71)<br />
where Q n+1<br />
ij<br />
is the solution at time t n+1 ,<br />
ij<br />
the solution after filtering <strong>and</strong> ν is a coefficient<br />
that determines the strength <strong>of</strong> the filtering. If ∆x = ∆z, ν can be expressed as<br />
ν = 8K ∆t<br />
∆x 2 . (72)<br />
It follows from equation (72) that, for a given ν, the physical diffusion K depends on the<br />
lenght <strong>of</strong> the time step <strong>and</strong> the cells size.<br />
22
4 Results<br />
4.1 Comparison <strong>of</strong> different methods<br />
Several types <strong>of</strong> numerical fluxes <strong>and</strong> various time integration methods were implemented<br />
<strong>and</strong> can be combined to yield different models.<br />
A model using Leapfrog time integration <strong>and</strong> central differences in space with initial<br />
hydrostatic equilibrium conditions is found stable for integration times up to ten hours if a<br />
numerical smoothing filter is applied. However stability cannot be achieved with the Lax-<br />
Friedrichs <strong>and</strong> Lax-Wendr<strong>of</strong>f methods. In the simulations, the pressure is continuousely<br />
increasing with time. In the Lax-Wendr<strong>of</strong>f method a half step in time is first made approximating<br />
q at the cell interfaces, to be consistent it seems that the source term s(q) <strong>and</strong> possibly<br />
also the correction term r(q) should be introduced when doing this forward integration. This<br />
will be implemented in a future version.<br />
Concerning the boundary conditions, three different possibilities for filling the ghost cells<br />
can be used in models using hydrostatic equilibrium. These are described in section 3.7.3,<br />
3.7.4 <strong>and</strong> 3.7.5. However the solid wall with hydrostatic pressure boundary conditions <strong>and</strong><br />
the prolongation <strong>of</strong> hydrostatic balance boundary conditions appear to give values for the<br />
ghost cells that are not in exact prolongations with the values in the interior cells. In this<br />
case wind are created at the boundaries <strong>of</strong> the domain that can lead to instabilities. The<br />
solid wall with background boundary conditions give good results as they better preserve the<br />
hydrostatic tendency <strong>of</strong> the pressure.<br />
The model with dimensional splitting (section 3.5) is suffering from stability problems.<br />
In simulations with hydrostatic equilibrium, the winds that are generated are <strong>of</strong> two orders<br />
<strong>of</strong> magnitude bigger than without splitting, after an integration <strong>of</strong> 20 s. These wind velocities<br />
are even bigger in the regions near the boundaries. The boundary conditions were<br />
first suspected as they must be applied between the computation <strong>of</strong> each sub-problem <strong>and</strong>,<br />
therefore, they are applied several times inside a single time step. An attempt to solve this<br />
problem was made by computing the x-fluxes (in the x-sweep step) for the whole domain<br />
including the ghost cells so that they are updated <strong>and</strong> the boundary conditions must not be<br />
reapplied before the z-sweep is performed. However the results obtained are not better with<br />
this technique <strong>and</strong> another cause for the instabilities must be found. Another possibility to<br />
control these instabilities is that numerical diffusion should be possibly introduced as a fourth<br />
sub-equation in the splitting. In the current version, it is only applied after the time step is<br />
done. This will be implemented <strong>and</strong> tested in a future version <strong>of</strong> our model.<br />
23
4.2 Hydrostatic balance<br />
Hydrostatic equilibrium in vertical direction z can be computed using equation (60). However,<br />
even if the initial pressure is analytical, there will be small numerical imprecisions due<br />
to discretization into finite volumes. Indeed, the pressure is generally not a linear function<br />
<strong>of</strong> height <strong>and</strong> small errors arise when approximating average values over each cells. These<br />
imprecisions then lead to the creation <strong>of</strong> winds at the beginning <strong>of</strong> the simulation. The maximum<br />
velocity <strong>of</strong> these winds then increases to stabilise at a constant mean value around<br />
which it oscillates with time.<br />
This behaviour is due to the integration schemes themselves <strong>and</strong> their associated local<br />
truncation error. In order to obtain good results, numerical filters are used that smooth the<br />
solutions <strong>and</strong> therefore reduce the wind velocities. Sensitivity tests to filtering using hydrostatic<br />
equilibrium in one dimension were done. The results are presented on semilogarithmic<br />
plots <strong>of</strong> |w| max versus time, where |w| max is the maximum <strong>of</strong> z-velocity values over the whole<br />
domain. The plots are shown in Figure 4 <strong>and</strong> Figure 5. The model is integrated using a<br />
Leapfrog scheme together with centered-in-space differences <strong>and</strong> the boundary conditions are<br />
a solid wall with background.<br />
The models using a Leapfrog scheme afford an undamped computational mode that leads<br />
to the creation <strong>of</strong> oscillations <strong>and</strong> instabilities in the solution. These unwanted effects can<br />
be controlled by applying an Asselin time filter after each step (see section 3.4.2). The value<br />
<strong>of</strong> the filter coefficient µ must be chosen so that the filter strongly damps the computational<br />
mode while having only little impact on the physical mode. A series <strong>of</strong> simulations is done for<br />
various values <strong>of</strong> µ <strong>and</strong> the results are shown in Figure 4. It is observed that the amplitude<br />
<strong>of</strong> the oscillations are reduced as µ is increased. However, at the same time, the average<br />
value <strong>of</strong> |w| max increases a little bit. This can be seen by comparing the plots with time<br />
filter constants <strong>of</strong> 0.05 <strong>and</strong> 0.4 in Figure 4. Although the curve for µ = 0.4 is smoother, it<br />
is also higher, meaning that the velocities are bigger. With very large values <strong>of</strong> µ (e.g. 0.6),<br />
the velocities even continuously increase with time to reach values <strong>of</strong> 10 −3 ms −1 after 9000 s.<br />
Filter coefficients µ in the range 0.05 - 0.2 will be used in our model.<br />
A second order spatial filter as given by (71) can be used to damp the 2∆x-scale noise<br />
generated by numerical dispersion. Results for different values <strong>of</strong> the filter coefficient ν are<br />
presented in Figure 5 showing that the velocities can be reduced by increasing the strength <strong>of</strong><br />
the filter. However, beside reducing the 2∆x noise, the filtering may also act on longer wave<br />
components, which does contain physical meaningful information <strong>and</strong> therefore should not<br />
be affected by the filter. In the last plot <strong>of</strong> Figure 5, the decrease <strong>of</strong> |w| max with time seems<br />
to indicate that these longer wave components are smoothed by the filter. A very strong filter<br />
may therefore create too much diffusion <strong>and</strong> lead to the loss <strong>of</strong> physical information. For<br />
this reason the strength <strong>of</strong> the filter should be adapted according to the problem being solved.<br />
Sensitivity to source term formulation is also tested <strong>and</strong> is presented in Figure 6. Three<br />
different techniques for the interpolation <strong>of</strong> ρ are compared: Midpoint, Simpson rule over<br />
one cell <strong>and</strong> Simpson rule over two cells. In Midpoint, the average cell value <strong>of</strong> ρ is used to<br />
compute the source term, leading to a first order approximation. The value <strong>of</strong> the source term<br />
24
time filter cst = 0<br />
time filter cst = 0.15<br />
10 −5<br />
10 −5<br />
log 10<br />
|w| max<br />
[m/s]<br />
10 −4 t [s]<br />
10 −6<br />
log 10<br />
|w| max<br />
[m/s]<br />
10 −4 t [s]<br />
10 −6<br />
10 −7<br />
10 −7<br />
0 1000 2000 3000 4000 5000 6000 7000 8000 9000<br />
0 1000 2000 3000 4000 5000 6000 7000 8000 9000<br />
time filter cst = 0.05<br />
time filter cst = 0.2<br />
10 −5<br />
10 −5<br />
log 10<br />
|w| max<br />
[m/s]<br />
10 −4 t [s]<br />
10 −6<br />
log 10<br />
|w| max<br />
[m/s]<br />
10 −4 t [s]<br />
10 −6<br />
10 −7<br />
10 −7<br />
0 1000 2000 3000 4000 5000 6000 7000 8000 9000<br />
0 1000 2000 3000 4000 5000 6000 7000 8000 9000<br />
time filter cst = 0.075<br />
time filter cst = 0.4<br />
10 −5<br />
10 −5<br />
log 10<br />
|w| max<br />
[m/s]<br />
10 −4 t [s]<br />
10 −6<br />
log 10<br />
|w| max<br />
[m/s]<br />
10 −4 t [s]<br />
10 −6<br />
10 −7<br />
10 −7<br />
0 1000 2000 3000 4000 5000 6000 7000 8000 9000<br />
0 1000 2000 3000 4000 5000 6000 7000 8000 9000<br />
time filter cst = 0.1<br />
time filter cst = 0.6<br />
10 −4 t [s]<br />
10 −2 t [s]<br />
10 −3<br />
10 −5<br />
log 10<br />
|w| max<br />
[m/s]<br />
10 −6<br />
log 10<br />
|w| max<br />
[m/s]<br />
10 −4<br />
10 −5<br />
10 −6<br />
10 −7<br />
10 −7<br />
0 1000 2000 3000 4000 5000 6000 7000 8000 9000<br />
0 1000 2000 3000 4000 5000 6000 7000 8000 9000<br />
Figure 4: Comparison <strong>of</strong> the maximum z-velocities w obtained for differents values <strong>of</strong> the<br />
Asselin time filter constant µ in a one-dimensional hydrostatic model with ν = 0.002.<br />
25
spatial filter cst = 0<br />
spatial filter cst = 0.01<br />
10 −5<br />
10 −5<br />
log 10<br />
|w| max<br />
[m/s]<br />
10 −4 t [s]<br />
10 −6<br />
log 10<br />
|w| max<br />
[m/s]<br />
10 −4 t [s]<br />
10 −6<br />
10 −7<br />
10 −7<br />
0 1000 2000 3000 4000 5000 6000 7000 8000 9000<br />
0 1000 2000 3000 4000 5000 6000 7000 8000 9000<br />
spatial filter cst = 0.0008<br />
spatial filter cst =0.04<br />
10 −5<br />
10 −5<br />
log 10<br />
|w| max<br />
[m/s]<br />
10 −4 t [s]<br />
10 −6<br />
log 10<br />
|w| max<br />
[m/s]<br />
10 −4 t [s]<br />
10 −6<br />
10 −7<br />
10 −7<br />
0 1000 2000 3000 4000 5000 6000 7000 8000 9000<br />
0 1000 2000 3000 4000 5000 6000 7000 8000 9000<br />
spatial filter cst = 0.002<br />
spatial filter cst = 0.1<br />
10 −5<br />
10 −5<br />
log 10<br />
|w| max<br />
[m/s]<br />
10 −4 t [s]<br />
10 −6<br />
log 10<br />
|w| max<br />
[m/s]<br />
10 −4 t [s]<br />
10 −6<br />
10 −7<br />
10 −7<br />
0 1000 2000 3000 4000 5000 6000 7000 8000 9000<br />
0 1000 2000 3000 4000 5000 6000 7000 8000 9000<br />
spatial filter cst = 0.006<br />
spatial filter cst = 0.8<br />
10 −5<br />
10 −5<br />
log 10<br />
|w| max<br />
[m/s]<br />
10 −4 t [s]<br />
10 −6<br />
log 10<br />
|w| max<br />
[m/s]<br />
10 −4 t [s]<br />
10 −6<br />
10 −7<br />
10 −7<br />
10 −8<br />
0 1000 2000 3000 4000 5000 6000 7000 8000 9000<br />
0 1000 2000 3000 4000 5000 6000 7000 8000 9000<br />
Figure 5: Comparison <strong>of</strong> the maximum z-velocities w obtained for differents values <strong>of</strong> the<br />
spatial filter constant ν in a one-dimensional hydrostatic model with µ = 0.1.<br />
26
in the (ij) grid cell is then s ij = −ρ ij g. In Simpson rule, ρ is computed from its interpolating<br />
polynomial <strong>of</strong> degree two: ∫ b<br />
[ (<br />
b−a<br />
a<br />
ρ(z)dz ≈<br />
6 ρ(a) + 4ρ a+b<br />
) ]<br />
2 + ρ(b) . In Simpson over one cell,<br />
a <strong>and</strong> b are located at the edges <strong>of</strong> the cell, while in Simpson over two cells, a <strong>and</strong> b are<br />
situated in the neighboring cells.<br />
The results indicate a huge sensitivity to the method used for source term interpolation,<br />
as the maximum velocities drop from 10 −2 ms −1 with Midpoint <strong>and</strong> Simpson over one<br />
cell to 10 −6 ms −1 with Simpson over two cells. A possible explanation for this is that applying<br />
Simpson rule over two cells rather than one single cell might produce a ”smoothing” effect<br />
<strong>and</strong> this may be the reason <strong>of</strong> the dramatical decrease <strong>of</strong> the maximum velocities.<br />
midpoint<br />
10 0 t [s]<br />
10 −1<br />
log 10<br />
|w| max<br />
[m/s]<br />
10 −2<br />
10 −3<br />
0 1000 2000 3000 4000 5000 6000 7000 8000 9000<br />
Simpson with 1 grid cell<br />
10 0 t [s]<br />
10 −1<br />
log 10<br />
|w| max<br />
[m/s]<br />
10 −2<br />
10 −3<br />
0 1000 2000 3000 4000 5000 6000 7000 8000 9000<br />
Simpson with 2 grid cells<br />
10 −4 t [s]<br />
10 −5<br />
log 10<br />
|w| max<br />
[m/s]<br />
10 −6<br />
10 −7<br />
0 1000 2000 3000 4000 5000 6000 7000 8000 9000<br />
Figure 6: Comparison <strong>of</strong> the maximum z-velocities obtained for differents source term formulations<br />
in a one-dimensional hydrostatic model with µ = 0.1 <strong>and</strong> ν = 0.01.<br />
27
4.3 Sound waves<br />
An acoustic wave is a very small pressure disturbance that propagates through a compressible<br />
gas. This causes infinitesimal changes in the density <strong>and</strong> pressure <strong>of</strong> the gas because <strong>of</strong> little<br />
motions <strong>of</strong> the gas with small values <strong>of</strong> the horizontal <strong>and</strong> vertical velocities u <strong>and</strong> w. Most<br />
sound waves are linear phenomena. The disturbances from the background state are very<br />
small so that products <strong>of</strong> powers <strong>of</strong> the perturbation amplitude can be ignored. Therefore<br />
the quantities q can be written as q(x, z, t) = q 0 + q ′ (x, z, t), where q 0 is the background state<br />
<strong>and</strong> q ′ is the perturbation.<br />
As test case, a Gaussian pressure perturbation (with σ= 400 m) is superimposed onto<br />
a one-dimensional hydrostatic background for which surface pressure <strong>and</strong> temperature values<br />
<strong>of</strong> 10 5 Pa <strong>and</strong> 273, 15 K are chosen. The initial perturbation is located in the middle <strong>of</strong> the<br />
computational domain <strong>and</strong>, in order for it to be linear (that is p ′ /p
400<br />
t=0s<br />
250<br />
t=9s<br />
350<br />
200<br />
300<br />
150<br />
250<br />
100<br />
p’[Pa]<br />
200<br />
150<br />
p’[Pa]<br />
50<br />
100<br />
0<br />
50<br />
−50<br />
0<br />
0 2500 5000 7500 10000 12500 15000<br />
z[m]<br />
−100<br />
0 2500 5000 7500 10000 12500 15000<br />
z[m]<br />
250<br />
t=18s<br />
250<br />
t=33s<br />
200<br />
200<br />
150<br />
150<br />
100<br />
100<br />
p’[Pa]<br />
50<br />
p’[Pa]<br />
50<br />
0<br />
0<br />
−50<br />
−50<br />
−100<br />
0 2500 5000 7500 10000 12500 15000<br />
z[m]<br />
−100<br />
0 2500 5000 7500 10000 12500 15000<br />
z[m]<br />
Figure 7: Evolution <strong>of</strong> an initial pressure perturbation concentrated in the middle <strong>of</strong> the<br />
computational domain into distinct waves propagating in opposite directions. Gray solid<br />
line: ∆z = 200 m, dashed line: ∆z = 100 m, dotted line: ∆z = 50 m, dashed-dotted line:<br />
∆z = 25 m, black solid line: ∆z = 12.5 m.<br />
permits to explain why the upper wave is slower.<br />
Caracteristics for the simulation with 12.5 m-cells resolution at t = 9 s are given in Table 1.<br />
The velocity <strong>of</strong> little motions in the gas, |w ′ |, is found to be bigger in the upper perturbation.<br />
Although the same quantity <strong>of</strong> energy should be propagating in both directions, this difference<br />
may be explained by the fact that the density is smaller in the upper region yielding a<br />
bigger velocity w ′ .<br />
caracteristics at t = 9s lower peak upper peak<br />
z(t) 4775.0000 10075.0000<br />
T 0 (z) 238.9642 199.0194<br />
ρ 0 (z) 0.7704 0.4038<br />
w ′ (z, t) - 0.8243 1.2403<br />
p ′ (z, t) 194.1356 146.0013<br />
Table 1: Caracteristics for the simulation with 12.5 m-cells resolution at t = 9 s<br />
From linear acoustics, a relation between the pressure perturbation p ′ <strong>and</strong> the velocity<br />
perturbation w ′ at position z is given by<br />
p ′ = ±w ′ Z 0 . (74)<br />
29
where Z 0 = Z 0 (z) = ρ 0 (z)c 0 (z) is the impedance <strong>of</strong> the medium. This equation might provide<br />
an explanation for the difference in size between the two peaks. Calculations <strong>of</strong> p ′low <strong>and</strong> p ′up<br />
are made using the values <strong>of</strong> w ′ , ρ 0 <strong>and</strong> c 0 in Table 1 <strong>and</strong> give 196.7960 Pa <strong>and</strong> 141.6410 Pa<br />
for the lower <strong>and</strong> upper wave respectively. These values are close to the values <strong>of</strong> p ′ obtained<br />
in the simulation that figures in Table 1.<br />
As second test case, a top hat perturbation with half width <strong>of</strong> 800 m is initialised in<br />
the middle <strong>of</strong> the domain. This shape <strong>of</strong> perturbation is generally more difficult to simulate<br />
than a Gaussian shape as it features steep slopes. In this case, oscillations generally appear<br />
near the bottom <strong>and</strong> the top <strong>of</strong> these steep slopes. The background state <strong>and</strong> the integration<br />
method are the same than in the previous example.<br />
400<br />
t=0s<br />
300<br />
t=9s<br />
350<br />
250<br />
300<br />
200<br />
250<br />
150<br />
p’[Pa]<br />
200<br />
150<br />
p’[Pa]<br />
100<br />
100<br />
50<br />
50<br />
0<br />
0<br />
0 2500 5000 7500 10000 12500 15000<br />
z[m]<br />
−50<br />
0 2500 5000 7500 10000 12500 15000<br />
z[m]<br />
300<br />
t=18s<br />
250<br />
t=33s<br />
250<br />
200<br />
200<br />
150<br />
150<br />
p’[Pa]<br />
100<br />
p’[Pa]<br />
100<br />
50<br />
50<br />
0<br />
0<br />
−50<br />
0 2500 5000 7500 10000 12500 15000<br />
z[m]<br />
−50<br />
0 2500 5000 7500 10000 12500 15000<br />
z[m]<br />
Figure 8: Evolution <strong>of</strong> a top hat shaped pressure perturbation with 12.5 m resolution.<br />
Only a single simulation with 12.5 m resolution is presented here as an illustration. The<br />
evolution <strong>of</strong> the perturbation is shown in Figure 8. As the perturbation is superimposed<br />
onto a stratified background, the top does not appear flat in the first plot in 8. In the plots<br />
for t = 9, 18 <strong>and</strong> 33 s, the above mentioned oscillations can be observed <strong>and</strong> are relatively<br />
pronounced. The different amplitudes <strong>and</strong> propagation speeds <strong>of</strong> the two waves are analogous<br />
with the previous case. Finally, in the plot for t = 33 s the slope at the top <strong>of</strong> the perturbation<br />
is inverted due to the reflection at the boundary.<br />
Further tests with various values <strong>of</strong> filter coefficient should be performed in order to<br />
attempt to reduce the oscillations. Besides this, simulations with higher grid resolutions<br />
should be done as they might provide better results.<br />
30
4.4 Advection<br />
Advection <strong>of</strong> a density perturbation is done in a two-dimensional fluid <strong>of</strong> otherwise constant<br />
density (ρ = 1.25 kgm −2 ) that flows with constant velocity. The inital background state is<br />
the unstratified atmosphere described in section 3.6.2. A lateral wind speed <strong>of</strong> u = 20 ms −1<br />
is chosen (w = 0) <strong>and</strong> the temperature is set to 273.15 K in the whole domain. The density<br />
perturbation is initialised as a two-dimensional Gaussian distribution with 1/e-width <strong>of</strong> 400 m<br />
<strong>and</strong> maximum height <strong>of</strong> 10 −4 kgm −2 <strong>and</strong> centered in the middle <strong>of</strong> the domain. In order to<br />
avoid vertical acceleration <strong>of</strong> the density perturbation due to buoyancy forces, the gravitation<br />
acceleration is set to zero for these experiments. The model is integrated using Leapfrog<br />
scheme <strong>and</strong> space centered differences, <strong>and</strong> periodic boundary conditions are applied in both<br />
directions. An Asselin time filter with coefficient µ = 0.1 <strong>and</strong> a spatial filter with ν = 0.01<br />
are also used.<br />
A reference solution is computed with a grid resolution <strong>of</strong> 25 m <strong>and</strong> a time step <strong>of</strong> 2.5<br />
10 −2 s. It is obtained by progressively halving the grid-cells size, starting from ∆x = ∆z =<br />
100 m with ∆t = 0.1 s, <strong>and</strong> helding the ratio <strong>of</strong> ∆t/∆z constant.<br />
The evolution <strong>of</strong> the density perturbation can be seen in the ρ ′ solution from the reference<br />
simulation at t = 0, 20, 60, 100, 200 <strong>and</strong> 300 s in Figure 9. Contour interval is<br />
10 −5 kgm −2 <strong>and</strong> the contours represent values starting from 0 kgm −2 for the external line<br />
in the first plot <strong>of</strong> Figure 9 to 9 10 −5 kgm −2 for the smallest circle at the center <strong>of</strong> the perturbation.<br />
In addition, the u ′ , w ′ <strong>and</strong> p ′ fields from the reference simulation at 100 s are<br />
shown together in Figure 10. As the density perturbation is advected to the right with the<br />
fluid, small perturbations develop in the background density forming curved stripes. This<br />
can be attributed to pressure perturbations caused by the movement <strong>of</strong> the circular density<br />
perturbation. Then, as the bubble reaches the right-h<strong>and</strong> side boundary, it reenters on the<br />
other side <strong>of</strong> the domain due to the periodic boundary conditions. At 100 s, it is back in<br />
the center <strong>of</strong> the domain. A second <strong>and</strong> a third revolution are completed at 200 <strong>and</strong> 300 s.<br />
The propagation speed <strong>of</strong> the front <strong>of</strong> the perturbation is found to be <strong>of</strong> 20 ms −1 <strong>and</strong> the<br />
maximum u <strong>and</strong> w velocities are <strong>of</strong> 2.5 10 −9 ms −1 <strong>and</strong> 2 10 −9 ms −1 respectively.<br />
By comparing reference solutions at 0, 100, 200 <strong>and</strong> 300 s in Figure 9, a deformation<br />
<strong>of</strong> the perturbation with time is observed: the front becomes sharper. This deformation is<br />
more significant in ρ ′ solutions from simulations with lower resolutions, which are shown at<br />
100 s in Figure 11. Therefore the resolution should be high enough to preserve correct information.<br />
An other noticeable change is that the maximum value <strong>of</strong> density, in the central region<br />
<strong>of</strong> the perturbation, becomes smaller with time. (The number <strong>of</strong> contour lines in the<br />
plots <strong>of</strong> Figure 9 are <strong>of</strong> nine for 0 s <strong>and</strong> 100 s, eight for 200 s <strong>and</strong> seven for 300 s.) Again, this<br />
is more pronounced in the ρ ′ solutions from simulations with lower resolutions that are shown<br />
in Figure 11. This decrease <strong>of</strong> intensity in the center <strong>of</strong> the perturbation may be due to the<br />
diffusion introduced by the numerical smoothing filter. Even though the filter coefficient ν is<br />
the same for all simulations, it is important to remember that the physical diffusion K depends<br />
on the length <strong>of</strong> the spatial <strong>and</strong> temporal steps. Equation (72) is used to calculate the<br />
31
physical diffusion factor for the different resolutions <strong>and</strong> gives values <strong>of</strong> K 100m = 125 m 2 s −1 ,<br />
K 50m = 62.5 m 2 s −1 <strong>and</strong> K 25m = 31.25 m 2 s −1 . As the size <strong>of</strong> grid cells is halved, K is also<br />
divided by two, <strong>and</strong> therefore less diffusion is generated with higher grid resolution.<br />
1000<br />
∆x=∆z=25m , t=0s<br />
1000<br />
∆x=∆z=25m , t=100s<br />
800<br />
800<br />
600<br />
600<br />
z[m]<br />
z[m]<br />
400<br />
400<br />
200<br />
200<br />
0<br />
0 200 400 600 800 1000 1200 1400 1600 1800 2000<br />
x[m]<br />
∆x=∆z=25m , t=20s<br />
1000<br />
0<br />
0 200 400 600 800 1000 1200 1400 1600 1800 2000<br />
x[m]<br />
∆x=∆z=25m , t=200s<br />
1000<br />
800<br />
800<br />
600<br />
600<br />
z[m]<br />
z[m]<br />
400<br />
400<br />
200<br />
200<br />
0<br />
0 200 400 600 800 1000 1200 1400 1600 1800 2000<br />
x[m]<br />
∆x=∆z=25m , t=60s<br />
1000<br />
0<br />
0 200 400 600 800 1000 1200 1400 1600 1800 2000<br />
x[m]<br />
∆x=∆z=25m , t=300s<br />
1000<br />
800<br />
800<br />
600<br />
600<br />
z[m]<br />
z[m]<br />
400<br />
400<br />
200<br />
200<br />
0<br />
0 200 400 600 800 1000 1200 1400 1600 1800 2000<br />
x[m]<br />
0<br />
0 200 400 600 800 1000 1200 1400 1600 1800 2000<br />
x[m]<br />
Figure 9: Plots <strong>of</strong> ρ’ at 0, 20, 60, 100, 200 <strong>and</strong> 300 s for the 25 m resolution solution. Contour<br />
interval is 10 −5 kgm −2 <strong>and</strong> the contours are centered around 0 kgm −2 .<br />
32
1000<br />
u’ ∆x=∆z=25m t=100s<br />
800<br />
600<br />
z[m]<br />
400<br />
200<br />
0<br />
0 200 400 600 800 1000 1200 1400 1600 1800 2000<br />
x[m]<br />
w’ ∆x=∆z=25m t=100s<br />
1000<br />
800<br />
600<br />
z[m]<br />
400<br />
200<br />
0<br />
0 200 400 600 800 1000 1200 1400 1600 1800 2000<br />
x[m]<br />
p’ ∆x=∆z=25m t=100s<br />
1000<br />
800<br />
600<br />
z[m]<br />
400<br />
200<br />
0<br />
0 200 400 600 800 1000 1200 1400 1600 1800 2000<br />
x[m]<br />
Figure 10: Plots <strong>of</strong> u ′ (CI = 0.5 10 −9 ms −1 ), w ′ (CI = 0.5 10 −9 ms −1 ) <strong>and</strong> p ′ (CI = 0.5<br />
10 −7 Pa) at 100 s for 25 m resolution (CI: contour interval).<br />
33
1000<br />
∆x=∆z=100m , t=100s<br />
800<br />
600<br />
z[m]<br />
400<br />
200<br />
0<br />
0 200 400 600 800 1000 1200 1400 1600 1800 2000<br />
x[m]<br />
∆x=∆z=50m , t=100s<br />
1000<br />
800<br />
600<br />
z[m]<br />
400<br />
200<br />
0<br />
0 200 400 600 800 1000 1200 1400 1600 1800 2000<br />
x[m]<br />
∆x=∆z=25m , t=100s<br />
1000<br />
800<br />
600<br />
z[m]<br />
400<br />
200<br />
0<br />
0 200 400 600 800 1000 1200 1400 1600 1800 2000<br />
x[m]<br />
Figure 11: Plots <strong>of</strong> ρ’ at 100 s for 100, 50 <strong>and</strong> 25 m resolution.<br />
34
4.5 Buoyant bubble<br />
In order to study the behaviour <strong>of</strong> numerical methods, a st<strong>and</strong>ard non-linear test problem<br />
was designed for the ’Workshop on Numerical Methods for Solving Nonlinear Flow Problems’<br />
that was held at the NCSA in 1990 [8]. This test-problem consists in a density current in an<br />
otherwise homogeneous <strong>and</strong> isentropic two-dimentional fluid. It is initiated as a cold bubble<br />
<strong>of</strong> air that subsequently descends to the ground. Then, as the density current spreads out<br />
laterally at the bottom boundary, Kelvin-Helmholtz shear instability rotors form along the<br />
top <strong>of</strong> the cold air boundary. A grid-converged solution for this problem could be found in<br />
the literature <strong>and</strong> is shown in Figure 12.<br />
Figure 12: Plots <strong>of</strong> θ’ at 0, 300, 600 <strong>and</strong> 900 s for the 25 m resolution compressible reference<br />
solution [8]. Contour interval is 1 ◦ C <strong>and</strong> the contours are centered around 0 ◦ C.<br />
A background state that is in hydrostatic equilibrium is chosen but the potential temperature<br />
θ is set constant over the whole domain (N = 0). Then the Exner function π <strong>and</strong><br />
therefore also the pressure are computed from (59) with θ constant. A value <strong>of</strong> 10 5 Pa is<br />
chosen for the surface pressure <strong>and</strong> θ is set equal to the surface temperature <strong>of</strong> T s = θ =<br />
300 K. The lateral boundary conditions for the problem are the solid wall, <strong>and</strong> the vertical<br />
boundary conditions the solid wall with background, both are described in section 3.7. The<br />
size <strong>of</strong> the domain is <strong>of</strong> 6.4 km in the vertical direction <strong>and</strong> <strong>of</strong> 51.2 km in the lateral direction<br />
centered at x = 0 km. The temperature perturbation is specified by the following function<br />
⎧<br />
⎨ 0 if L > 1,<br />
∆T =<br />
⎩−15 cos(πL) + 1<br />
(75)<br />
if L 1,<br />
2<br />
where<br />
L =<br />
√<br />
( x − x c<br />
)<br />
x 2 + ( z − z c<br />
)<br />
r z 2 , (76)<br />
r<br />
35
x c = 0 m, x r = 4000 m, z c = 3000 m <strong>and</strong> z r =2000 m. The thermal perturbation has a<br />
minimum temperature <strong>of</strong> -15 ◦ C <strong>and</strong> is centered at x = 0 m <strong>and</strong> z = 3000 m. These initial<br />
conditions provide the negative buoyancy necessary to initiate a density current.<br />
The simulations are initiated with a thermal perturbation as described above <strong>and</strong> our<br />
model is integrated using Leapfrog <strong>and</strong> centered-in-space differences. Asselin <strong>and</strong> spatial<br />
filters are used to prevent oscillations in solutions. The value µ = 0.1 is chosen for all simulations,<br />
while ν is adjusted according to cells size <strong>and</strong> time step in order to always obtain a<br />
diffusion coefficient K <strong>of</strong> 75 m 2 s −1 , as this particular value is chosen for the reference problem<br />
in [8].<br />
Simulations are made using 80, 130 <strong>and</strong> 200 m resolution. According to [8], the flow features<br />
<strong>of</strong> the test problem should be adequately resolved for the first simulation <strong>and</strong> marginally<br />
resolved for the two others. The θ ′ solutions at 0, 300, 600 <strong>and</strong> 900 s from the three simulations<br />
are shown in Figure 13 <strong>and</strong> Figure 14.<br />
z[m]<br />
4000<br />
3000<br />
2000<br />
1000<br />
0<br />
80m<br />
t=0s<br />
z[m]<br />
4000<br />
3000<br />
2000<br />
1000<br />
0<br />
80m<br />
t=300s<br />
z[m]<br />
4000<br />
3000<br />
2000<br />
1000<br />
0<br />
80m<br />
t=600s<br />
z[m]<br />
4000 80m<br />
3000<br />
t=900s<br />
2000<br />
1000<br />
0<br />
0 2000 4000 6000 8000 10000 12000 14000 16000 18000<br />
x[m]<br />
Figure 13: Plots <strong>of</strong> θ’ at 0, 300, 600 <strong>and</strong> 900 s for the 80 m resolution solution.<br />
interval is 1 ◦ C <strong>and</strong> the contours are centered around 0 ◦ C.<br />
Contour<br />
Our model seems to be capable <strong>of</strong> correctly reproducing the basic characteristics <strong>of</strong> the<br />
flow in the test problem, even though the propagation speed <strong>of</strong> the density current is found<br />
to be slightly bigger in our model <strong>and</strong> the front <strong>of</strong> the perturbation ends a little further than<br />
in the reference model.<br />
In the solution from the 80 m resolution simulation, the three rotors are correctely reproduced.<br />
In the solution from the 130 m resolution simulation, the formation <strong>of</strong> the first<br />
rotor at 600 s is well reproduced. However, the third rotor is missing in the solution at 900 s.<br />
With 200 m resolution, the rotors are even less developed <strong>and</strong> there are significant quantitatives<br />
<strong>and</strong> qualitative differences between our solutions <strong>and</strong> the 25 m reference solution.<br />
36
4000<br />
4000<br />
z[m]<br />
3000<br />
2000<br />
1000<br />
0<br />
130m<br />
t=0s<br />
z[m]<br />
3000<br />
2000<br />
1000<br />
0<br />
200m<br />
t=0s<br />
4000<br />
4000<br />
z[m]<br />
3000<br />
2000<br />
1000<br />
0<br />
130m<br />
t=300s<br />
z[m]<br />
3000<br />
2000<br />
1000<br />
0<br />
200m<br />
t=300s<br />
4000<br />
4000<br />
z[m]<br />
3000<br />
2000<br />
1000<br />
0<br />
130m<br />
t=600s<br />
z[m]<br />
3000<br />
2000<br />
1000<br />
0<br />
200m<br />
t=600s<br />
z[m]<br />
4000<br />
3000<br />
2000<br />
1000<br />
130m<br />
t=900s<br />
0<br />
0 2000 4000 6000 8000 10000 12000 14000 16000 18000<br />
x[m]<br />
z[m]<br />
4000 200m<br />
3000<br />
t=900s<br />
2000<br />
1000<br />
0<br />
0 2000 4000 6000 8000 10000 12000 14000 16000 18000<br />
x[m]<br />
Figure 14: Plots <strong>of</strong> θ’ at 0, 300, 600 <strong>and</strong> 900 s for the 130 <strong>and</strong> 200 m resolution solutions.<br />
Contour interval is 1 ◦ C <strong>and</strong> the contours are centered around 0 ◦ C.<br />
As mentioned above, our simulations were made using the same diffusion constant (K<br />
= 75 m 2 s −1 ) as in the test problem in [8]. In consequence, our results are relatively noisy.<br />
In order to reduce this noise the value <strong>of</strong> the spatial filter coefficient ν should be increased.<br />
Results <strong>of</strong> a 130 m resolution simulation where ν is increased by a factor ten (ν=0.07) <strong>and</strong><br />
the solution previousely obtained for the 130 m resolution simulation (ν=0.007, Figure 14)<br />
are shown togheter in Figure 15.<br />
z[m]<br />
4000<br />
3000<br />
2000<br />
1000<br />
130m<br />
t=900s<br />
ν=0.007<br />
0<br />
0 2000 4000 6000 8000 10000 12000 14000 16000 18000<br />
x[m]<br />
z[m]<br />
4000<br />
3000<br />
2000<br />
1000<br />
130m<br />
t=900s<br />
ν=0.07<br />
0<br />
0 2000 4000 6000 8000 10000 12000 14000 16000 18000<br />
x[m]<br />
Figure 15: Plots <strong>of</strong> θ’ at 900 s for the 130 m resolution solutions with ν=0.007 (left) <strong>and</strong><br />
ν=0.07 (right).<br />
The solution with the stronger filter coefficient appears to be very smoothed. In this case<br />
it seems that part <strong>of</strong> the physical information is lost: the rotors form much slowlier. Moreover<br />
the propagation speed is reduced.<br />
These observations indicate that the results may be improved by adding more diffusion.<br />
The noise could be attenuated <strong>and</strong> the propagation speed reduced. So that our results would<br />
be even closer to the 25 m reference solution in Figure 12.<br />
37
5 Conclusion<br />
A two-dimensional finite volume method modeling the Euler equations on a Cartesian grid<br />
was developped. Several types <strong>of</strong> numerical fluxes <strong>and</strong> various time integration methods were<br />
implemented.<br />
The model using Leapfrog time integration <strong>and</strong> central differences in space with initial<br />
hydrostatic equilibrium conditions was found stable for integration times up to ten hours if<br />
a numerical smoothing filter was applied. Sensitivity to numerical filtering was tested using<br />
a one-dimensional model <strong>and</strong> indicated that the oscillations in solutions that occur with<br />
Leapfrog scheme could be controlled using an Asselin time filter. Small-scale noise generated<br />
by numerical dispersion could be reduced by applying <strong>of</strong> a smoothing filter. Results also<br />
indicated that the source term formulation has a important effect on the velocities <strong>of</strong> the<br />
winds generated by numerical imprecisions.<br />
Grid-converged solutions could be obtained for various problems. In one space dimension<br />
the simulation <strong>of</strong> sound waves gave satisfying results for a Gaussian perturbation <strong>and</strong> the<br />
behaviour <strong>of</strong> the numerical solutions is in agreement with physical intuition. In two dimensions,<br />
advection <strong>of</strong> a density perturbation demonstrated the ability <strong>of</strong> the model to reproduce<br />
correct propagation speed. Finally, numerical simulations <strong>of</strong> a density-current test-problem<br />
showed that the model is capable <strong>of</strong> correctly reproducing the essence <strong>of</strong> all the important<br />
physics <strong>of</strong> the flow.<br />
Further improvements can be made by solving the instability problems arising with the<br />
splitting technique. To this end, changes could be done in the splitting method to include the<br />
numerical diffusion term. Besides this the order <strong>of</strong> the time integration can also be improved<br />
using a third-order Runge-Kutta scheme for example. These two modifications should permit<br />
to gain in accuracy.<br />
The numerical model that was developed here was found to work well <strong>and</strong> gave satisfying<br />
results. As next step, the implementation <strong>of</strong> a cut-cell boundary condition can be<br />
performed as this would permit to treat complex topography on the lower boundary.<br />
6 Acknowledgements<br />
A would like to thank Oliver Fuhrer for his help <strong>and</strong> guidance during these four months. I<br />
would also like to thank Alain Clappier for <strong>of</strong>fering me the possibility to do my diploma work<br />
in the <strong>LPAS</strong> group <strong>and</strong> the people in the group for their support.<br />
38
A<br />
Derivation <strong>of</strong> the differential form from the integral form<br />
The transformation <strong>of</strong> the integral form <strong>of</strong> a conservation law<br />
∫∫<br />
∫<br />
d<br />
q(x, z, t)dxdz = − ⃗n ·<br />
dt<br />
⃗f(q)ds,<br />
Ω<br />
into a partial differential equation is possible provided that the functions q(x, z, t) <strong>and</strong> f(q)<br />
are sufficiently smooth. First, since Ω is independant <strong>of</strong> t, the time derivatives may be taken<br />
inside the integral in the left-h<strong>and</strong> side. If q <strong>and</strong> f are smooth, we can use the divergence<br />
theorem to convert the integral over ∂Ω into an integral over Ω<br />
∫<br />
∫∫<br />
⃗n · ⃗f(q)ds = ⃗∇ · ⃗f(q)dxdz,<br />
where the divergence <strong>of</strong> ⃗ f is<br />
∂Ω<br />
Ω<br />
∂Ω<br />
⃗∇ · ⃗f(q) = ∂<br />
∂x f(q) + ∂ ∂z g(q).<br />
Thus the integral form can be rewritten as<br />
∫∫<br />
∂<br />
Ω ∂t<br />
∫∫Ω<br />
q(x, z, t)dxdz = − ⃗∇ · ⃗f(q)dxdz.<br />
This leads to<br />
∫∫<br />
Ω<br />
[ ∂ ∂t q + ⃗ ∇ · ⃗f(q)]dxdz = 0.<br />
Since this integral must be zero over an arbitrary region Ω, the integr<strong>and</strong> must be identically<br />
zero, <strong>and</strong> this finally gives the differential equation<br />
∂<br />
∂t q + ∂<br />
∂x f(q) + ∂ g(q) = 0,<br />
∂z<br />
which is the differential form <strong>of</strong> the conservation law.<br />
39
References<br />
[1] D. R. Durran, Numerical Methods for Wave Equations in Geophysical Fluid Dynamics,<br />
Springer, New York, 1999.<br />
[2] H. Forrer, Second Order Accurate Boundary Treatment for Cartesian Grid Methods,<br />
Seminar fuer Angew<strong>and</strong>te Mathematik Eidgenoessische Technische Hochschule, Zuerich,<br />
Research Report No 96-13, 1996.<br />
[3] E. Godlewski, P.-A. Raviart, Numerical Approximation <strong>of</strong> Hyperbolic Systems <strong>of</strong> Conservation<br />
Laws, Springer, New York, 1996.<br />
[4] J. R. Holton, An Introduction to Dynamic Meteorology, Elsevier Academic Press, New<br />
York, fourth edition, 2004<br />
[5] R. J. LeVeque, Numerical Methods for Conservation Laws, Birkhaeuser Verlag, Basel,<br />
1990.<br />
[6] R. J. LeVeque, D. Calhoun, Cartesian Grid Methods for Fluid Flow in Complex Geometries,<br />
IMA Workshop on Computational Modeling in Biological Fluid Dynamics,<br />
1999.<br />
[7] R. J. LeVeque, Finite Volume Methods for Hyperbolic Problems, Cambridge University<br />
Press, Cambridge, 2002.<br />
[8] J. M. Straka, R. B. Wilhelmson, L. J. Wicker, K. K. Droegemeier, Numerical Solutions<br />
<strong>of</strong> a Non-linear Density Current: a Benchmark Solution <strong>and</strong> Comparisons, Int. Jour. for<br />
Numerical Methods in Fluids, vol.17, 1-22(1993).<br />
[9] G. B. Whitham, Linear <strong>and</strong> Nonlinear Waves, Wiley-Interscience, New York, 1974.<br />
40