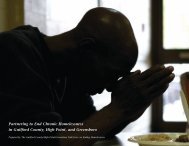
data - Greensboro Housing Coalition
data - Greensboro Housing Coalition
data - Greensboro Housing Coalition

Create successful ePaper yourself
Turn your PDF publications into a flip-book with our unique Google optimized e-Paper software.
The 2008 Annual Homeless<br />
Assessment Report<br />
July 2009<br />
U.S. Department of <strong>Housing</strong> and Urban Development<br />
Office of Community Planning and Development
FOREWORD<br />
I am pleased to submit the U.S. Department of <strong>Housing</strong> and Urban Development’s (HUD)<br />
2008 Annual Homeless Assessment Report (AHAR) to Congress. This report is the fourth in<br />
a series of annual reports about homelessness in the United States. The report breaks new<br />
ground by being the first report to provide year-to-year trend information that explores<br />
changes in the patterns of homelessness over time.<br />
The 2008 AHAR focuses on two types of national estimates of homelessness. Point-in-time<br />
estimates provide the total number of sheltered and unsheltered homeless persons on a<br />
single-night in January. These estimates are based on local community counts of homeless<br />
persons, and the report compares point-in-time estimates for 2006 through 2008. The report<br />
also provides one-year estimates of the total sheltered population based on information from<br />
local Homeless Management Information Systems. The one-year estimates account for<br />
persons who used a homeless residential program at any time during a 12-month period. The<br />
report compares one-year estimates for 2007 and 2008.<br />
I am especially pleased with this year’s report because community participation in the AHAR<br />
has grown significantly and is expected to continue during the next few years. Between 2007<br />
and 2008, the number of communities participating in the AHAR increased from 98 to 222,<br />
the largest one-year increase since HUD began collecting information for the AHAR.<br />
The report comes at a time of economic uncertainty and provides a few early indicators of<br />
how the economic downturn may be affecting the housing situation of low-income and<br />
vulnerable Americans. In these times, it is especially important to have comprehensive<br />
information about people who have become homeless. This latest report will be important in<br />
informing policy decisions and developing new strategies to prevent homelessness and assure<br />
decent affordable housing for our citizens.<br />
Shaun Donovan<br />
Secretary<br />
U.S. Department of <strong>Housing</strong> and Urban Development
ACKNOWLEDGEMENTS<br />
This 2008 Annual Homeless Assessment Report (AHAR) was developed by a team of<br />
researchers from Abt Associates Inc. and the University of Pennsylvania Center for<br />
Mental Health Services and Research. The team was led by Principal Investigators, Dr.<br />
Jill Khadduri (Abt) and Dr. Dennis Culhane (University of Pennsylvania). Dr. Alvaro<br />
Cortes (Abt) served as project director and was responsible for leading the <strong>data</strong> collection<br />
and analysis effort. Additional team members include: Tom Albanese, Larry Buron,<br />
Lauren Dunton, Nichole Fiore, Lindsay Fox, Tyronda Gibson, John Griffith, Mary Joel<br />
Holin, Emily Holt, Bulbul Kaul, Michelle Klausner, Joshua Leopold, Saty Patrabansh,<br />
Louise Rothschild, Kate Ryan, Brian Sokol, Brooke Spellman, K.P. Srinath, Matt White,<br />
and Jeff Smith (all from Abt Associates) and Stephen Poulin (University of<br />
Pennsylvania).<br />
The effort to develop an Annual Homeless Assessment Report began in 2002. Since<br />
then, the project has benefited greatly from the contributions of a number of HUD staff.<br />
Paul Dornan of the Office of Policy Development and Research, and Julie Hovden and<br />
Michael Roanhouse of the Office of Community Planning and Development have<br />
provided overall leadership and vision. The project has also benefited from the support of<br />
other HUD staff in the Office of Community Planning and Development, especially Mark<br />
Johnston and Ann Oliva. As a consultant to HUD, Dr. Martha Burt has provided<br />
thoughtful input on early drafts of the report.<br />
Finally, this project and this report could not have been possible without the participation<br />
of staff from Continuums of Care, local government agencies and nonprofit agencies<br />
responsible for HMIS implementation in communities across the country as well as<br />
HMIS software solution providers. Their continued commitment is greatly appreciated.
Table of Contents<br />
Executive Summary.............................................................................................................................i<br />
Point-in-Time Estimates of Homeless Persons in 2008..................................................................i<br />
One-Year Estimates of Sheltered Homeless Persons, October 2007-September 2008 ..............iii<br />
Sheltered Homeless People in 2008 ...............................................................................................iii<br />
Trends in Sheltered Homelessness, 2007-2008.............................................................................iv<br />
The Nationwide Capacity of Residential Programs for Homeless People ...................................v<br />
Looking Ahead ................................................................................................................................vi<br />
Chapter 1 Introduction......................................................................................................................1<br />
1.1 History of the AHAR ..........................................................................................................1<br />
1.2 AHAR Estimates for 2008..................................................................................................2<br />
1.3 This Report...........................................................................................................................4<br />
1.4 Trends in Homelessness and the Economic Crisis............................................................5<br />
Chapter 2 National Estimates of All Homeless People, Sheltered and Unsheltered................7<br />
2.1 PIT Counts of Homeless People.........................................................................................8<br />
2.2 Trends in PIT Counts of Homeless People........................................................................9<br />
2.3 PIT Counts of Homeless Subpopulations ........................................................................15<br />
2.4 Estimates of Sheltered Homeless Individuals and Families During a One-Year<br />
Period.................................................................................................................................18<br />
2.5 Summary of the National Estimates of All Homeless People........................................21<br />
Chapter 3 Sheltered Homeless People in 2008.............................................................................23<br />
3.1 Characteristics of People Using Homeless Shelters, 2008 .............................................23<br />
3.2 Location of Homeless Service Use, 2008........................................................................33<br />
3.3 Patterns of Homeless Service Use, 2008 .........................................................................36<br />
3.4 Summary of All Sheltered Homeless People in 2008.....................................................39<br />
Chapter 4 Trends in Sheltered Homelessness between 2007 and 2008....................................41<br />
4.1 Changes in the Sheltered Homeless Population between 2007 and 2008 .....................42<br />
4.2 Changing Patterns of Becoming Homeless, 2007-2008 .................................................47<br />
4.3 Changing Use of the Residential System for Homeless People, 2007-2008.................50<br />
4.4 Summary of Trends in Sheltered Homelessness between 2007 and 2008 ....................56<br />
Chapter 5 The Nationwide Capacity of Residential Programs for Homeless People............59<br />
5.1 Inventory of Residential Programs and Beds, 2008........................................................59<br />
5.2 Geographic Location of Beds, 2008.................................................................................63<br />
5.3 Bed Utilization and Turnover Rates, 2008 ......................................................................66<br />
5.4 Changes in the National Inventory of Residential Programs and Beds, 2006-2008.....68<br />
5.5 Summary of the Nationwide Capacity of Residential Programs for Homeless<br />
People.................................................................................................................................72<br />
Chapter 6 Looking Ahead...............................................................................................................75<br />
6.1 The 2009 AHAR................................................................................................................76<br />
Appendix A: List of 2008 AHAR Sample Sites and Contributing Communities<br />
Appendix B: Data Collection and Analysis Methodology<br />
Appendix C: Continuum of Care Point-in-Time Counts of Homeless Persons<br />
Appendix D: Counts of Homeless Sheltered Persons Using HMIS Data
Executive Summary<br />
The U.S. Department of <strong>Housing</strong> and Urban Development (HUD) is pleased to present the<br />
2008 Annual Homeless Assessment Report (AHAR), the fourth in a series of reports on<br />
homelessness in the United States. The reports respond to a series of Congressional<br />
directives calling for the collection and analysis of <strong>data</strong> on homelessness. The 2008 AHAR<br />
breaks new ground by being the first report to provide year-to-year trend information on<br />
homelessness in the United States. The report provides the latest counts of homelessness<br />
nationwide—including counts of individuals, persons in families, and special population<br />
groups such as veterans and chronically homeless people. The report also covers the types of<br />
locations where people use emergency shelter and transitional housing; where people were<br />
just before they entered a residential program; how much time they spend in shelters over the<br />
course of a year; and the size and use of the U.S inventory of residential programs for<br />
homeless people. This AHAR also is the first to compare Point-in-Time estimates reported<br />
by Continuums of Care across several years.<br />
Data Sources Used in the AHAR<br />
The AHAR is based on two <strong>data</strong> sources:<br />
1. Continuum of Care applications are submitted to HUD annually as part of the<br />
competitive funding process and provide one-night, Point-in-Time (PIT) counts of both<br />
sheltered and unsheltered homeless populations. The PIT counts are based on the<br />
number of homeless persons on a single night during the last week in January, and the<br />
most recent PIT counts for which <strong>data</strong> are available nationally were conducted in<br />
January 2008.<br />
2. Homeless Management Information System (HMIS) are electronic administrative<br />
<strong>data</strong>bases that are designed to record and store client-level information on the<br />
characteristics and service needs of homeless persons. HMIS <strong>data</strong> is used to produce<br />
counts of the sheltered homeless population over a full year—that is, people who used<br />
emergency shelter or transitional housing programs at some time during the course of a<br />
year. The 2008 AHAR uses HMIS <strong>data</strong> for the most recent, one-year reporting period<br />
and compares these <strong>data</strong> to previous HMIS-based findings.<br />
Point-in-Time Estimates of Homeless Persons in 2008<br />
On a single night in January 2008, there were 664,414 sheltered and unsheltered homeless<br />
persons nationwide. Nearly 6 in 10 people who were homeless at a single point-in-time were<br />
in emergency shelters or transitional housing programs, while 42 percent were unsheltered on<br />
the “street” or in other places not meant for human habitation.<br />
Executive Summary<br />
i
About three-fifths of the people homeless on a single night were homeless as individuals (62<br />
percent), while two-fifths (38 percent) were homeless as part of a family. Family members<br />
were much less likely than individuals to be unsheltered. About 27 percent of all homeless<br />
family members were unsheltered on the night of the point-in-time count, while almost half<br />
of homeless individuals were unsheltered.<br />
One-day PIT counts of homelessness changed little between 2007 and 2008: the total number<br />
of homeless persons decreased by about 1 percent or 7,500 people.<br />
Information from CoC applications includes counts of particular homeless subpopulations,<br />
including people whose homelessness is chronic—that is, individuals with disabilities and<br />
long or frequent patterns of homelessness. National policy has focused on ending chronic<br />
homelessness through funding incentives to develop permanent supportive housing and<br />
through the dissemination of best practice strategies for reducing chronic homelessness.<br />
Measuring the scope of chronic homelessness remains challenging, however, and thus the<br />
PIT estimates of persons experiencing chronic homelessness that are reported in CoC<br />
applications should be interpreted as approximations. The January 2008 PIT estimate of<br />
chronic homelessness is 124,135 persons, or 30 percent of all homeless individuals. The PIT<br />
count of chronically homeless persons in 2008 is nearly identical to the count in 2007.<br />
The concentration of homeless persons in a state—or the estimated number of homeless<br />
persons as a percent of the state’s total population—varies considerably across the United<br />
States. On a single night in January 2008, the states with the highest concentrations of<br />
homeless people were Oregon (0.54 percent of the state’s population), Nevada (0.48 percent),<br />
Hawaii (0.47 percent), and California (0.43 percent). More than half of all homeless people<br />
on a single night in January 2008 were found in just five states: California (157,277), New<br />
York (61,125), Florida (50,158), Texas (40,190) and Michigan (28,248). Their share is<br />
disproportionate, as these states constitute only 36 percent of the total U.S. population.<br />
Mississippi, South Dakota, and Kansas had the nation’s lowest concentration of homeless<br />
persons.<br />
Homelessness is heavily concentrated in urban areas. For example, 91 percent of Nevada’s<br />
homeless population was located in the Las Vegas CoC and almost 67 percent of Michigan’s<br />
homeless population was in the Detroit CoC. Other states with high concentrations of<br />
homeless persons in urban areas included: Arizona (60 percent were located in the Phoenix<br />
Continuum of Care), Pennsylvania (nearly 50 percent were located in Philadelphia CoC), and<br />
California (40 percent were located in the Los Angeles CoC). In both 2007 and 2008, one in<br />
five people homeless on a single night in January were in Los Angeles, New York, or<br />
Detroit.<br />
Executive Summary<br />
ii
One-Year Estimates of Sheltered Homeless Persons, October 2007-<br />
September 2008<br />
About 1.6 million persons used an emergency shelter or a transitional housing program<br />
during the 12-month period (October 1, 2007 through September 30, 2008), suggesting that 1<br />
in every 190 persons in the United States used the shelter system. The nation’s sheltered<br />
homeless population over a year’s time included approximately 1,092,600 individuals (68<br />
percent) and 516,700 persons in families (32 percent). A family is a household that includes<br />
an adult 18 years of age or older and at least one child. All other sheltered homeless people<br />
are considered individuals. Considered as households rather than separate people, there were<br />
159,142 sheltered families, about 14 percent of all sheltered homeless households.<br />
The total number of sheltered homeless persons remained essentially unchanged between<br />
2007 and 2008, increasing by only 5,200 people. However, the household composition of the<br />
sheltered homeless population shifted somewhat between 2007 and 2008. The number of<br />
homeless individuals was fairly stable, while homelessness among persons in families<br />
increased by about 43,000 or 9 percent. Accordingly, the share of family households among<br />
all sheltered households also increased, by nearly 3 percentage points.<br />
Sheltered Homeless People in 2008<br />
The one-year estimates based on HMIS <strong>data</strong> include detail on the demographic<br />
characteristics of the 1.6 million people who were homeless in a shelter some time over the<br />
course of a year, where they were before they entered the residential program, and for how<br />
much of the year they stayed in the shelter.<br />
The most common demographic features of all sheltered homeless people are: male,<br />
members of minority groups, older than age 31, and alone. More than two-fifths of sheltered<br />
homeless people have a disability. At the same time, sizable segments of the sheltered<br />
homeless population are white, non-Hispanic (38 percent), children (20 percent), or part of<br />
multi-person households 1 (33 percent).<br />
Approximately 68 percent of the 1.6 million sheltered homeless people were homeless as<br />
individuals and 32 percent were persons in families. When compared to family members,<br />
people who use the homeless residential system as individuals are particularly likely to be<br />
men, middle aged (between the ages of 31 and 50), and to have a disability. About 13<br />
percent of sheltered homeless individuals are veterans. By contrast, sheltered homeless<br />
families are very likely to be headed by a woman under age 30 without a male partner. A<br />
1<br />
This includes multi-adult and multi-child households that are counted in the AHAR as separate individuals,<br />
as well as family households composed of at least one adult and one child.<br />
Executive Summary<br />
iii
majority of homeless families have 2 or 3 members. Half of all children in families are 5<br />
years old or younger.<br />
In 2008 more than two-thirds of all sheltered homeless people were located in principal<br />
cities, with 32 percent located in suburban or rural jurisdictions. Nearly 1 in every 66<br />
persons living in principal cities in the United States accessed a homeless shelter, compared<br />
to about 1 in every 450 persons living in suburban or rural areas. Individual sheltered<br />
homeless people are more heavily concentrated in urban areas than sheltered homeless<br />
families. Seventy-one percent of individuals access residential services for homeless people<br />
in principal cities of metropolitan areas (formerly called central cities), compared to 62<br />
percent of persons in families.<br />
About two-fifths of people entering an emergency shelter or transitional housing program<br />
during 2008 came from another homeless situation (sheltered or unsheltered), two-fifths<br />
came from a housed situation (in their own or someone else’s home), and the remaining onefifth<br />
were split between institutional settings or other situations such as hotels or motels.<br />
Families were particularly likely to be housed the night before becoming homeless: more<br />
than 6 in 10 were either in their own housing unit (19 percent), staying with family (28<br />
percent), or staying with friends (15 percent).<br />
Most people had relatively short lengths of stay in emergency shelters: three-fifths stayed<br />
less than a month, and a third stayed a week or less. Stays in transitional housing were<br />
longer: about 40 percent stayed 6 months or more in 2008. Nearly 1 in 5 people in<br />
transitional housing was there for the entire year.<br />
Trends in Sheltered Homelessness, 2007-2008<br />
The 2008 AHAR is the first to report year-to-year trend information about homelessness in<br />
the United States. These estimates compare the HMIS-based <strong>data</strong> for October 2007 through<br />
September 2008 with the <strong>data</strong> for October 2006 through September 2007. Overall, the total<br />
number of sheltered homeless persons was about the same in both 2007 and 2008, about 1.6<br />
million people. Homelessness among individuals remained relatively unchanged, but the rise<br />
in family homelessness was considerable, with an increase of 43,000 persons in families, or 9<br />
percent, from 2007. The share of people in families who are sheltered increased from 29<br />
percent to 32 percent.<br />
Sheltered homelessness among individuals may be characterized increasingly by people with<br />
relatively high needs. Between 2007 and 2008, the share of sheltered homeless individuals<br />
who were in institutional settings (e.g., prisons, jails, or inpatient facilities) the night before<br />
they became homeless increased. Also, among persons who provided information, the share<br />
of sheltered homeless adults who report a disability increased, and the percentage of<br />
individual homeless people with very short stays in emergency shelter declined. These shifts<br />
Executive Summary<br />
iv
may suggest that communities have achieved some success in preventing homelessness<br />
among individuals with less severe needs, thereby resulting in a sheltered homeless<br />
population with greater needs.<br />
The numbers of both sheltered homeless individuals and sheltered homeless family members<br />
dropped somewhat in principal cities. The numbers of both populations increased<br />
substantially in suburban and rural areas. The share of the sheltered homeless population in<br />
suburban and rural areas grew from 23 percent in 2007 to 32 percent in 2008. The increase<br />
does not reflect increased capacity of residential programs in suburban and rural areas, but<br />
instead more intensive use of that capacity.<br />
The 2008 reporting period ended just as the economic recession was accelerating, thus it may<br />
be premature to expect impacts on sheltered homelessness. Nonetheless, there are some<br />
possible early indications of how sheltered homelessness may be changing during the<br />
economic downturn. The first indication is the rise in family homelessness, which is<br />
considered to be more sensitive to economic conditions than homelessness among<br />
individuals. Second, between 2007 and 2008 there was a decrease in the share of people who<br />
reported they were already homeless prior to entering a homeless residential program and an<br />
increase in those who reported that they were living with family or friends the night before<br />
entering the homeless residential facility. This could reflect the economic downturn, because<br />
people tend to use all alternative housing options before resorting to the shelter system.<br />
Finally, a larger percentage of sheltered homeless persons came from stable accommodations<br />
prior to entering a facility—that is, they were in the place they spent the night before<br />
becoming homeless for a year or more.<br />
The Nationwide Capacity of Residential Programs for Homeless<br />
People<br />
In their annual applications to HUD, CoCs submit information on their inventories of<br />
residential beds for homeless people. In 2008, CoCs reported a total of 614,042 year-round<br />
beds nationwide, almost evenly divided among emergency shelters, transitional housing, and<br />
permanent supportive housing.<br />
For several years, one of HUD’s policy priorities has been the development of permanent<br />
supportive housing programs that provide a combination of housing and supportive services<br />
to formerly homeless people with disabilities. The number of permanent supportive housing<br />
beds in 2008 was 195,724, a 22 percent increase since 2006.<br />
Between 2007 and 2008, the rate at which beds in residential programs were used on an<br />
average day increased to 91 percent for emergency shelter and 83 percent for transitional<br />
housing. The increase was greatest for transitional housing programs in suburban and rural<br />
areas, which experienced a 10 percentage point increase, from 74 to 84 percent.<br />
Executive Summary<br />
v
Looking Ahead<br />
The 2009 AHAR will continue to provide Congress and the nation with updated counts of<br />
homelessness nationwide, including counts of individuals, persons in families, and special<br />
population groups such as chronically homeless people and persons with disabilities. The<br />
next report will also use HMIS-based trend <strong>data</strong> for three years, 2007-2009.<br />
The 2009 AHAR will also feature two important additions: a special chapter on homeless<br />
veterans and <strong>data</strong> on HUD’s efforts to prevent homelessness and re-house homeless people<br />
through the Homelessness Prevention and Rapid Re-<strong>Housing</strong> Program (HPRP). The chapter<br />
on homeless veterans comes at a time when many service men and women are returning from<br />
active duty in Iraq and being deployed to Afghanistan. Thus, the chapter will provide an<br />
important baseline understanding of homelessness among veterans that, in turn, can be used<br />
to assess how homelessness among veterans may change over time.<br />
Finally, as part of the American Recovery and Reinvestment Act of 2009, Congress allocated<br />
$1.5 billion for a Homelessness Prevention Fund, which supports HPRP. The purpose of<br />
HPRP is to provide homelessness prevention assistance to households who would otherwise<br />
become homeless—many due to the economic crisis—and to provide assistance to rapidly rehouse<br />
persons who are homeless. HUD will begin collecting <strong>data</strong> from HPRP programs<br />
nationwide and report this information in the 2009 AHAR.<br />
Executive Summary<br />
vi
Chapter 1<br />
Introduction<br />
This report is the fourth Annual Homeless Assessment Report (AHAR) and the first to<br />
provide year-to-year trend information on the prevalence of homelessness nationwide, the<br />
demographic characteristics of homeless people, and the way homeless people use the<br />
residential services system. The report provides the latest counts of homelessness<br />
nationwide—including counts of individuals, persons in families, and special population<br />
groups such as veterans and persons experiencing chronic homelessness. The report also<br />
covers the types of locations where people use emergency shelter and transitional housing;<br />
where people were just before they entered a residential program; how much time they spent<br />
in shelters over the course of a year; and the size and use of the U.S inventory of residential<br />
programs for homeless people.<br />
This report breaks new ground by being the first AHAR to compare annual sheltered counts<br />
from year to year. It is also the first report to compare Point-in-Time (PIT) counts across<br />
multiple years. These comparisons are useful for several reasons. First, the comparisons<br />
suggest whether homelessness is increasing or decreasing nationwide and thus help to gauge<br />
whether the nation’s policy responses are making progress toward preventing and ending<br />
homelessness. They also suggest how the portrait of homelessness—or the demographic<br />
composition of the homeless population—may be changing over time. This understanding<br />
helps both policymakers and practitioners to target particular homeless subpopulations that<br />
need additional assistance. Finally, annual comparisons reveal how shelter use patterns may<br />
be fluctuating, which, in turn, may prompt funding reallocations to support programs that are<br />
in high demand.<br />
1.1 History of the AHAR<br />
At the direction of Congress, the U.S. Department of <strong>Housing</strong> and Urban Development<br />
(HUD) created uniform national <strong>data</strong> definitions for local Homeless Management<br />
Information Systems (HMIS), instructed programs receiving HUD McKinney-Vento funding<br />
to report to those systems, and encouraged all programs for homeless people—regardless of<br />
their funding source—to report <strong>data</strong> to the HMIS. HMIS implementations have grown<br />
stronger over the past several years and, recognizing their usefulness for local planning and<br />
policy-making, an increasing number of emergency shelters and transitional housing<br />
programs participate in an HMIS. Emergency shelters and transitional housing programs are<br />
the primary providers of residential services to homeless persons.<br />
Six years ago, HUD established a nationally representative sample of communities and began<br />
working with those and other communities willing to provide their HMIS <strong>data</strong> to produce<br />
unduplicated estimates of users of emergency shelter and transitional housing. An<br />
Introduction 1
unduplicated estimate means that each person is counted once during a given time period,<br />
even if the person is served multiple times during that period. Since 2005, communities have<br />
been submitting unduplicated counts of shelter users as well as other information about their<br />
demographic characteristics and patterns of service use for analysis and reporting in the<br />
AHAR. HUD has supported local efforts to submit <strong>data</strong> to the AHAR by providing technical<br />
assistance on how to increase participation in HMIS among homeless service providers and<br />
on improving the accuracy and reliability of the <strong>data</strong>. Four reports have been submitted to<br />
Congress since HUD launched this effort:<br />
<br />
The first report (2005 AHAR) covered a three-month period in 2005 and was based<br />
on HMIS <strong>data</strong> reported by 63 communities.<br />
The second AHAR (2006 AHAR) covered six months, January through June 2006,<br />
and included information from 74 communities.<br />
<br />
<br />
The third AHAR (2007 AHAR) was the first report to cover an entire year, October<br />
2006-September 2007, and serves as the baseline for analyzing trends over time. For<br />
this report, the number of communities providing useable <strong>data</strong> had increased to 98.<br />
This 2008 AHAR uses HMIS <strong>data</strong> provided by 222 communities nationwide,<br />
covering about 40 percent of the total U.S. population, to produce nationwide<br />
estimates of sheltered homelessness. The report covers the period from October 2007<br />
through September 2008.<br />
In addition to supporting <strong>data</strong> collection through HMIS, HUD has required CoCs to report<br />
PIT <strong>data</strong> collected for a single night in January as part of communities’ applications for<br />
McKinney-Vento funding. PIT <strong>data</strong> provide a one-night “snapshot” of homelessness within<br />
each CoC. HUD provides technical assistance to communities on how to conduct these PIT<br />
counts, focusing on improving the accuracy of the counts by helping communities develop<br />
sound enumeration strategies. As a result, the reliability of PIT <strong>data</strong> has improved greatly<br />
over time. The CoC applications also provide information on the inventory of residential<br />
programs, beds, and units for homeless people.<br />
1.2 AHAR Estimates for 2008<br />
The AHAR provides two types of estimates. The CoC PIT <strong>data</strong> provide estimates of all<br />
people who are homeless either in shelters or in places not meant for human habitation<br />
(colloquially, “the street”). The HMIS <strong>data</strong> collected for the AHAR make it possible to<br />
present one-year estimates of all people who are sheltered homeless at some time during a<br />
year. Both types of estimates are important:<br />
<br />
The PIT <strong>data</strong> provide a total count of all homeless people on a single night in January<br />
and describe the share of people who are sheltered (i.e., in emergency shelter or<br />
Introduction 2
transitional housing) or unsheltered (i.e., in a place not meant for human habitation)<br />
on that night.<br />
<br />
The HMIS <strong>data</strong> provide a more detailed demographic profile of sheltered homeless<br />
people and their use of the residential services system during a one-year period.<br />
The estimated totals for 2008 are that:<br />
<br />
<br />
About 664,000 people were homeless—sheltered and unsheltered—on a single night<br />
in January 2008.<br />
About 1.6 million people were homeless in emergency shelters or transitional housing<br />
at some point during the year between October 1, 2007 and September 30, 2008.<br />
Definitions of Key Terms<br />
1. Individuals: The HMIS-based estimates of sheltered homeless individuals include single<br />
adults, unaccompanied youth, persons in multi-adult households, and persons in multi-child<br />
households. A multi-adult household is a household composed of adults only—no children<br />
are present. A multi-child household is composed of children only (e.g., parenting youth)—<br />
no adults are present.<br />
2. One-Year Sheltered Counts: 12-month counts of homeless persons who use an<br />
emergency shelter or transitional housing program at any time from October though<br />
September of the following year. The one-year counts are derived from communities’<br />
administrative <strong>data</strong>bases, or Homeless Management Information Systems (HMIS).<br />
3. Persons in Families: The HMIS-based estimates of homeless persons in families include<br />
persons in households with at least one adult and one child.<br />
4. Point-in-Time (PIT) Counts: One-night counts of both sheltered and unsheltered<br />
homeless populations. The one-night counts are reported on CoC applications and reflect<br />
a single-night during the last week in January.<br />
5. Principal City: Following guidance from the U.S. Office of Management and Budget, the<br />
AHAR replaces the term “central city” with “principal city.” The largest city in each<br />
metropolitan or micropolitan statistical area is designated a principal city, and other<br />
cities may qualify if specified requirements (population size and employment) are met.<br />
6. Sheltered: A homeless person who is in an emergency shelter or transitional housing<br />
program for homeless persons.<br />
7. Unsheltered: A homeless person who is living in a place not meant for human habitation,<br />
such as the streets, abandoned buildings, vehicles, parks, and train stations.<br />
Introduction 3
Data do not exist to support an unduplicated estimate of the total number of people who are<br />
sheltered and unsheltered homeless over the course of a year. 2 However, given the<br />
information provided in this report, it is roughly estimated that 2 million people were<br />
homeless—sheltered and unsheltered—at some time during 2008.<br />
1.3 This Report<br />
Chapter 2 provides more detail on the “counts” of homeless persons. The counts are based<br />
on the PIT estimates for individuals and members of families who are in shelters and on the<br />
streets, as well as the HMIS-based estimates of individuals and families who access a shelter<br />
at some time during 2008. The chapter describes trends in the PIT estimates over a threeyear<br />
period, 2006-2008, and also provides detail on how homelessness varies from state to<br />
state and for particular cities.<br />
Chapter 3 describes the sheltered homeless population in 2008. The chapter focuses on the<br />
demographic characteristics of sheltered homeless people and how they differ from the<br />
characteristics of people living in poverty. It also discusses the types of locations where<br />
people use emergency shelters and transitional housing programs and how people use<br />
residential programs (e.g., which programs they use and how long they stay).<br />
Chapter 4 focuses on trends in sheltered homelessness between 2007 and 2008. The<br />
chapter describes shifts in the homeless population between individuals and families, the<br />
changing geography of homelessness, and changes in the use of the residential system for<br />
homeless people. The chapter also reports changes in the patterns of becoming homeless—<br />
that is, where people said they were the night before entering an emergency shelter or a<br />
transitional housing program and how long they had been there.<br />
Chapter 5 documents the numbers and locations of residential programs for homeless<br />
people, including emergency shelters, transitional housing programs as well as permanent<br />
supportive housing. The chapter also reports how intensively emergency shelters and transitional<br />
housing programs are used and how that has changed over time.<br />
Appendix A provides a list of the communities providing useable <strong>data</strong> to this 2008 AHAR.<br />
Appendix B describes the methodology for selecting the nationally representative sample of<br />
communities, collecting and cleaning the <strong>data</strong>, and for weighting and adjusting the <strong>data</strong> to<br />
create the national estimates. Appendix C presents the PIT estimates for each state and CoC.<br />
Appendix D consists of detailed tables based on the HMIS <strong>data</strong>. The tables provide counts of<br />
2<br />
Adding the unsheltered count from the Point-in-Time estimate to the HMIS-based one-year count would<br />
miss people who were unsheltered on some other night during the year but not when the “street count” was<br />
conducted. On the other hand, adding the unsheltered count also would double-count the large fraction of<br />
the people who are unsheltered homeless on a particular night but who go to emergency shelters at some<br />
time during a year and are already counted in the HMIS <strong>data</strong>.<br />
Introduction 4
sheltered homeless people in numerous categories for 2007 and 2008 and are intended to<br />
supplement the information provided in the body of the report.<br />
1.4 Trends in Homelessness and the Economic Crisis<br />
This first year-to-year comparison of HMIS <strong>data</strong> on sheltered homelessness is of particular<br />
interest because of the economic and foreclosure crisis that began in December 2007.<br />
Changes across the two years provide an early glimpse at the effect of the recession on<br />
homelessness, but the full effect of the economic and foreclosure crisis has yet to be observed<br />
in the AHAR. The <strong>data</strong> collection period for the 2008 AHAR ended on September 30, 2008,<br />
just as the crisis was accelerating, yet the impact of the crisis continues to unfold throughout<br />
the United States. Also, as suggested in this report as well as in other studies, people who are<br />
in jeopardy of losing their homes due to unemployment or foreclosure typically rely on other<br />
housing options before resorting to the shelter system. For example, people often stay with<br />
family and friends until they either regain their financial footing, move to another location, or<br />
become homeless.<br />
Both PIT and HMIS <strong>data</strong> show that, while homelessness remains predominately an urban<br />
phenomenon and most people are homeless as individuals rather than as members of<br />
families, homelessness became more common among families between 2007 and 2008. This<br />
shift is probably related to the economic crisis, although it is unknown if it will persist.<br />
The <strong>data</strong> also show that, in spite of the economic crisis, there was a decline in homelessness<br />
in urban areas (defined as principal cities of metropolitan areas). This drop may reflect<br />
progress communities were making in ending chronic homelessness before the economic<br />
downturn. Chronic homelessness refers to individuals who have experienced repeated<br />
episodes of homelessness or have been homeless for several years. Ending chronic<br />
homelessness has been a national policy objective that has been supported by significant<br />
investments in developing permanent supportive housing. For several years communities<br />
have reported declines in the number of persons experiencing chronic homelessness.<br />
Introduction 5
Chapter 2<br />
National Estimates of All Homeless People,<br />
Sheltered and Unsheltered<br />
This chapter presents the most recent national estimates of all homeless people in the United<br />
States, both those who are in emergency shelters and transitional housing programs and those<br />
who are found in the annual “street count” to be in places not meant for human habitation.<br />
The chapter presents two types of estimates:<br />
1. One-night, Point-in-Time (PIT) counts of both sheltered and unsheltered homeless<br />
populations are based on <strong>data</strong> from the CoC applications, which are submitted to<br />
HUD annually and indicate the number of homeless persons during the last week in<br />
January. The most recent PIT counts for which <strong>data</strong> are available nationally were<br />
conducted in January 2008. 3 PIT counts include the “street counts” that, through a<br />
variety of methods, estimate the number of unsheltered homeless people in each<br />
community, as well as estimates of sheltered homeless people based on a census of<br />
shelter and transitional housing occupants on a particular night.<br />
2. Counts of the sheltered homeless population over a full year—that is, people who<br />
used emergency shelter or transitional housing programs at some time during the<br />
course of the year—are based on the longitudinal HMIS <strong>data</strong> collected by HUD from<br />
a nationally representative sample of communities. These one-year counts of<br />
sheltered homeless people account for people who used a residential program for<br />
homeless people at any time from October 1, 2007 through September 30, 2008.<br />
Using both types of estimates, the chapter:<br />
<br />
<br />
Presents the PIT counts of all sheltered and unsheltered homeless people,<br />
distinguishing between sheltered and unsheltered homeless people and between people<br />
who are homeless as individuals and as members of families. The chapter also describes<br />
how these estimates changed between 2006 and 2008 and provides detailed estimates for<br />
each state.<br />
Presents the PIT counts of homeless “subpopulations.” Subpopulations include<br />
people who are chronically homeless; people with severe mental illness and/or<br />
3<br />
A communitywide PIT count demands considerable local resources and planning. Therefore, HUD<br />
requires communities to conduct PIT counts biennially. In the past, some communities chose to conduct<br />
their counts in even-numbered years while others chose odd-numbered years. To synchronize the timing of<br />
communities’ PIT counts, HUD required all communities to conduct a count in 2007 and thereafter will<br />
require communities to conduct a count in alternating years. Nonetheless, about 67 percent of CoC chose<br />
to conduct a PIT count in 2008, which may not be representative of all communities nationwide.<br />
Chapter 2: National Estimates of All Homeless People, Sheltered and Unsheltered 7
substance abuse issues; veterans; unaccompanied youth; and people living with<br />
HIV/AIDS.<br />
<br />
Presents the one-year estimates of sheltered homeless people based on HMIS <strong>data</strong>,<br />
which are provided separately for individuals and persons in families. The chapter also<br />
describes how those estimates changed between 2007 and 2008. This summary of the<br />
one-year estimates is expanded in chapter 3, which discusses demographic characteristics<br />
and patterns of sheltered homelessness in 2008, and in chapter 4, which elaborates on<br />
trends in sheltered homelessness between 2007 and 2008.<br />
2.1 PIT Counts of Homeless People<br />
On a single night in January 2008, there were 664,414 sheltered and unsheltered homeless<br />
persons nationwide (see Exhibit 2-1). About 58 percent (386,361) were in emergency<br />
shelters or transitional housing programs, while 42 percent (278,053) were unsheltered.<br />
Exhibit 2-1: Homeless Individuals and Persons in Families by Sheltered Status,<br />
2008<br />
Household Type Number Percentage<br />
Total<br />
Sheltered 386,361 58.2%<br />
Unsheltered 278,053 41.8%<br />
Total 664,414 100.0%<br />
Individuals<br />
Sheltered 204,855 49.3%<br />
Unsheltered 210,347 50.7%<br />
Total 415,202 100.0%<br />
Persons in Families<br />
Sheltered 181,506 72.8%<br />
Unsheltered 67,706 27.2%<br />
Total 249,212 100.0%<br />
Source:<br />
2008 Continuum of Care Applications: Exhibit 1, CoC Point-in-Time Homeless Population and Subpopulations<br />
Charts<br />
Approximately three-fifths of those homeless on a single night in January 2008 were<br />
individuals, and about two-fifths were homeless as members of families. People who<br />
become homeless as individuals have different needs and experiences from parents who<br />
become homeless together with their children, and communities often have different<br />
approaches and discrete programs designed to serve these two population groups. As shown<br />
on Exhibit 2-1, family members were much less likely than individuals to be unsheltered<br />
(i.e., in a place not meant for human habitation): 27 percent of homeless family members<br />
were unsheltered in January 2008, compared to 51 percent of homeless individuals.<br />
8 Chapter 2: National Estimates of All Homeless People, Sheltered and Unsheltered
The higher sheltered rates among persons in families are<br />
expected because unsheltered situations can be particularly<br />
664,414 people were<br />
unsafe for children, and thus families tend to use all available<br />
homeless on a single options to avoid unsheltered homelessness. In addition,<br />
night in January 2008. many communities have explicit policies to reduce the<br />
number of children on the streets by using hotel or motel<br />
vouchers, churches, and other mechanisms to shelter<br />
homeless children. It is also possible that families who are on the verge of becoming literally<br />
homeless have more alternative housing options than homeless individuals because family<br />
and friends are less willing to let them go to a place not meant for human habitation. Finally,<br />
it is possible that in some communities, families have more access to shelter than individuals<br />
because the amount of shelter capacity for homeless families exceeds the need. (See chapter<br />
5 for information on the inventory of residential programs for homeless people.)<br />
2.2 Trends in PIT Counts of Homeless People<br />
One-day counts of homelessness changed little between 2007 and 2008: the total number of<br />
homeless persons decreased by about 1 percent or 7,500 people (see Exhibit 2-2). However,<br />
changes are more pronounced when considering homeless individuals and persons in families<br />
separately. The number of homeless individuals on a single night in January dropped by 2<br />
percent (about 8,200 people), while the number of homeless families increased very slightly<br />
(700 people in families). Accordingly, persons in families constitute a slightly larger share of<br />
the total homeless population (38 percent) in 2008 when compared to the estimates for 2007<br />
(37 percent). 4 As discussed later in this chapter and in chapter 4, the shift toward families<br />
between 2007 and 2008 was more pronounced on the one-year count of sheltered homeless<br />
people—that is, among people who were in emergency shelters or transitional housing<br />
programs at some time during the course of a year.<br />
The number of sheltered and unsheltered homeless persons on a single night in January<br />
declined much more over the two-year period, 2006 to 2008 (see Exhibit 2-3). From 2006 to<br />
2008, the total number of homeless persons dropped 13 percent (from 763,000 to 664,400),<br />
the number of homeless individuals declined 8 percent (or about -37,000 people), and the<br />
number of persons in families declined 19 percent (or -57,000 people). However, the<br />
declines leveled in 2008.<br />
4<br />
The decrease in homelessness among individuals and the increase among persons in families are also<br />
observed if the comparison of PIT <strong>data</strong> is limited to CoCs that conducted new counts in both 2007 and 2008.<br />
About 67 percent of CoCs conducted counts in both years. Among these CoCs, the total number of homeless<br />
persons decreased by less than one percent (or -2,000 people), including a 2 percent decrease among homeless<br />
individuals (-3,330 people) and a 1 percent increase among homeless persons in families (1,300 people). A<br />
communitywide PIT count demands considerable local resources and planning. Therefore, HUD requires<br />
communities to conduct PIT counts biennially—beginning in 2007 and every other year thereafter.<br />
Chapter 2: National Estimates of All Homeless People, Sheltered and Unsheltered 9
Exhibit 2-2: Point-in-Time Counts of Homeless Individuals and<br />
Persons in Families, 2007 and 2008<br />
500,000<br />
423,377 415,202<br />
Number of Homeless Persons<br />
400,000<br />
300,000<br />
200,000<br />
100,000<br />
248,511 249,212<br />
Individuals<br />
Persons in<br />
Families<br />
0<br />
2007 (N=671,888) 2008 (N=664,414)<br />
Source:<br />
2007 and 2008 Continuum of Care Application: Exhibit 1, CoC Point-in-Time Homeless<br />
Population and Subpopulations Charts<br />
Exhibit 2-3: Trends in Point-in-Time Count of Homeless Individuals<br />
and Persons in Families, 2006 –2008<br />
800,000<br />
759,101<br />
700,000<br />
671,888<br />
664,414<br />
600,000<br />
500,000<br />
400,000<br />
300,000<br />
452,580<br />
306,521<br />
423,377 415,202<br />
248,511 249,212<br />
All Homeless Persons<br />
Homeless Individuals<br />
Homeless Persons in<br />
Families<br />
200,000<br />
100,000<br />
0<br />
2006 2007 2008<br />
Source: 2006 through 2008 Continuum of Care Application: Exhibit 1, CoC Point-in-Time Homeless<br />
Population and Subpopulations Charts<br />
10 Chapter 2: National Estimates of All Homeless People, Sheltered and Unsheltered
Most of the decline took place between 2006 and 2007, rather than between 2007 and 2008.<br />
As noted in the 2007 AHAR, some of the decline between 2006 and 2007 may have been<br />
associated with improved methods for counting people, especially unsheltered persons who<br />
may be scattered throughout a community and hidden from enumerators who conduct the<br />
“street count.” For example, anecdotal evidence suggests that communities have improved<br />
their ability to identify and canvass areas with known homeless populations and develop<br />
appropriate statistical techniques to account for people who may have been missed through<br />
direct observation. By 2008, many communities had well-developed PIT count methods, and<br />
the estimates derived from these methods are reasonably reliable.<br />
According to the PIT <strong>data</strong>, the percentages of homeless people who were sheltered or<br />
unsheltered did not change for individuals between 2007 and 2008 or over the two-year<br />
period, as shown in Exhibit 2-4. However, sheltered rates among homeless persons in<br />
families increased from 66 percent in 2006 to nearly 73 percent in 2008. This finding may<br />
reflect improved standardization in the methods for counting the unsheltered homeless<br />
population.<br />
80%<br />
70%<br />
60%<br />
Exhibit 2-4: Percentage of Homeless Individuals and Persons in<br />
Families in Shelter, 2006 –2008<br />
66.4%<br />
56.4%<br />
71.8% 72.8%<br />
58.3% 58.2%<br />
50%<br />
40%<br />
49.6%<br />
50.3%<br />
49.3%<br />
Sheltered Persons in<br />
Families<br />
All Sheltered Homeless<br />
Persons<br />
30%<br />
Sheltered Individuals<br />
20%<br />
10%<br />
0%<br />
2006 2007 2008<br />
Source: 2006 through 2008 Continuum of Care Application: Exhibit 1, CoC Point-in-Time Homeless<br />
Population and Subpopulations Charts<br />
State PIT Counts of Homeless Persons<br />
Exhibit 2-5 presents the percentage of each state’s population represented by homeless<br />
persons on a single night in January 2008. The percentages are ranked from highest to<br />
lowest. (Appendix C provides the detailed PIT count information by state and Continuum of<br />
Chapter 2: National Estimates of All Homeless People, Sheltered and Unsheltered 11
Care). On a single night in January 2008, the states with the highest concentrations of<br />
homeless people were Oregon (0.54 percent or 20,653 people), Nevada (0.48 percent or<br />
12,610 people), Hawaii (0.47 percent or 6,061 people), and California (0.43 percent or<br />
157,277 people). These states also had high concentrations of homeless people in 2006 and<br />
2007. Mississippi, South Dakota, and Kansas had the nation’s lowest concentration of<br />
homeless persons.<br />
Exhibit 2-5: Estimates of Homeless Persons as a Percent of State’s Total<br />
Population, 2008 1<br />
Rank 2 State % # Rank 2 State % #<br />
1 Oregon 0.54% 20,653 26 Wyoming 0.14% 751<br />
2 Nevada 0.48% 12,610 27 Connecticut 0.13% 4,627<br />
3 Hawaii 0.47% 6,061 Missouri 0.13% 7,687<br />
4 California 0.43% 157,277 North Carolina 0.13% 12,411<br />
5 Washington 0.34% 21,954 South Carolina 0.13% 5,660<br />
6 New York 0.31% 61,125 Utah 0.13% 3,434<br />
7 Colorado 0.30% 14,747 32 Alabama 0.12% 5,387<br />
8 Michigan 0.28% 28,248 Indiana 0.12% 7,395<br />
9 Florida 0.27% 50,158 Louisiana 0.12% 5,481<br />
10 Alaska 0.24% 1,646 Pennsylvania 0.12% 15,378<br />
11 Massachusetts 0.22% 14,506 36 Arkansas 0.11% 3,255<br />
12 Nebraska 0.22% 3,985 Delaware 0.11% 933<br />
13 Georgia 0.20% 19,095 Illinois 0.11% 14,724<br />
Maine 0.20% 2,632 Iowa 0.11% 3,346<br />
15 Arizona 0.19% 12,488 Ohio 0.11% 12,912<br />
Kentucky 0.19% 8,137 Oklahoma 0.11% 3,846<br />
17 Texas 0.17% 40,190 Rhode Island 0.11% 1,196<br />
18 Maryland 0.16% 9,219 Virginia 0.11% 8,469<br />
New Jersey 0.16% 13,832 West Virginia 0.11% 2,016<br />
Tennessee 0.16% 9,705 45 Idaho 0.10% 1,464<br />
21 Minnesota 0.15% 7,644 North Dakota 0.10% 615<br />
Montana 0.15% 1,417 Wisconsin 0.10% 5,449<br />
New Hampshire 0.15% 2,019 48 Mississippi 0.07% 1,961<br />
New Mexico 0.15% 3,015 South Dakota 0.07% 579<br />
Vermont 0.15% 954 50 Kansas 0.06% 1,738<br />
1<br />
2<br />
District of Columbia, Puerto Rico, and U.S. Territories are not included: District of Columbia (1.02% or 6,044<br />
people), Puerto Rico (0.08% or 3,012 people), Virgin Islands (0.55% or 602 people), and Guam (0.47% or 725<br />
people).<br />
Rank is based on the number of homeless persons as a percent of the state’s total population.<br />
Sources: 2008 Continuum of Care Applications: Exhibit 1, CoC Point-in-Time Homeless Population and Subpopulations<br />
Chart; 2007 American Community Survey<br />
12 Chapter 2: National Estimates of All Homeless People, Sheltered and Unsheltered
More than half of all homeless people were found in just five states on a single night in<br />
January 2008: California (157,277), New York (61,125), Florida (50,158), Texas (40,190),<br />
and Michigan (28,248). Their share is disproportionate, as these states constitute only 36<br />
percent of the total U.S. population. Also, several<br />
western states had high concentrations of homeless<br />
persons, including Oregon, Nevada, California, and<br />
Washington.<br />
1 of every 200 people in<br />
Oregon, Nevada and Hawaii<br />
In 2008, only eight states had higher shares of their is homeless.<br />
homeless population in unsheltered locations than 1 of every 230 people in<br />
in shelters: California (70 percent unsheltered),<br />
California is homeless.<br />
Colorado (53 percent), Florida (59 percent),<br />
Georgia (54 percent), Hawaii (55 percent),<br />
Michigan (58 percent), Nevada (61 percent), and Oregon (52 percent). With the exception of<br />
Colorado and Michigan, all of these states are located in the South and Southwest where the<br />
warmer weather may make living in unsheltered locations more tenable.<br />
Exhibit 2-6 displays the percentage change in the size of the homeless population by state<br />
from 2007 to 2008. During this period, just over half (28 out of 50) of the states experienced<br />
a decline in their total PIT homeless population, resulting in nearly 20,000 fewer homeless<br />
persons in these jurisdictions on the night of the January PIT count.<br />
The states that experienced the largest reductions in their homeless populations between 2007<br />
and 2008 were West Virginia and Idaho (-16 percent), Arkansas and Arizona (-15 percent),<br />
and Tennessee and Virginia (-13 percent). Conversely, several states—especially states that<br />
are predominantly rural—witnessed large increases in their homeless populations, such as<br />
Mississippi (42 percent), Wyoming (40 percent), Montana and Missouri (23 percent), and<br />
Iowa (22 percent). Some of these states had relatively small numbers of homeless persons<br />
and thus slight changes in these numbers could result in large percentage changes. (The<br />
appendices in the report provide further details by state.) Nonetheless, an increase in<br />
homelessness among rural communities is also evident in the HMIS-based estimates, as<br />
discussed in chapter 4.<br />
Chapter 2: National Estimates of All Homeless People, Sheltered and Unsheltered 13
Exhibit 2-6: Percentage Change in the Point-in-Time Estimates of Homeless<br />
Persons by State, 2007-2008<br />
Source:<br />
2007 and 2008 Continuum of Care Application: Exhibit 1, CoC Point-in-Time Homeless Population and<br />
Subpopulations Charts<br />
Despite some increases in homelessness in rural areas, urban areas represented a large<br />
percentage of the total homeless population in many states in 2008. For example:<br />
<br />
<br />
<br />
<br />
<br />
<br />
Arizona: Nearly 6 in 10 homeless persons (58 percent) were located in the<br />
Phoenix/Mesa/Maricopa County CoC.<br />
Arkansas: More than one-half of the total homeless population (56 percent) was<br />
located in the Little Rock/Central Arkansas CoC.<br />
California: The Los Angeles City and County CoC had 44 percent of California’s<br />
total homeless population.<br />
Colorado: Nearly 6 in 10 homeless persons (58 percent) were located in the<br />
Metropolitan Denver Homeless Initiative CoC.<br />
Illinois: The Chicago CoC accounted for 41 percent of all homeless persons in Illinois.<br />
Michigan: Almost two-thirds of homeless persons (64 percent) were located in the<br />
Detroit CoC.<br />
14 Chapter 2: National Estimates of All Homeless People, Sheltered and Unsheltered
Nevada: The Las Vegas/Clark County CoC contained 91 percent of the state’s total<br />
homeless population.<br />
New Mexico: Albuquerque served more than 4 in 10 (42 percent) of the state’s<br />
homeless population.<br />
New York: More than 8 of 10 homeless persons (82 percent) were located in the New<br />
York City CoC.<br />
Pennsylvania: The Philadelphia CoC served nearly one-half of the homeless<br />
population (45 percent) in the state.<br />
Utah: Two-thirds of homeless persons (67 percent) were located in Salt Lake City and<br />
County CoC.<br />
On the night of the January 2008 PIT count, one in five homeless persons (20 percent) was<br />
located in Los Angeles, New York, and Detroit.<br />
2.3 PIT Counts of Homeless Subpopulations<br />
Information from CoC applications also includes counts of particular homeless subpopulations:<br />
people who are chronically homeless; people with severe mental illness; people who have<br />
substance abuse problems; veterans; unaccompanied youth; and people living with HIV/AIDS.<br />
Estimates of homeless subpopulations are only of sheltered homeless people.<br />
For many years, national policy was focused on ending<br />
About 124,000 of those chronic homelessness through funding incentives to<br />
found homeless on a<br />
develop permanent supportive housing and through the<br />
dissemination of best practice strategies for reducing<br />
single night in January<br />
chronic homelessness. Measuring the scope of chronic<br />
2008 were chronically homelessness remains challenging, because the definition<br />
homeless people.<br />
of chronic homelessness 5 is based on both historical<br />
information about a person’s experiences being homeless<br />
and specific demographic characteristics, and because communities have difficulty collecting<br />
such information for their PIT counts. Thus, the PIT estimates of chronically homeless<br />
persons reported in CoC applications should continue to be interpreted as approximations.<br />
On a single night in January 2008, CoCs reported a total of 124,135 persons experiencing chronic<br />
homelessness or about 19 percent of the total homeless population and 30 percent of homeless<br />
individuals. The number of chronically homeless persons declined considerably between 2006 and<br />
5<br />
A chronically homeless person is defined as an unaccompanied homeless individual with a disabling<br />
condition who has either been continuously homeless for a year or more or has had at least four episodes of<br />
homelessness in the past three years. To be considered chronically homeless, a person must have been on<br />
the streets or in emergency shelter (e.g., not in transitional or permanent housing) during these stays.<br />
Chapter 2: National Estimates of All Homeless People, Sheltered and Unsheltered 15
2007, but was level between 2007 and 2008 (Exhibit 2-7). The PIT count of chronically homeless<br />
persons in 2008 is nearly identical to the count in 2007 (the difference is +302 people). The<br />
proportion of sheltered, chronically homeless persons has increased slightly from the previous two<br />
years, from 34 percent in 2006 and 2007 to 37 percent in 2008.<br />
Comparing the 2008 count with previous estimates should be done with care, especially for<br />
subpopulations, because about one-third of CoCs did not conduct a new PIT count in 2008,<br />
but rather reported counts from their 2007 enumeration on their 2008 application. However,<br />
if the analysis is restricted to CoCs that conducted actual counts in 2007 and 2008, the<br />
number of chronically homeless persons remains essentially the same. Nonetheless, several<br />
large cities that did counts in both 2007 and 2008 reported sizable declines in the number of<br />
persons who were chronically homeless: New York City (-26 percent); Phoenix (-20<br />
percent); Philadelphia (-8 percent); and Boston (-7 percent).<br />
Exhibit 2-7: Point-in-Time Count of Chronically Homeless Persons, January<br />
2006 – January 2008<br />
180,000<br />
160,000<br />
155,623<br />
140,000<br />
123,833 124,135<br />
120,000<br />
Sheltered<br />
100,000<br />
80,000<br />
60,000<br />
66%<br />
66%<br />
63%<br />
Unsheltered<br />
Total Number of Chronically<br />
Homeless Persons<br />
40,000<br />
20,000<br />
34%<br />
34%<br />
37%<br />
0<br />
Source:<br />
2006 2007 2008<br />
2006 through 2008 Continuum of Care Application: Exhibit 1, CoC Point-in-Time Homeless<br />
Population and Subpopulations Charts<br />
CoCs also report counts of other sheltered subpopulations in their applications. According to this<br />
information, on a single night in January 2008:<br />
<br />
Veterans represented about 15 percent of the total sheltered adult population.<br />
16 Chapter 2: National Estimates of All Homeless People, Sheltered and Unsheltered
Persons living with HIV/AIDS accounted for 4 percent of sheltered adults and<br />
unaccompanied youth.<br />
Recent victims of domestic violence comprised almost 13 percent of all sheltered persons.<br />
Persons with severe mental illness represented about 26 percent of all sheltered<br />
homeless persons.<br />
Persons with chronic substance abuse issues accounted for 37 percent of sheltered adults.<br />
Unaccompanied youth represented 2 percent of the sheltered homeless population. 6<br />
The PIT estimates of homeless subpopulations are remarkably consistent for 2006, 2007, and<br />
2008 (Exhibit 2-8). The proportion of sheltered homeless persons in each category fluctuates<br />
by a few percentage-points across the years, but generally, the patterns are level.<br />
45%<br />
Exhibit 2-8: Point-in-Time Counts of Homeless Subpopulations,<br />
January 2006 – January 2008<br />
40%<br />
35%<br />
36.4%<br />
39.0%<br />
36.5%<br />
Chronic Substance Abusers<br />
30%<br />
25%<br />
25.3%<br />
27.6%<br />
26.3%<br />
Severely Mentally Ill<br />
20%<br />
15%<br />
10%<br />
15.5% 15.0% 15.1%<br />
12.6%<br />
13.0%<br />
12.8%<br />
Veterans<br />
Victims of Domestic Violence<br />
4.8%<br />
4.1%<br />
4.2%<br />
5%<br />
Persons with HIV/AIDS<br />
4.7%<br />
2.2%<br />
2.1%<br />
Unaccompanied Youth<br />
0%<br />
2006 2007 2008<br />
Source:<br />
2006 through 2008 Continuum of Care Application: Exhibit 1, CoC Point-in-Time Homeless<br />
Population and Subpopulations Charts<br />
6<br />
Information on homeless subpopulations may not be collected from all homeless persons, and as a result,<br />
the percentages reported in this report are based on different homeless populations (as the denominator in<br />
the percentage calculation). Subpopulation information is collected from sheltered adults only, sheltered<br />
adults and unaccompanied youth, or all sheltered persons.<br />
Chapter 2: National Estimates of All Homeless People, Sheltered and Unsheltered 17
2.4 Estimates of Sheltered Homeless Individuals and Families<br />
During a One-Year Period<br />
This section provides the estimates of the sheltered homeless population based on HMIS <strong>data</strong><br />
that covers a 12-month reporting period. The estimates account for homeless people who<br />
used an emergency shelter and/or a transitional housing program at any time from October 1,<br />
2007 through September 30, 2008. The annual estimates are based on an unduplicated count<br />
of persons served in emergency shelters and/or transitional housing, meaning that persons<br />
who used several residential facilities during the one-year reporting period are counted only<br />
once. The estimates are based on 427,201 records of homeless persons from 222<br />
jurisdictions nationwide, statistically adjusted to produce the national estimates.<br />
Who is Counted in the One-Year HMIS-based<br />
Estimates Reported in the AHAR?<br />
The one-year estimates account for sheltered homeless people who used an emergency<br />
shelter and/or a transitional housing program at any time from October 1, 2007 through<br />
September 30, 2008.<br />
The estimates do not account for:<br />
1. Homeless persons who lived on the streets or in places not meant for human habitation<br />
and did not access a residential homeless program during the one-year reporting<br />
period.<br />
2. Homeless persons who used only a domestic violence shelter and did not access a<br />
residential homeless program that serves the general homeless population. a<br />
3. Homeless persons in the U.S. Territories or Puerto Rico.<br />
a<br />
Domestic violence shelters include rape crisis centers, battered women’s shelters, domestic violence<br />
transitional housing programs, and other programs whose primary mission is to provide services to victims of<br />
domestic violence, dating violence, sexual assault, or stalking. Pursuant to the Violence against Women and<br />
Department of Justice Reauthorization Act of 2005, domestic violence shelter providers are prohibited<br />
from entering client information into an HMIS.<br />
Estimate of Sheltered Homeless Persons during a One-Year Period<br />
About 1,594,000 persons used an emergency shelter or a transitional housing program during<br />
the 12-month period October 1, 2007 through September 30, 2008, suggesting that about 1 in<br />
every 190 persons in the United States used a homeless residential facility at some point<br />
18 Chapter 2: National Estimates of All Homeless People, Sheltered and Unsheltered
during that time (see Exhibit 2-9). 7 The nation’s sheltered homeless population included<br />
approximately 1,092,612 individuals (68.6 percent) and 516,724 persons in families (32.4<br />
percent). Considered as households rather than separate people, there were 159,142 sheltered<br />
homeless families, representing about 14.4 percent of all sheltered homeless households. 8<br />
a<br />
b<br />
c<br />
d<br />
Exhibit 2-9: Estimates of Sheltered Homeless Individuals and Persons in Families<br />
During a One-Year Period, 2007-2008<br />
Total<br />
Number<br />
2007 2008<br />
% of<br />
Sheltered<br />
Homeless<br />
Population<br />
Total<br />
Number<br />
% of<br />
Sheltered<br />
Homeless<br />
Population<br />
Total Number of Sheltered Persons a 1,588,595 c 100% 1,593,794 c 100%<br />
Individuals b 1,115,054 d 70.2% 1,092,612 d 68.6%<br />
Persons in families 473,541 d 29.8% 516,724 d 32.4%<br />
Number of Sheltered Households<br />
with Children<br />
130,968 — 159,142 —<br />
These estimated totals reflect the number of homeless persons in the 50 states and the District of Columbia who used<br />
emergency shelters or transitional housing programs during the one-year period from October 1 through September 30 of<br />
the following year. The estimates do not cover the U.S. Territories and Puerto Rico and do not include persons served by<br />
“victim service providers.” The estimated totals include an extrapolation adjustment to account for people who use<br />
emergency shelters and transitional housing programs but whose jurisdictions do not yet participate in their respective<br />
HMIS. However, a homeless person who does not use an emergency shelter or transitional housing during the 12-month<br />
period is not included in this estimate. Percentages may not sum to 100 percent due to rounding.<br />
This category includes unaccompanied adults and youth as well as multi-adult households without children.<br />
This estimate includes unaccompanied individuals and persons in households. In 2007, the 95 percent confidence interval<br />
for the estimated number of sheltered homeless persons in the population was 1,043,775 to 2,133,415 persons (or +/-<br />
544,820 persons). In 2008, the 95 percent confidence interval is 1,180,758 to 2,006,830 (or +/- 413,036 persons).<br />
In both 2007 and 2008, approximately 1 percent of homeless persons were served both as an unaccompanied individual<br />
and a person in a family. In this exhibit, such people appear in both categories in 2008, so the total number of sheltered<br />
persons is slightly less than the sum of individuals and families.<br />
Source: Homeless Management Information System <strong>data</strong>, 2007-2008<br />
The total number of sheltered homeless persons was fairly stable between 2007 and 2008,<br />
increasing slightly by about 5,200 people (or 0.3 percent). However, the household<br />
composition of the sheltered homeless population shifted appreciably. Homelessness among<br />
individuals remained relatively unchanged, whereas homelessness among persons in families<br />
increased by about 43,000 (or 9 percent). Accordingly, the share of family households<br />
among all sheltered households also increased, by nearly 3 percentage points, from 11.7<br />
7<br />
8<br />
According to the U.S. Census Bureau, the estimated total U.S. population was 304,059,724 persons on July<br />
1, 2008.<br />
There were 1,092,612 homeless individuals, nearly all of whom were individual adult males, individual<br />
adult females, or unaccompanied youth. There were also 20,488 adults in multi-adult households.<br />
Assuming 2 adults per multi-adult household and each individual as a household, the percent of households<br />
that were families is 14.4 percent (or 159,142 divided by 1,102,856).<br />
Chapter 2: National Estimates of All Homeless People, Sheltered and Unsheltered 19
percent in 2007 to 14.4 percent in 2008. Chapter 4 explores trends in sheltered homelessness<br />
among individuals and persons in families in greater detail.<br />
The share of sheltered homeless people who are<br />
Although national individuals or persons in families differs between the<br />
estimates of the sheltered one-day count and the count over the course of a year<br />
homeless population show (see Exhibit 2-10). In 2008, about 338,900 people<br />
were in an emergency shelter or a transitional<br />
little change since 2007,<br />
housing program on an average day, about 21 percent<br />
homelessness increased by<br />
of the total annual estimate. On an average night,<br />
9 percent among persons individuals represented 57 percent of the sheltered<br />
in families.<br />
population, and persons in families represented 43<br />
percent. 9 However, the one-day estimates of the split<br />
between individuals and family members were very different from the one-year-estimates,<br />
which show that individuals comprised about 68 percent of people in shelters at some time<br />
during the year were individuals and only 32 percent were persons in families.<br />
Exhibit 2-10: Difference in Share of Sheltered Homeless Individuals and<br />
Persons in Families Between Average Night and Annual<br />
Estimates, 2008<br />
Average Night Estimate (N=338,910)<br />
One-Year Estimate (N=1,593,794)<br />
43.1%<br />
56.9%<br />
Individuals<br />
Persons in<br />
Families<br />
32.4%<br />
68.6%<br />
Individuals<br />
Persons in<br />
Families<br />
Source: Homeless Management Information System <strong>data</strong>, 2008<br />
The larger share of persons in families on an average day compared to a longer period is a<br />
pattern that has been observed in previous Annual Homeless Assessment Reports. The<br />
pattern highlights how individuals and persons in families use shelter differently. Families<br />
stay in shelters for longer periods than individuals. As a result, persons in families are more<br />
9<br />
The HMIS-based estimate for an average day between October 2007 and September 2008 was only slightly<br />
lower than the PIT estimate for a particular day in January 2008: about 386,400 people, of whom 53<br />
percent were individuals and 47 percent persons in families.<br />
20 Chapter 2: National Estimates of All Homeless People, Sheltered and Unsheltered
likely to be present on any particular day, and the share of persons in families will be higher<br />
on an average day than over the course of a year. The share of sheltered homeless people<br />
represented by persons in families diminishes over time (e.g., 3 months, 6 months, or 12<br />
months) as more individuals cycle in and out of the shelter system. 10 Chapter 3 provides<br />
more detail on the patterns of shelter use for homeless individuals and families.<br />
2.5 Summary of the National Estimates of All Homeless People<br />
In summary, the single-night, PIT count estimates are that:<br />
<br />
<br />
<br />
664,000 people were homeless in shelters or unsheltered, a 1 percent decline from<br />
2007. More than three-fifths (62 percent) were individuals and about two-fifths (38<br />
percent) were persons in families.<br />
Nearly 6 in 10 homeless persons (58 percent) were in an emergency shelter or<br />
transitional housing program and the rest were unsheltered—that is, in places not<br />
meant for human habitation.<br />
In 2008, states with the highest estimates of homeless persons as a percent of each<br />
state’s total population were Oregon, Nevada, and Hawaii (1 in every 200 people) and<br />
California (1 in every 230 people). These states also had high concentrations of<br />
homeless persons in both 2006 and 2007. Homelessness continues to be concentrated<br />
in CoCs that cover major U.S. cities.<br />
The one-year estimates based on HMIS are that:<br />
<br />
<br />
About 1,594,000 people used an emergency shelter and/or a transitional housing<br />
program during the 12-month period October 1, 2007 through September 30, 2008,<br />
suggesting that about 1 in every 190 people in the United States experienced sheltered<br />
homelessness.<br />
The total number of sheltered homeless persons remained relatively unchanged<br />
between 2007 and 2008. However, whereas homelessness among individuals was<br />
fairly stable, homelessness among persons in families increased by about 9 percent.<br />
10<br />
The 2007 Annual Homeless Assessment Report provides estimates of seasonal trends in the number of<br />
sheltered homeless people and the split between individuals and families, showing that estimates of the<br />
number of homeless individuals peak in January and reach their lowest point in October. Estimates of<br />
sheltered persons in families do not vary as much; they are highest during April and lowest in October.<br />
The 2008 HMIS-based estimates of seasonal trends are similar.<br />
Chapter 2: National Estimates of All Homeless People, Sheltered and Unsheltered 21
Chapter 3<br />
Sheltered Homeless People in 2008<br />
This chapter provides a profile of the roughly 1.6 million people who used an emergency<br />
shelter or transitional housing program at some time from October 2007 through September<br />
2008. The chapter is based on HMIS <strong>data</strong> reported by 222 jurisdictions nationwide, weighted<br />
to represent the entire nation. The chapter focuses on:<br />
• The demographic characteristics of sheltered homeless people. Who were the<br />
sheltered homeless? How did the characteristics of homeless persons compare to those<br />
of the overall population living in poverty and the U.S. population as a whole?<br />
• The location of homeless service use. In what types of communities (urban, suburban<br />
or rural) did people use emergency and transitional housing programs? Where did they<br />
stay before using residential homeless services?<br />
• The patterns of homeless service use. How did people use emergency and transitional<br />
housing programs? How long did people stay in homeless residential facilities?<br />
Each of these topics is discussed for the total sheltered population and then separately for<br />
individuals and for persons in families. The HMIS-based estimates of sheltered homeless<br />
individuals include single adults, unaccompanied youth, persons in multi-adult households, and<br />
persons in multi-child households. A multi-adult household is a household composed of adults<br />
only—no children are present. A multi-child household is composed of children only (e.g.,<br />
parenting youth)—no adults are present. The HMIS-based estimates of homeless persons in<br />
families include persons in households with at least one adult and one child.<br />
3.1 Characteristics of People<br />
Using Homeless Shelters, 2008<br />
Characteristics of All Sheltered<br />
Persons, 2008<br />
Approximately 68 percent of the 1,594,000 Adult men (64 percent of adults)<br />
sheltered homeless people were homeless as Minority (62 percent of all persons)<br />
individuals and 32 percent were persons in Age 31 to 50 (40 percent of all<br />
families. As displayed in Exhibit 3-1, more<br />
persons)<br />
than two-thirds of sheltered individuals were<br />
Alone (67 percent of all persons)<br />
single adult men, and about one-quarter were<br />
Disabled (43 percent of all adults)<br />
single adult women. Very few people were<br />
homeless together with other adults but no<br />
children, and very few were unaccompanied or parenting youth. Among persons in families, 60<br />
percent were children under age 18, and 40 percent were adults.<br />
Chapter 3: Sheltered Homeless People in 2008 23
Exhibit 3-1: Household Composition of Sheltered Individuals and Persons in<br />
Families, 2008<br />
Sheltered Individuals<br />
Persons in Families<br />
2.0%<br />
1.9%<br />
25.9%<br />
39.7%<br />
60.3%<br />
70.2%<br />
Single adult male<br />
Single adult female<br />
Unaccompanied youth and several-children households<br />
Several-adult households<br />
Adults in households with children<br />
Children in households with adults<br />
Sources: Homeless Management Information System <strong>data</strong>, 2008<br />
Characteristics of All Sheltered Persons<br />
A homeless person looks similar to a low-income housing tenant or other poor person, but<br />
considerably different from a typical person in the overall U.S. population (see Exhibit 3-2).<br />
Among the most common demographic features of sheltered homeless persons they are:<br />
male, 11 members of minority groups, older than age 31, and alone. More than two-fifths of<br />
sheltered homeless persons are disabled. 12 This demographic profile is likely to agree with<br />
commonly held perceptions about who is homeless in the United States. But while accurate, these<br />
perceptions should not overlook sizable segments of the sheltered homeless population that are<br />
white, non-Hispanic (38 percent), children (20 percent), homeless together with at least one other<br />
person (33 percent), or veterans (12 percent).<br />
11<br />
12<br />
Males represent 63 percent of the sheltered adult population and 61 percent of all sheltered homeless people.<br />
The gender of children who are homeless is almost evenly split between males and females, similar to the<br />
overall U.S. population.<br />
According to HUD’s HMIS Data and Technical Standards (69 FR 45888, July 30, 2004), a disabling<br />
condition includes a diagnosable substance abuse disorder. However, the U.S. Census Bureau does not<br />
include substance abuse disorders as a form of disability, and thus the broader definition used by HUD is<br />
likely to result in larger estimates of homeless persons with disabilities compared to the U.S. poverty and<br />
general population.<br />
24 Chapter 3: Sheltered Homeless People in 2008
Exhibit 3-2 Demographic Characteristics of Sheltered Homeless Persons in 2008<br />
Compared to the 2007 U.S. and Poverty Populations<br />
Characteristic<br />
Gender of Adults<br />
Percentage of All<br />
Sheltered Homeless<br />
Persons, 2008<br />
Percentage of the<br />
2007 U.S. Poverty<br />
Population<br />
Percentage of the<br />
2007 U.S.<br />
Population<br />
Male 64.0% 39.9% 48.7%<br />
Female 36.0% 60.1% 51.3%<br />
Ethnicity<br />
Non-Hispanic/non-Latino 80.5% 75.7% 85.0%<br />
Hispanic/Latino 19.5% 24.3% 15.0%<br />
Race<br />
White, Non-Hispanic 37.9% 45.7% 65.8%<br />
White, Hispanic 11.6% 12.9% 8.1%<br />
Black or African American 41.7% 23.1% 12.4%<br />
Other Single Race 3.4% 15.5% 11.5%<br />
Multiple Races 5.4% 2.8% 2.2%<br />
Age a<br />
Under age 18 20.4% 34.0% 24.6%<br />
18 to 30 22.5% 23.6% 18.1%<br />
31 to 50 40.3% 22.2% 28.6%<br />
51 to 61 14.0% 8.9% 13.6%<br />
62 and older 2.8% 11.0% 15.2%<br />
Household Size b<br />
1 person 66.7% 37.3% 47.5%<br />
2 people 9.3% 4.8% 2.2%<br />
3 people 9.5% 13.0% 11.5%<br />
4 people 7.0% 16.7% 18.2%<br />
5 or more people 7.5% 28.2% 20.5%<br />
Special Populations<br />
Veteran (adults only) c 11.6% 5.1% 10.5%<br />
Disabled (adults only) c 42.8% 30.7% 17.7%<br />
a<br />
b<br />
c<br />
Age is calculated based on a person’s first time in shelter during the one-year reporting period.<br />
If a person is part of multiple households or the household size changed during the reporting period, the household size reflects the size of the<br />
first household in which the person presented during the one-year reporting time period.<br />
Veteran and disability status are recorded only for adults in HMIS. The percentage calculations shown indicate the percent of homeless adults with<br />
this characteristic. Numerous records were missing information on disability status (22.0 percent) and veteran status (7.5 percent) in 2008. The<br />
percentage calculations include only persons whose disability and veteran status was known.<br />
Sources: Homeless Management Information System <strong>data</strong>, 2008; 2007 American Community Survey<br />
Chapter 3: Sheltered Homeless People in 2008 25
Nonetheless, the demographic groups that are overrepresented in the homeless population relative<br />
to the U.S. population as a whole are African Americans, adult males, single-person households,<br />
people age 31 to 50, and people with a disability. Veterans are also slightly overrepresented in the<br />
homeless population when compared to the overall U.S. population.<br />
African Americans. In 2008, African Americans comprised 41.7 percent of the homeless<br />
population, almost 3.5 times their share of the U.S. population. African Americans are<br />
disproportionately represented in the poverty population, but they are even more<br />
disproportionately represented in the homeless population. They represent a share of the<br />
homeless population 1.8 times higher than their share of the poverty population.<br />
The disproportionate representation of African Americans in the homeless population is<br />
related to urban concentrations of homelessness. According to <strong>data</strong> from the U.S. Census<br />
Bureau, about 53 percent of the African American population lives in principal cities<br />
compared to 23 percent of the white non–Hispanic population and 47 percent of the white<br />
Hispanic population.<br />
Adult males. Adult men were heavily overrepresented in the homeless population. More than<br />
three-fifths of homeless adults were men (64.0 percent) compared to 48.7 percent of the<br />
overall population and only 39.9 percent of the poverty population. The large proportion of<br />
adult men in the shelter system probably reflected several factors. Single men who are poor<br />
may be more vulnerable to homelessness because of large gaps in the Unemployment<br />
Insurance program and because the largest safety net programs, such as Temporary Assistance<br />
for Needy Families (TANF) and Social Security, are for families or elderly people. The share<br />
of unemployed workers receiving unemployment insurance has declined in recent decades and<br />
is currently only 37 percent. 13 The sizable gap in unemployment insurance coverage may be<br />
particularly perilous for men because poor women are likely to be accompanied by children<br />
and thus eligible for TANF. Adult poor men also have higher rates of substance abuse than<br />
women, but substance abuse has not been a categorical eligibility criterion for SSI since 1996.<br />
Thus, some women may fall through one social safety net but be caught by another; men may<br />
miss them all.<br />
In addition, men are more likely than women to have institutional histories that are related to<br />
homelessness, including incarceration. And finally, relatives may feel a stronger need to give<br />
a temporary home to families with children than they do to single men.<br />
However, the share of sheltered homeless men reported in the AHAR may be artificially high.<br />
Some shelters have policies prohibiting men over a certain age from sleeping in family<br />
shelters, requiring men and teenage boys to stay at men’s shelters alone. As a result, some of<br />
13<br />
Stone, Chad, Robert Greenstein, and Martha Coven. 2007. Addressing Longstanding Gaps in Unemployment<br />
Insurance Coverage. Washington D.C.: Center on Budget and Policy Priorities.<br />
26 Chapter 3: Sheltered Homeless People in 2008
the men who are being counted in the AHAR as unaccompanied individuals may be part of<br />
intact families that are housed elsewhere. 14 Also, the HMIS <strong>data</strong> presented here do not<br />
include adults served by domestic violence providers, most of whom are women.<br />
Single-person households. Two-thirds (67 percent) of the total sheltered population were in<br />
single-person households, nearly 2 times the proportion of these households in poverty and about<br />
1.5 times the national proportion. As shown in Exhibit 3-1, most homeless people in singleperson<br />
households were men, and thus the reasons both single-person households and men are<br />
disproportionately represented in the sheltered homeless population are likely the same.<br />
People age 31 to 50. Two-fifths (40 percent) of the sheltered homeless population were<br />
between the ages of 31 to 50, compared to only 29 percent of the total U.S. population and 22<br />
percent of the poverty population. Middle-aged people may be more likely to be homeless<br />
because substance abuse or mental illness issues become more acute during this life stage. If<br />
people have struggled for a while because of mental health, substance abuse, or financial<br />
issues, by age 30 or older they may have exhausted their alternatives for living with friends<br />
and family. The shelter system may be their last remaining option.<br />
People with disabilities. Among adults, 17.7 percent of the U.S. population had a disability<br />
whereas an estimated 42.8 percent of sheltered homeless adults had a disability. 15 A<br />
disability, particularly one relating to substance abuse or mental health issues, can make it<br />
difficult to work enough to afford housing. Indeed, the higher share of adults with disabilities<br />
in the poverty population (30.7 percent) relative to the U.S. population is an indication of this<br />
difficulty. People with disabilities are an even higher share of the homeless population than<br />
the poverty population, suggesting that disabled persons face additional difficulties in gaining<br />
access to permanent housing. People with disabilities may have difficulties searching for a<br />
unit or finding a landlord willing to rent to them. Their disability may make it less easy to<br />
accommodate them without adaptive supports.<br />
Also, the ability of SSI and SSDI to avert homelessness among persons with disabilities is<br />
uncertain. In 2009, the average monthly SSI payment was $504 16 (or about $6,048 annually) and<br />
14<br />
15<br />
16<br />
A study of patterns of homelessness among families in four communities—Houston TX, Washington DC,<br />
Kalamazoo MI, and upstate South Carolina—tracked people from their first entry into the homeless services<br />
system (based on HMIS <strong>data</strong>) for 18 months (30 months in DC) and found that many adults who were<br />
homeless as part of a family during part of the tracking period used shelters for individuals at other times<br />
during the tracking period. Brooke Spellman, Jill Khadduri, Brian Sokol, and Josh Leopold, Costs<br />
Associated with First-Time Homelessness for Families and Individuals. U.S. Department of <strong>Housing</strong> and<br />
Urban Development, forthcoming 2009.<br />
HUD’s definition of disabling condition is broader than the definition used by the U.S. Census Bureau. See<br />
footnote 12 for more information.<br />
U.S. Social Security Administration Office of Retirement and Disability Policy. Monthly Statistical<br />
Snapshot, March 2009. Available at http://www.ssa.gov/policy/docs/quickfacts/stat_snapshot/.<br />
Chapter 3: Sheltered Homeless People in 2008 27
the poverty rate for a single-person household was $10,830. 17 Accordingly, the average annual<br />
SSI payment is about 44 percent below the poverty level, and thus people with disabilities who<br />
lack a sufficient work history to qualify for SSDI—common among people with severe mental<br />
illness or substance abuse issues—are more susceptible to deep poverty.<br />
Veterans. The national estimates also show that veterans are slightly more likely to be<br />
represented in the sheltered homeless population than the general population. They comprise<br />
an estimated 11.6 percent of the adult homeless population compared to 10.5 percent of the<br />
U.S. adult population. But veterans are a much smaller share of the adult poverty population<br />
(5.1 percent) than the homeless population, in part because the adult poverty population<br />
includes fewer adult men who are the most likely to be veterans. The estimated number of<br />
homeless veterans should be watched closely as the number of veterans returning from recent<br />
combat increases during the next few years.<br />
Characteristics of Sheltered Homeless Individuals<br />
Characteristics of Sheltered<br />
Most sheltered homeless individuals are men. In<br />
Individuals, 2008<br />
2008, 70 percent of the roughly 1.1 million<br />
people who were in emergency shelter or<br />
Men alone (73 percent of adults)<br />
transitional housing programs as individuals were<br />
men and only 26 percent were adult women<br />
Minority (55 percent of all<br />
persons)<br />
staying alone (as shown in Exhibit 3-1). Seventythree<br />
percent of the individual adult population<br />
Age 31 to 50 (52 percent of all<br />
persons)<br />
are men (see Exhibit 3-3). For every 100 men<br />
Alone (98 percent of all persons)<br />
living by themselves with income below the<br />
Disabled (47 percent of adults)<br />
poverty line, 12 are likely to be in the sheltered<br />
homeless population at some time over the course<br />
of a year compared to 4 of every 100 women living<br />
alone in poverty. In contrast to individual sheltered homeless people, 55 percent of poor adults<br />
living alone are women. There is little research that explains why single men may more often<br />
go to shelters than single women.<br />
Exhibit 3-3 shows some other demographic features of the sheltered homeless population<br />
separately for individuals and for persons in families. Even though the majority of all sheltered<br />
persons are minorities, almost half of all individuals (44.6 percent) are non-Hispanic whites.<br />
Thus, many whites and minorities experience homelessness differently—whites more often as<br />
single persons and minorities more often as persons with accompanying children.<br />
17<br />
U.S. Department of Health and Human Services. The 2009 HHS Poverty Guidelines. Washington, DC.<br />
Available at http://aspe.hhs.gov/poverty/09poverty.shtml.<br />
28 Chapter 3: Sheltered Homeless People in 2008
Exhibit 3-3: Demographic Characteristics of Sheltered Homeless Persons by<br />
Household Type, 2008<br />
Characteristic<br />
Gender of Adults<br />
Percentage of All<br />
Sheltered Homeless<br />
Population<br />
Percentage<br />
of Individuals<br />
Percentage of<br />
Persons in Families<br />
Male 64.0% 72.5% 19.2%<br />
Female 36.0% 27.5% 80.8%<br />
Ethnicity<br />
Non-Hispanic/non-Latino 80.5% 83.0% 74.6%<br />
Hispanic/Latino 19.5% 17.0% 25.4%<br />
Race<br />
White, Non-Hispanic 37.9% 44.6% 24.4%<br />
White, Hispanic 11.6% 11.0% 13.1%<br />
Black or African-American 41.7% 37.0% 50.9%<br />
Other Single Race 3.4% 2.8% 4.8%<br />
Multiple Races 5.4% 4.7% 6.8%<br />
Age a<br />
Under age 18 20.4% 2.0% 60.3%<br />
18 to 30 22.5% 22.5% 21.5%<br />
31 to 50 40.3% 51.5% 16.7%<br />
51to 61 14.0% 20.0% 1.3%<br />
62 and older 2.8% 4.0% 0.2%<br />
Household Size b<br />
1 person 66.7% 97.8% 0.0%<br />
2 people 9.3% 1.9% 25.0%<br />
3 people 9.5% 0.2% 29.6%<br />
4 people 7.0% 0.1% 21.8%<br />
5 or more people 7.5% 0.0% 23.7%<br />
Special Populations<br />
Veteran (adults only) c 11.6% 13.4% 2.0%<br />
Disabled (adults only) c 42.8% 47.1% 18.4%<br />
a<br />
b<br />
c<br />
Age is calculated based on a person’s first time in shelter during the one-year reporting period.<br />
If a person is part of multiple households or the household size changed during the reporting period, the household size reflects the size of the<br />
first household in which the person presented during the one-year reporting time period.<br />
Veteran and disability status are recorded only for adults in HMIS. The percentage calculations shown indicate the percent of homeless adults with<br />
this characteristic. Numerous records were missing information on disability status (22.0 percent) and veteran status (7.5 percent) in 2008. The<br />
percentage calculations include only persons whose disability and veteran status was known.<br />
Source: Homeless Management Information System <strong>data</strong>, 2008<br />
Chapter 3: Sheltered Homeless People in 2008 29
A larger proportion of adult individuals are disabled or veterans compared to all sheltered<br />
homeless adults. Nearly half (47.1 percent) of adult individuals have disabilities, and 13.4 percent<br />
of adult individuals are veterans. Extensive research has shown high rates of alcohol/drug abuse<br />
and mental health problems among homeless adults. The higher rate of veterans among<br />
individuals compared with all homeless adults reflects the fact that the overwhelming majority of<br />
sheltered individuals are men.<br />
The most common age group among sheltered homeless individuals is 31-50. Only 4 percent of<br />
sheltered homeless individuals are 62 or older, much lower than the 27 percent of poor persons<br />
living alone in that age group (Exhibit 3-4). The scarcity of elderly people in the homeless<br />
population may reflect two factors: high early mortality and premature disability among persons<br />
experiencing chronic homelessness 18 and the strong social safety net in the United States for<br />
people aged 65 or older, including Supplemental Security Income (SSI), Social Security,<br />
Medicare, and public and other assisted housing for seniors. This safety net should help most<br />
vulnerable older single individuals avoid having to go to a shelter to secure a roof over their heads.<br />
Exhibit 3-4: Age Distribution of Sheltered Homeless Adult<br />
Individuals in 2008 Compared to Age Distribution of<br />
Persons in Poverty Living Alone in 2007<br />
100%<br />
90%<br />
80%<br />
70%<br />
60%<br />
50%<br />
40%<br />
30%<br />
20%<br />
10%<br />
0%<br />
4%<br />
20%<br />
55%<br />
21%<br />
Sheltered Adult Individuals,<br />
2008<br />
27%<br />
19%<br />
24%<br />
31%<br />
Individual Persons in Poverty,<br />
2007<br />
18 to 30 31 to 50 51 to 61 62 and older<br />
Sources: Homeless Management Information System <strong>data</strong> 2008; 2007American Community Survey<br />
18<br />
Barrow, S.M., D.B. Herman, P. Cordova, and E.L. Struening. 1999. Mortality among Homeless Shelter<br />
Residents in New York City. American Journal of Public Health, pp. 529-534; Hibbs, J. R., L. Benner,<br />
Lawrence, B., R.S. Klugman, I. Macchia, A. K. Mellinger, and D. Fife. 1994. Mortality in a Cohort of<br />
Homeless Adults in Philadelphia, The New England Journal of Medicine, Vol. 331(5): 304-309.<br />
30 Chapter 3: Sheltered Homeless People in 2008
Characteristics of Sheltered Persons in Families<br />
In 2008, there were about 517,000 persons in families,<br />
Characteristics of Sheltered<br />
representing 32 percent of all sheltered persons.<br />
Persons in Families, 2008<br />
Considered as households rather than separate people,<br />
there were about 159,000 sheltered families (or 14.4 Female adults (81 percent<br />
percent of all sheltered homeless households). The<br />
of adults)<br />
most common demographic features of sheltered family<br />
A minority (76 percent of<br />
members are that adults are women, children are<br />
all persons)<br />
young, the family identifies itself as belonging to a<br />
Children Under 6 (51<br />
minority group, and the family has 2 or 3 members.<br />
Very few persons in families are veterans (2 percent), percent of children)<br />
and less than 1 in 5 of the adults in families has a<br />
disability.<br />
Two or 3-person<br />
households (55 percent of<br />
all persons)<br />
Adults who become homeless together with children<br />
are usually, but not always, women. In 2008, 19<br />
percent of adults in families with children were men. Presumably most adults are parents of<br />
the children that accompany them, although some may be grandparents or other relatives. By<br />
comparison, men represent 33 percent of all adults in families living in poverty. 19<br />
Many persons in families are minorities, especially African Americans and Hispanics. Less<br />
than one-quarter of sheltered persons in families were white and not Hispanic (24 percent). A<br />
much higher percentage of sheltered homeless families were African American than of families<br />
in the poverty population (51 versus 26 percent), while a lower percentage of sheltered<br />
homeless family members were Hispanic or Latino compared to the poverty population (25<br />
versus 31 percent).<br />
A typical homeless family consists of a mother and either one or two children (the average<br />
number of children is 1.5). Such families would need a two-bedroom apartment or house for<br />
19<br />
People who become homeless as individuals also may be parents of minor children. Children of homeless<br />
individuals may be in the custody of the other parent, may have been left in someone else’s care rather than<br />
brought into a shelter, or may have been placed out-of-home by the child welfare system. Burt, Martha, Laudan<br />
Y. Aaron, and Edgar Lee, Helping America’s Homeless. Washington DC: Urban Institute Press, 2001, provides<br />
estimates based on the National Survey of Homeless Providers and Clients of the percentage of all homeless<br />
people who are parents of minor children. A study that used HMIS <strong>data</strong> to track homeless families in Houston<br />
TX, Washington DC, Kalamazoo MI, and Upstate South Carolina for an 18-month period used a somewhat<br />
different definition of family from the AHAR. For that study, a group of people was considered a family if it<br />
included both an adult and a child during any homeless program stay over the tracking period, whereas the AHAR<br />
defines a family as an adult with an accompanying child at the point of first entry into a residential program for<br />
homeless people. The study of homeless families in four communities found that a high percentage of families<br />
that had more than one program stay during the tracking period changed household composition between stays<br />
and that adult members of families sometimes appeared in programs for individuals during the 18-month tracking<br />
period. Spellman, Khadduri, Sokol, and Leopold, op. cit.<br />
Chapter 3: Sheltered Homeless People in 2008 31
permanent housing. Homeless families have smaller household sizes than the poverty population<br />
in general (Exhibit 3-5), resulting from a combination of fewer two-adult households and fewer<br />
households with more than two children. Homeless families may have additional children who<br />
are not with them in a residential program for homeless people because they have been left with<br />
relatives or friends or experienced out-of-home placements by the child welfare system.<br />
Exhibit 3-5: Household Sizes of Sheltered Homeless Families and Poor Families<br />
2008<br />
Household Size<br />
Percentage of Sheltered<br />
Homeless Families<br />
Percentage of Poor Families<br />
2 people 25.1% 7.7%<br />
3 people 29.5% 20.7%<br />
4 people 21.8% 26.6%<br />
5 or more people 23.6% 44.9%<br />
Sources: Homeless Management Information System <strong>data</strong>, 2008<br />
Exhibit 3-6:<br />
Age Distribution of Children in<br />
Sheltered Homeless Families<br />
34%<br />
15%<br />
51%<br />
Sheltered families are young. More<br />
than half (54 percent) of the adults in<br />
families were between age 18 and 30,<br />
representing a considerably larger<br />
number than the 42 percent of adults in<br />
poor families who are that young. 20 The<br />
younger age of parents could help<br />
explain the smaller household sizes of<br />
sheltered homeless families compared to<br />
all poor families.<br />
Percent Under Age 6 Percent Age 6 to 12 Percent Age 13 to 17<br />
Sources: Homeless Management Information System <strong>data</strong>, 2008<br />
Homeless children in emergency<br />
shelters and transitional housing were<br />
also relatively young. More than half<br />
(51 percent) were under age 6, and<br />
another 34 percent were age 6 to 12,<br />
while only 15 percent were age 13 to17<br />
(Exhibit 3-6). 21<br />
20<br />
21<br />
Adults in sheltered families also are younger on average than individual sheltered homeless people. This is<br />
not surprising given that adults in sheltered homeless families are mainly women currently or recently of<br />
childbearing age.<br />
Recall that, for this analysis, the definition of a family is a household with at least one adult (age 18 or older)<br />
and at least one child (age 17 or younger). An under 18-year old homeless teenager with her child and no<br />
adults are counted as two individuals.<br />
32 Chapter 3: Sheltered Homeless People in 2008
3.2 Location of Homeless Service Use, 2008<br />
Geographic Location of Sheltered Homeless Persons<br />
In 2008, sheltered homelessness was concentrated in urban areas (see Exhibit 3-7). More than<br />
two-thirds of all sheltered homeless people were located in principal cities, with 32 percent<br />
located in suburban or rural jurisdictions. Nearly 1 in every 66 persons living in principal<br />
cities in the United States was homeless, compared with about 1 in every 450 persons living in<br />
suburban or rural areas. The geographic distribution of the sheltered homeless population<br />
varied somewhat by household type. Individuals were more likely than persons in families to<br />
be in urban areas. Seventy-one percent of individuals accessed residential services in<br />
principal cities in 2008 compared with 62 percent of persons in families.<br />
Exhibit 3-7 also shows that the share of sheltered homeless persons in principal cities was<br />
almost twice the share of the poverty population in principal cities (68 versus 36 percent) and<br />
almost three times the share of the entire population in principal cities, which was only 24<br />
percent. Thus, while suburbanization has taken hold for most Americans since the 1950s, the<br />
homeless sheltered population is found largely in principal cities.<br />
The concentration of homeless persons in urban areas is related to several issues. Principal cities<br />
have structural factors that may make homelessness more common, including high rates of<br />
unemployment and lack of affordable housing. Also, high demand for services may saturate the<br />
social service system in large cities, which may limit the ability of these systems to adequately<br />
serve persons at risk of becoming homeless. In addition, the concentration of homeless persons in<br />
urban areas may be driven in part by the concentration of homeless residential programs in these<br />
areas. As discussed in chapter 5, the majority of residential homeless service providers (53.6<br />
percent) and nearly two-thirds of all service beds (66.4 percent) are located in principal cities.<br />
Thus, it is possible that homelessness appears to be mostly an urban phenomenon because<br />
homeless people move to areas where services are abundant. However, interpreting the potential<br />
association between the location of homeless people and the location of service providers raises<br />
the proverbial “chicken or the egg” conundrum: do homeless people move to service-rich areas or<br />
are service providers purposively located where the demand for services is greatest? Data from<br />
HMIS cannot disentangle these questions of cause and effect.<br />
Not surprisingly, the characteristics of homeless persons in urban versus suburban/rural areas<br />
varied much like the characteristics of individuals versus persons in families. Compared with<br />
their suburban/rural counterparts, sheltered persons in urban areas were more likely to be male<br />
(66.6 percent versus 58.0 percent) and one-person households (69.7 percent versus 60.4<br />
percent).<br />
Chapter 3: Sheltered Homeless People in 2008 33
Exhibit 3-7: Geographic Distribution of the Sheltered Homeless Population by<br />
Household Type, 2008<br />
100%<br />
90%<br />
80%<br />
32.0% 29.0%<br />
38.3%<br />
70%<br />
60%<br />
64%<br />
76%<br />
50%<br />
40%<br />
30%<br />
68.0% 71.0%<br />
61.7%<br />
20%<br />
10%<br />
36%<br />
24%<br />
0%<br />
Percentage of All<br />
Sheltered Persons<br />
Percentage of All<br />
Sheltered<br />
Individuals<br />
Percentage of All<br />
Sheltered Persons<br />
in Families<br />
U.S. Poverty<br />
Population<br />
Total U.S.<br />
Population<br />
Principal Cities<br />
Suburban and Rural Areas<br />
Sources: Homeless Management Information System <strong>data</strong>, 2008<br />
Movement into the Shelter System<br />
In addition to the type of location where people receive homeless residential services,<br />
communities participating in the AHAR also provided information on where people stayed the<br />
night before they entered the shelter system. In 2008, the night before entering an emergency<br />
shelter or transitional housing facility, about two-fifths of all sheltered persons came from another<br />
homeless situation, two-fifths moved from a<br />
Movement into the Shelter<br />
housed situation (their own or someone else’s<br />
System, 2008<br />
home), and the remaining one-fifth were split<br />
between institutional settings (e.g., a psychiatric<br />
hospital or jail) and hotels, motels, or other<br />
unspecified living arrangements (see Exhibit 3-<br />
Compared to sheltered persons in<br />
families, individuals were:<br />
8). The most common prior living arrangements<br />
were staying with friends or family (28.5<br />
1.5 times more likely to come from<br />
an existing homeless situation<br />
percent) and staying in another homeless 5.7 times more likely to come from<br />
residential service facility (24.3 percent). About an institutional setting<br />
13 percent were on the streets or another place<br />
1.6 times less likely to be housed on<br />
not meant for human habitation the night before<br />
their own or with family or friends<br />
program entry, and a similar proportion came<br />
from a home they rented or owned.<br />
34 Chapter 3: Sheltered Homeless People in 2008
A comparison of living arrangements between sheltered individuals and persons in families<br />
reveals several striking differences. More than 6 in 10 persons in families came from a<br />
housing situation, with most staying with family and friends. Only about one-quarter of<br />
persons in families were already homeless prior to entering the shelter system during the oneyear<br />
reporting period, and very few were in institutional settings. By comparison, fewer than<br />
4 in 10 individuals came from a housing situation, two-fifths were already homeless, and<br />
more than 1 in 10 came from an institutional setting. Thus, for individuals, the most common<br />
pathway into the shelter system during the one-year reporting period was another homeless<br />
location, whereas among persons in families it was from a “housed” situation.<br />
Exhibit 3-8: Previous Living Situation of People Using Homeless Residential<br />
Services, 2008 a<br />
Living Arrangement the Night before<br />
Program Entry<br />
Total<br />
Percentage of<br />
Individual<br />
Adults b<br />
Percentage of<br />
Adults in<br />
Families<br />
Total Already Homeless 37.2% 39.4% 25.9%<br />
Place not meant for human habitation 12.9% 14.7% 4.0%<br />
Emergency shelter or transitional housing 24.3% 24.8% 22.0%<br />
Total from “<strong>Housing</strong>” 41.0% 37.0% 61.5%<br />
Rented or owned housing unit c 12.5% 11.2% 19.2%<br />
Staying with family 16.4% 14.2% 27.8%<br />
Staying with friends 12.1% 11.6% 14.5%<br />
Total from Institutional Settings 11.9% 13.6% 2.4%<br />
Psychiatric facility, substance abuse<br />
center, or hospital 6.7% 7.6% 1.8%<br />
Jail, prison, or juvenile detention 4.8% 5.6% 0.5%<br />
Foster care home 0.4% 0.4% 0.1%<br />
Total from Other Situations 10.1% 10.0% 10.2%<br />
Hotel, motel (no voucher) or “other” 10.1% 10.0% 10.2%<br />
Number of Homeless Adults 1,283,272 1,092,612 203,199<br />
a<br />
The exhibit reports on adults and unaccompanied youth only because the HMIS Data and Technical Standards require<br />
the information to be collected only from these persons. About 21 percent of the records in HMIS were missing this<br />
information in 2008.<br />
b<br />
This category includes unaccompanied adults and youth as well as multiple-adult households without children.<br />
c<br />
Includes a small percentage in permanent supportive housing.<br />
Sources: Homeless Management Information System <strong>data</strong>, 2008<br />
Chapter 3: Sheltered Homeless People in 2008 35
3.3 Patterns of Homeless Service Use, 2008<br />
Emergency Shelters or Transitional <strong>Housing</strong><br />
In 2008, most of the 1,594,000 sheltered homeless people used an emergency shelter only (77<br />
percent or 1,228,224 persons), while a smaller number used only a transitional housing<br />
program only (about 18 percent or 280,877 persons). As shown in Exhibit 3-9, few persons<br />
used both an emergency shelter and transitional housing during the 12-month period (5<br />
percent or 84,693 persons).<br />
These estimates reinforce findings from<br />
previous AHARs that few sheltered homeless<br />
persons follow a linear progression through the<br />
shelter system during the 12-month period—<br />
e.g., from emergency shelters to transitional<br />
housing (and then to permanent housing).<br />
Recent research has similarly concluded that<br />
few homeless persons use the shelter system<br />
sequentially. Most homeless people—both<br />
individuals and families—enter and exit<br />
homeless residential programs just one time,<br />
while others have multiple program “stays” but<br />
usually not in a linear sequence. 22 Indeed,<br />
homelessness is mostly an episodic or shortterm<br />
phenomenon—that is, people cycle<br />
through the homeless system quickly and may<br />
not stay in the system for long periods of time—<br />
and, as a result, many homeless persons do not<br />
use transitional housing. 23 The short-term<br />
Exhibit 3-9: Type of Program Used Among<br />
All Sheltered Homeless People,<br />
2008<br />
Emergency<br />
Shelters Only<br />
77.1%<br />
5.3%<br />
Both Emergency<br />
Shelters and<br />
Transitional <strong>Housing</strong><br />
17.6%<br />
Transitional<br />
<strong>Housing</strong> Only<br />
Source: Homeless Management Information System <strong>data</strong>, 2008<br />
nature of homelessness may be aided by program models (e.g., <strong>Housing</strong> First and Rapid Rehousing)<br />
that attempt to place homeless persons directly into permanent housing from emergency<br />
shelters or the streets, thereby bypassing transitonal housing programs.<br />
The type of residential homeless program used varies somewhat by household type. More than<br />
four-fifths of sheltered homeless individuals (81 percent) used only emergency shelters in<br />
22<br />
23<br />
Spellman, Khadduri, Sokol, and Leopold, Costs Associated with First-Time Homelessness for Families and<br />
Individuals, op. cit.<br />
Culhane, D.P., S. Metraux, J.M. Park, M.A. Schretzmen, and J. Valente. 2007. Testing a Typology of<br />
Family Homelessness Based on Public Shelter Utilization in Four U.S. Jurisdictions: Implications for Policy<br />
and Program Planning. <strong>Housing</strong> Policy Debate, 18(1): 1-28. Kuhn, R., and D.P. Culhane. 1998. Applying<br />
Cluster Analysis to Test of a Typology of Homelessness: Results from the Analysis of Adminstrative Data.<br />
American Journal of Commnity Psychology, 17(1): 23-43.<br />
36 Chapter 3: Sheltered Homeless People in 2008
2008, compared with 69 percent of persons in families. Part of the explanation may be the<br />
relative supply of different types of residential homeless programs for individuals versus<br />
families, a topic discussed in chapter 5.<br />
Length of Stay in Emergency Shelters and Transitional <strong>Housing</strong><br />
Most people who enter a homeless residential facility leave quickly, but the amount of time spent<br />
varies considerably by program and by household type (see Exhibit 3-10). Three-fifths of those<br />
using emergency shelters stayed less than a month in total, and a third stayed only a week.<br />
Individuals in emergency shelters stayed the shortest amount of time: 65 percent stayed less than a<br />
week, and only 5 percent stayed for 6 months or more. The median length of stay for individuals<br />
in emergency shelters was 18 days. By comparison, families in emergency shelters stayed longer:<br />
50 percent of persons in families spent a week or less; 10 percent stayed for 6 months or more;<br />
and the median length of stay was 30 days.<br />
Exhibit 3-10:Number of Nights in Shelter by Program and Household Type, 2008<br />
Emergency Shelters<br />
Length of Stay a Total Individuals<br />
Percentage of People<br />
Transitional <strong>Housing</strong><br />
Persons in<br />
Families Total Individual<br />
Persons in<br />
Families<br />
1 week or less 33.3% 37.4% 23.5% 5.7% 6.2% 5.1%<br />
1 week to < 1 month 27.5% 27.8% 26.7% 12.6% 14.3% 10.3%<br />
1 month to < 6 months 32.8% 29.8% 40.3% 42.0% 44.6% 38.6%<br />
6 months to < 1 year 4.7% 3.9% 6.7% 21.7% 18.5% 25.9%<br />
Entire year 1.6% 1.1% 2.8% 18.0% 16.4% 20.1%<br />
Average (Median) Time<br />
# of nights 21 18 30 130 107 161<br />
a<br />
The length of stay reported in this exhibit accounts for the total number of nights in shelters during the 12-month<br />
reporting period. Some people may have lengths of stay longer than a year if they entered a residential program prior<br />
to the start of the <strong>data</strong> collection period or remained in the program after the end of the <strong>data</strong> collection period.<br />
Source: Homeless Management Information System <strong>data</strong>, 2008<br />
Families stay in shelter for longer periods of time for several reasons. Unsheltered homelessness<br />
can be particularly dangerous for families with children, and thus families are more likely to stay in<br />
shelters until other housing accommodations are available. Also, families may have a more difficult<br />
time finding housing—on their own or with family or friends—because they need additional space.<br />
More than a fifth of persons in families were in households with 5 or more family members (see<br />
Exhibits 3-3 and 3-5), and the availability of appropriately-sized, affordable housing for these<br />
families may be especially limited.<br />
Chapter 3: Sheltered Homeless People in 2008 37
People in transitional housing programs generally stay for much longer periods of time. About 40<br />
percent of all persons stayed in transitional housing for 6 months or more in 2008, with many<br />
staying for the full 12-month reporting period. Here again, persons in families stayed longer than<br />
individuals. The median number of days among persons in families was 161 compared to 107 for<br />
individuals.<br />
The longer lengths of stays in transitional housing are expected because these programs are<br />
designed differently. Transitional housing is designed to serve clients for up to two years<br />
while helping them transition to permanent housing, whereas emergency shelters are designed<br />
to help people avoid unsheltered homelessness and, sometimes, to enter a longer-term<br />
program to help them overcome their housing crisis.<br />
“Heavy Users” of Emergency Shelters<br />
To help understand the characteristics of “heavy users” of the homeless services system,<br />
communities participating in the 2008 AHAR reported the number and characteristics of<br />
people who stayed in emergency shelters for six months or longer during the one-year period.<br />
These heavy users represent only 7 percent of all persons who used emergency shelters in<br />
2008. As shown in Exhibit 3-11, the characteristics of these heavy users are substantially<br />
different from those of the overall population of shelter users during this period.<br />
Exhibit 3-11: Demographic Characteristics Associated with Staying in Emergency<br />
Shelters More than Six Months, 2008<br />
Race<br />
All Persons in Emergency<br />
Shelters in 2008<br />
Long-Term Stayers in<br />
Emergency Shelters in 2008<br />
Hispanic/Latino Ethnicity 20.9% 28.7%<br />
Black or African American 42.3% 56.6%<br />
Children under Age 18 18.4% 26.4%<br />
Household with 5 or more People 7.1% 13.5%<br />
Number of People 1,312,917 81,016<br />
Source: Homeless Management Information System <strong>data</strong>, 2008<br />
The comparison indicates that minorities—specifically Hispanics and African Americans—and<br />
large families are disproportionately represented in the heavy-users group. Both Hispanics and<br />
African Americans are disproportionately represented in the overall homeless population, so it<br />
may be that the same factors that lead to greater risk for homelessness for these groups also lead<br />
to longer stays. White, non-Hispanic families also may go to emergency shelters in<br />
communities that have more resources for outplacements from emergency shelter into<br />
transitional or permanent housing relative to need.<br />
38 Chapter 3: Sheltered Homeless People in 2008
3.4 Summary of All Sheltered Homeless People in 2008<br />
In summary, the estimates of the sheltered homeless population in 2008 indicate that:<br />
<br />
<br />
<br />
<br />
<br />
<br />
<br />
Nearly 1 in every 66 persons living in principal cities in the United States is homeless,<br />
compared to about 1 in every 450 persons living in suburban or rural areas.<br />
African Americans are disproportionately represented in the homeless population<br />
relative to the overall U.S. population and the poverty population. They comprise 41.7<br />
percent of the homeless population, 3.5 times their 12.4 percent share of the U.S.<br />
population and 1.8 times their 23.1 percent share of the poverty population.<br />
Other demographic groups overrepresented in the homeless population relative to the<br />
overall U.S. population are adult males, people age 31 to 50, single-person households,<br />
and people with a disability.<br />
Homeless sheltered individuals most often are male, members of a minority group,<br />
between the ages of 31 and 50, disabled, and experiencing homelessness alone. By<br />
contrast, family households in the shelter system are very likely to be headed by a<br />
minority woman without a male partner, under age 30, and in a household with 2 or 3<br />
members.<br />
More than two-thirds of all sheltered homeless people were located in principal cities, with<br />
32 percent located in suburban or rural jurisdictions. Individuals are more likely to be in<br />
urban areas than persons in families. Seventy-one percent of individuals are accessing<br />
residential services in principal cities compared to 62 percent of persons in families.<br />
The night before entering an emergency shelter or transitional housing facility, about<br />
two-fifths of the people came from another homeless situation (sheltered or<br />
unsheltered), two-fifths were moving from a housed situation (their own or someone<br />
else’s home), and the remaining one-fifth were split between institutional settings and<br />
a variety of other living situations.<br />
Most people have relatively short lengths of stay in emergency shelters: three-fifths<br />
stay less than a month and one-third stay a week or less. Stays in transitional housing<br />
are longer: about 40 percent stayed 6 months or more in 2008. Nearly 1 in 5 people in<br />
transitional housing were there for the entire year for which HMIS <strong>data</strong> were analyzed.<br />
Chapter 3: Sheltered Homeless People in 2008 39
Chapter 4<br />
Trends in Sheltered Homelessness between 2007<br />
and 2008<br />
This chapter describes changes between 2007 and 2008 in the numbers and characteristics of<br />
people who were in an emergency shelter or transitional housing program at any time during<br />
a one-year period. The chapter is based on <strong>data</strong> from local Homeless Management<br />
Information Systems that were submitted by communities nationwide and statistically<br />
adjusted to represent the entire nation.<br />
The chapter breaks new ground by being the first AHAR to describe year-to-year changes in<br />
people who are sheltered homeless at some time during the year. 24 The exact time periods<br />
covered by the HMIS <strong>data</strong> used in this chapter are October 1, 2006-September 30, 2007 and<br />
October 1, 2007-September 30, 2008. For simplicity, we refer to these periods as 2007 and<br />
2008. 25 The year-to-year comparisons suggest how patterns of homelessness may be<br />
changing over time. 26<br />
The chapter focuses on three types of changes:<br />
<br />
Changes in the sheltered homeless population between 2007 and 2008, including<br />
changes in household type, geographic location, and demographic characteristics.<br />
24<br />
25<br />
26<br />
Chapter 2 of this report describes trends in people found to be either sheltered or unsheltered homeless on a<br />
particular night in January based on Point-in-Time counts conducted by communities and reported to HUD<br />
in CoC applications. In that case, we describe a three-year trend, 2006-2008, but with much less detail on<br />
characteristics of homeless people and their use of the homeless services system.<br />
The second period ended just before the current economic downturn became severe and widespread, although<br />
the recession began in December 2007. According to the Department of Labor’s Bureau of Labor Statistics,<br />
the seasonally adjusted unemployment rate increased 4.8 percent to 5.5 percent between February and May<br />
2008 and to 6.2 percent in September 2008. By December 2008 (after the study period for this report), it had<br />
increased to 7.2 percent. In December 2008 the National Bureau of Economic Research declared that the<br />
current recession began in December 2007, saying: “…a peak in economic activity occurred in the U.S.<br />
economy in December 2007. The peak marks the end of the expansion that began in November 2001 and<br />
the beginning of a recession.” See http://www.nber.org/cycles/dec2008.html and<br />
http://www.usatoday.com/money/economy/2008-12-01-recession-nber-statement_N.htm, accessed April<br />
27, 2009.<br />
The estimates are offered with an important caveat. As discussed earlier, the precision of the HMIS-based<br />
AHAR estimates has improved considerably compared to previous reports, but some communities still are<br />
unable to provide complete <strong>data</strong>. Thus, the HMIS-based estimates have wide confidence intervals (see<br />
Exhibit 4-1).<br />
Chapter 4: Trends in Sheltered Homelessness between 2007 and 2008 41
Changes in the patterns of becoming homeless, based on the HMIS questions that<br />
ask where people were the night before they became homeless and how long they had<br />
been there.<br />
Changes in how people use the homeless services system and, specifically, whether<br />
they use emergency shelter or transitional housing and how long they stay in<br />
residential programs for homeless persons during a 12-month period.<br />
4.1 Changes in the Sheltered Homeless Population between 2007<br />
and 2008<br />
In 2008 about 1,594,000 persons used an emergency shelter, a transitional housing program,<br />
or both. This was a slight increase over the total number of sheltered homeless people<br />
measured for 2007, as shown in Exhibit 4-1. The total number of sheltered homeless persons<br />
increased by about 5,200 people, only three-tenths of a percent. However, the composition<br />
of the sheltered homeless population shifted appreciably.<br />
Exhibit 4-1: Changes in Total Sheltered Homeless Individuals and Persons in<br />
Families, 2007-2008<br />
Total Number<br />
2007 2008<br />
% of<br />
Sheltered<br />
Homeless<br />
Population<br />
Total Number<br />
% of<br />
Sheltered<br />
Homeless<br />
Population<br />
Change<br />
2007-<br />
2008<br />
Household Type<br />
Total Number of<br />
Sheltered Persons a 1,588,595 c 100% 1,593,794 c 100% +5199<br />
a<br />
b<br />
c<br />
d<br />
Individuals b 1,115,054 d 70.2% 1,092,612 d 68.6% -22,422<br />
Persons in Families 473,541 d 29.8% 516,724 d 32.4% +43,183<br />
Number of Sheltered<br />
Households with<br />
Children<br />
130,968 — 159,142 — +28,174<br />
These estimated totals reflect the number of homeless persons in the 50 states and the District of Columbia who used<br />
emergency shelters or transitional housing programs during the one-year period of October 1 through September 30 of the<br />
following year. The estimates do not cover the U.S. Territories and Puerto Rico and do not include persons served by<br />
“victim service providers.” The estimated totals include an extrapolation adjustment to account for people who use<br />
emergency shelters and transitional housing programs but whose jurisdictions do not yet participate in their HMIS. People<br />
who are homeless but do not use an emergency shelter or transitional housing program during the 12-month period are not<br />
included. Percentages may not sum to 100 percent due to rounding.<br />
This category includes unaccompanied adults, unaccompanied people under 18 years, and multi-adult households<br />
without children.<br />
In 2007, the 95 percent confidence interval for the estimated number of sheltered homeless persons in the population<br />
was 1,043,775 to 2,133,415 persons (or +/- 544,820 persons). In 2008, the 95 percent confidence interval is 1,180,758<br />
to 2,006,830 (or +/- 413,036 persons).<br />
In both 2007 and 2008, approximately 1 percent of homeless persons were served both as an individual and as a person<br />
in a family. In this exhibit, such people appear in both categories in 2008, so the total number of sheltered persons is<br />
slightly less than the sum of individuals and families. The percentages use the sum of all individuals and persons in<br />
families as the denominator, rather than the unduplicated number of sheltered persons.<br />
Source: Homeless Management Information System <strong>data</strong>, 2007-2008<br />
42 Chapter 4: Trends in Sheltered Homelessness between 2007 and 2008
As noted in chapter 2, homelessness among individuals remained relatively unchanged, but<br />
the rise in family homelessness was considerable with an increase of about 43,000 persons in<br />
families, or 9 percent, from 2007. The share of people who are sheltered as family members<br />
increased from 29.8 percent to 32.4 percent (Exhibit 4.1). Described as households rather<br />
than as separate people, the share of family households among all sheltered households<br />
increased from 11.7 percent in 2007 to 14.4 percent in 2008. 27<br />
Changing Geography of Homelessness<br />
The types of locations in which people used residential homeless programs also shifted markedly<br />
between 2007 and 2008. Overall, sheltered homelessness is concentrated in urban areas. As<br />
noted in chapter 3, during 2008, 68 percent of sheltered homeless people were located in<br />
principal cities. However, between 2007 and 2008, the sheltered homeless population grew<br />
substantially in suburban and rural areas and fell in principal cities. As seen in Exhibit 4-2, the<br />
share of the sheltered homeless population in suburban and rural areas grew from 23 percent in<br />
2007 to 32 percent in 2008, while the share in principal cities fell from 77 to 68 percent. Because<br />
many rural areas were unable to submit useable HMIS <strong>data</strong> to the AHAR, the <strong>data</strong> for 2007 and<br />
2008 do not support separate estimates for suburbs and rural areas, although we know from the<br />
PIT estimates presented in chapter 2 that several predominantly rural states experienced sizable<br />
increases in their single-night counts of homeless people from 2007 to 2008. HUD is currently<br />
targeting HMIS technical assistance to rural areas, and the expectation is that future AHARs will<br />
be able to report separate estimates for suburban and rural areas.<br />
The higher share of homeless people in suburban and rural areas is related in part to the<br />
increase in sheltered family homelessness. The percentage of persons in families in suburban<br />
and rural areas increased considerably from 26.9 percent in 2007 to 38.3 percent in 2008, as<br />
shown in Exhibit 4-3. However, the share of sheltered homeless individuals also increased in<br />
suburban and rural areas between 2007 and 2008, by almost 8 percentage points. The<br />
number of sheltered individuals and family members in principal cities decreased.<br />
27<br />
As described in chapter 2, there were 1,092,612 homeless individuals, nearly all of whom were individual<br />
adult males, individual adult females, or unaccompanied youth. There were also 20,488 adults in multiadult<br />
households. Assuming 2 adults per multi-adult household and each individual as a household, the<br />
percent of households that were families is 14.4 percent (or 159,142 divided by 1,102,856).<br />
Chapter 4: Trends in Sheltered Homelessness between 2007 and 2008 43
Exhibit 4-2: Change in the Geographic Location of the Sheltered Homeless<br />
Population, 2007 and 2008<br />
All Sheltered<br />
Homeless Persons in<br />
2007<br />
All Sheltered<br />
Homeless Persons in<br />
2008<br />
Geographic<br />
Location Number Percent Number Percent<br />
Change from 2007 to<br />
2008 in Percentage<br />
Points<br />
Principal Cities 1,221,044 76.9% 1,084,335 68.0% -4.9<br />
Suburban or<br />
Rural Areas<br />
367,551 23.1% 509,459 32.0% +8.9<br />
Source: Homeless Management Information System <strong>data</strong>, 2007-2008<br />
Exhibit 4-3: Change in the Geographic Location of the Sheltered Homeless<br />
Individuals And Families, 2007 and 2008<br />
Household Type<br />
All Sheltered<br />
Homeless Persons in<br />
2007<br />
Percent<br />
in<br />
Principal<br />
Cities<br />
Percent in<br />
Suburban<br />
or Rural<br />
Areas<br />
All Sheltered<br />
Homeless Persons in<br />
2008<br />
Percent<br />
in<br />
Principal<br />
Cities<br />
Percent in<br />
Suburban<br />
or Rural<br />
Areas<br />
Change from 2007 to<br />
2008 in Percentage<br />
Points<br />
Percent in<br />
Principal<br />
Cities<br />
Percent in<br />
Suburban<br />
or Rural<br />
Individuals 78.7% 21.3% 71.0% 29.0% -7.7 7.7<br />
Areas<br />
Persons in Families 73.1% 26.9% 61.7% 38.3% -11.4 11.4<br />
Source: Homeless Management Information System <strong>data</strong>, 2007-2008<br />
We investigated whether increased capacity among emergency shelters and transitional<br />
housing programs in suburban and rural areas could explain the higher numbers of sheltered<br />
homeless people in that type of location, but found that the capacity did not change much<br />
between 2007 and 2008. Instead, it appears that the existing capacity was more intensively<br />
used in suburban and rural areas in 2008 than 2007. (See chapter 5 for a detailed discussion<br />
of shelter capacity and utilization rates.)<br />
Changing Demographic Characteristics of Homeless Individuals and Families<br />
Across all sheltered homeless people, demographic characteristics changed little between 2007<br />
and 2008, as shown in Exhibit 4-4. The largest changes are a 3.6 percentage-point decrease in<br />
single-person households and a 5.7 percentage-point increase in the share of adults with<br />
disabilities. The decrease in single person households results from the decrease in individual<br />
shelter users relative to persons in families. Or put differently, as the share of persons in<br />
families increases, the share of multi-person households must necessarily increase as well.<br />
44 Chapter 4: Trends in Sheltered Homelessness between 2007 and 2008
Exhibit 4-4<br />
Change in the Demographic Characteristics of Sheltered Homeless<br />
Persons, 2007-2008<br />
Percentage of All Sheltered Homeless Population<br />
Percentage Point<br />
Characteristic 2007 2008<br />
Change<br />
Race/Ethnicity<br />
White a 49.3% 49.5% +0.2<br />
Black or African American 39.6% 41.7% +2.2<br />
Other Single Race 3.9% 3.5% -0.4<br />
Multiple Races 7.3% 5.4% -1.9<br />
Hispanic/Latino Ethnicity 21.6% 19.5% -2.1<br />
Male (adults) b 65.2% 64.0% -1.2<br />
Age b<br />
Under age 18 21.6% 20.8% -0.8<br />
18 to 30 20.5% 22.2% +1.7<br />
31 to 50 41.2% 40.3% -0.8<br />
51to 61 13.6% 14.0% +0.4<br />
62 and older 2.9% 2.8% -0.2<br />
Persons by Households Size c<br />
1 person 70.3% 66.7% -3.6<br />
2 people 8.0% 9.3% +1.3<br />
3 people 8.2% 9.5% +1.3<br />
4 people 6.5% 7.0% +0.5<br />
5 or more people 6.9% 7.5% +0.6<br />
Veteran (adults) d 13.2% 11.6% -1.6<br />
Disabled (adults) d 37.1% 42.8% +5.7<br />
a<br />
b<br />
c<br />
d<br />
Approximately one-quarter of people identifying their race as white also identified their ethnicity as Hispanic/Latino.<br />
We do not have <strong>data</strong> on how many people of other races also identified themselves as Hispanic/Latino.<br />
Age is calculated based on a person’s first time in shelter during the covered time period. A child is defined as a<br />
person age 17 or under, and an adult is defined as a person age 18 or older.<br />
If a person is part of more than one household over the study period, the household size reflects the size of the first<br />
household in which the person presented during the covered time period. If household size changed during the<br />
program episode (i.e., a household member left the program early or joined later), household size for each person<br />
reflects household size on the day that person entered the program.<br />
Veteran status and whether a person had a disabling condition are recorded only for adults in HMIS. The percentage<br />
calculations shown indicate the percent of homeless adults with this characteristic. A substantial number of records<br />
were missing information on disability status (32.4 percent in 2007 and 22.0 percent in 2008) and veteran status (15.9<br />
percent in 2007 and 7.5 percent in 2008). The percentage calculations include only persons whose disability and<br />
veteran status was recorded.<br />
Source: Homeless Management Information System <strong>data</strong>, 2007- 2008<br />
Chapter 4: Trends in Sheltered Homelessness between 2007 and 2008 45
The increase in the share of persons with disabilities is unusually large for a single-year<br />
change and may reflect a pattern of increasing need particularly among individuals who<br />
become homeless. However, the estimated change may not reflect simply an actual change<br />
in the characteristics of the homeless population, but may also reflect the difficulty of<br />
collecting this information reliably. This variable has consistently had a high missing rate in<br />
HMIS <strong>data</strong>, although it has vastly improved. Disability status was missing for 32 percent of<br />
adults in 2007, but only for 22 percent in 2008. It may be that adults with missing<br />
information on disability status are more likely to be disabled than adults who had the<br />
information reported, and thus as missing information becomes known, the proportion of<br />
persons with a disability increases. On the whole, the lower missing rate in 2008 gives us a<br />
higher degree of confidence in the 2008 estimates, which suggests that approximately 4 out<br />
of every 10 homeless adults for whom we have information had a disability.<br />
Some other changes in the portrait of homelessness emerge when we look separately at<br />
homeless individuals and homeless persons in families and also distinguish between white<br />
people who describe their ethnicity as Hispanic or Latino and those who do not. For both<br />
household types, the percentages who are not minorities—that is white and not Hispanic—<br />
increased between 2007 and 2008, by 4 percentage points for individuals and 3.1 percentage<br />
points for families, as shown in Exhibit 4-5. White Hispanics dropped among the individual<br />
homeless population, but increased among the family population. The opposite pattern held<br />
for people describing themselves as black or African American, with an increase among<br />
individuals and a decrease among persons in families as a percentage of all sheltered<br />
homeless people. The total number of African American persons in families increased<br />
slightly, but this increase was outstripped by larger increases in numbers of white sheltered<br />
homeless families, both Hispanic and non-Hispanic.<br />
Exhibit 4-5 Change in Race and Ethnicity of Sheltered Homeless Individuals and<br />
Families, 2007 to 2008 a<br />
Sheltered Individuals<br />
Race<br />
% of Individuals % of Individuals Change in Percentage<br />
2007<br />
2008<br />
Points<br />
White, non–Hispanic/Latino 42.6% 44.6% +4.0<br />
White Hispanic, Latino 14.1% 11.0% -3.1<br />
Black or African American 33.2% 37.0% +3.8<br />
Other Racial Groups b 10.1% 7.5% -2.7<br />
Sheltered Persons in Families<br />
Race<br />
a<br />
% of Persons in<br />
Families 2007<br />
% of Persons in<br />
Families 2008<br />
Change in Percentage<br />
Points<br />
White, non–Hispanic/Latino 21.3% 24.4% +3.1<br />
White Hispanic, Latino 9.8% 13.1% +3.3<br />
Black or African American 55.2% 50.9% -4.3<br />
Other Racial Groups b 13.6% 11.6% -2.0<br />
b<br />
Percentages may not sum to 100 percent due to rounding.<br />
Includes persons who identify as multiple races.<br />
Source: Homeless Management Information System <strong>data</strong>, 2007- 2008<br />
46 Chapter 4: Trends in Sheltered Homelessness between 2007 and 2008
The increase in white, non-Hispanic people for both populations, families and individuals,<br />
may be related to the geographic shift towards suburban and rural areas. The trends among<br />
white Hispanics and blacks are more difficult to interpret. Race and ethnicity was another<br />
area in which reporting improved between 2007 and 2008. For example, the percentage of<br />
records missing information on race dropped from 11.6 in 2007 to 7.66 in 2008. Increasing<br />
family homelessness among whites, both Hispanic and non-Hispanic, may be related to the<br />
economic downturn.<br />
Exhibit 4-6 shows some slight changes in the household characteristics of homeless families<br />
between 2007 and 2008. Adults who become homeless together with children are usually—<br />
but not always—women. In 2008, 19 percent of adults in homeless families with children<br />
were men, about one percentage point more than in 2007. The proportion of family members<br />
who were adults also appeared to grow slightly between the two years, reflecting a slight<br />
decrease in the number of children rather than an increase in the number of multi-adult<br />
households. In 2007, the average number of adults per household was 1.37, while in 2008<br />
the average was 1.28.<br />
Exhibit 4-6: Changes in the Household Characteristics of Sheltered Homeless<br />
Families, 2007-2008 a<br />
Characteristic<br />
Adults and Children<br />
Percentage of Sheltered<br />
Homeless Persons in<br />
Families 2007<br />
Percentage of Sheltered<br />
Homeless Persons in<br />
Families 2008<br />
Change in Percentage<br />
Points<br />
Adults 38.4% 39.7% +1.2<br />
Children 61.6% 60.3% -1.3<br />
Gender of adults<br />
Women 82.0% 80.9% -1.1<br />
Men 18.0% 19.2% +1.1<br />
a<br />
Percentages may not sum to 100 percent due to rounding.<br />
Source: Homeless Management Information System <strong>data</strong>, 2007-2008<br />
4.2 Changing Patterns of Becoming Homeless, 2007-2008<br />
The patterns for prior living arrangement are another area in which the HMIS <strong>data</strong> show<br />
some notable changes from 2007 to 2008, both for all sheltered homeless people and for<br />
individuals and families considered separately. Among all homeless people, the share who<br />
reported that they were already homeless at the time they entered a shelter or a transitional<br />
housing program dropped, while the share who reported that they came from some type of<br />
housing—their own or staying with family or friends—rose. In 2007, 42 percent reported<br />
that they were either on the street or in a different emergency shelter or transitional housing<br />
Chapter 4: Trends in Sheltered Homelessness between 2007 and 2008 47
facility the night before. In 2008, this number dropped to 37 percent. Also, the percentage<br />
that had been staying with family or friends increased from 26 percent in 2007 to 29 percent<br />
in 2008. People who lost their housing because they could no longer pay for it or because a<br />
rental unit was foreclosed may have first stayed with friends or family but then turned to the<br />
homeless services system after wearing out their welcome or tiring of the situation. These<br />
changes may be early signs of the impact of the economic downturn on homelessness.<br />
Exhibit 4-7 shows these patterns for individuals. When asked about their living arrangement<br />
just before they entered a shelter or a transitional housing program, about the same<br />
percentage of homeless individuals—slightly less than 15 percent—said that they were in a<br />
“place not meant for human habitation,” but somewhat smaller percentages in 2008 than in<br />
2007 said that they had been either in emergency shelter or transitional housing.<br />
Accordingly, the percentage already homeless at the time they entered a residential program<br />
for homeless people dropped from 43.3 to 39.5 percent.<br />
Exhibit 4-7: Change in Previous Living Situation of Individuals Using Homeless<br />
Residential Services, 2007-2008<br />
Living Arrangement the Night<br />
before Program Entry<br />
Percentage<br />
Distribution<br />
2007<br />
Change in<br />
Percentage<br />
2008 a Points<br />
Distribution Percentage<br />
Total Already Homeless 43.3% 39.5% -3.8<br />
Place not meant for human<br />
habitation<br />
14.8% 14.7% -0.1<br />
Emergency shelter 25.2% 22.0% -3.2<br />
Transitional housing 3.2% 2.7% -0.5<br />
Total from Some Type of <strong>Housing</strong> 36.5% 37.0% 0.5<br />
Rented housing unit b 10.3% 9.2% -1.1<br />
Owned housing unit 1.9% 2.0% 0.1<br />
Staying with family 15.2% 14.2% -1.0<br />
Staying with friends 9.1% 11.6% 2.5<br />
Total from Institutional Settings 12.1% 13.6% 1.5<br />
Psychiatric facility, substance abuse<br />
center, or hospital<br />
6.6% 7.6% 1.0<br />
Jail, prison, or juvenile detention 5.0% 5.6% 0.6<br />
Foster care home 0.5% 0.4% -0.1<br />
Total from Other Situations 8.2% 9.9% 1.7<br />
Hotel, Motel (no voucher) or “other” 8.2% 9.9% 1.7<br />
Number of Homeless Adults 1,115,054 1,092,612 --<br />
a<br />
b<br />
The percentage of HMIS records missing this information dropped from 32 percent in 2007 to 21 percent in 2008.<br />
Includes a small percentage in permanent supportive housing.<br />
Source: Homeless Management Information System <strong>data</strong>, 2007-2008<br />
48 Chapter 4: Trends in Sheltered Homelessness between 2007 and 2008
About the same percentages—roughly 37 percent—said they had been in a housing unit<br />
(their own or someone else’s) before entering a shelter. However, as shown in Exhibit 4-7,<br />
the number of individuals staying with friends before entering a shelter increased by 2.5<br />
percentage points. An increasing pattern of people coming to shelter after staying temporarily<br />
with friends may indicate that more individuals are finding themselves unstably housed and<br />
becoming homeless after exhausting short-term alternatives.<br />
Also, an indication that the economic downturn may have started to affect patterns of<br />
homelessness among individuals is the stability of the previous night’s living arrangement.<br />
A larger percentage of individuals entering residential programs for homeless people in 2008<br />
compared to 2007 had been in the place they spent the previous night for more than a year:<br />
27 percent in 2008 compared with 24 percent in 2007. Thus, in addition to fewer people<br />
coming from situations in which they already were homeless, more came from situations that<br />
previously had been relatively stable.<br />
Somewhat higher percentages of individual sheltered homeless people in 2008 than in 2007<br />
said that they had been in institutional settings such as jails or residential treatment facilities<br />
or in “other” living arrangements. This pattern also may suggest that residential programs<br />
for homeless individuals on average are serving an increasingly needy population.<br />
Exhibit 4-8 shows changes between 2007 and 2008 in the living situations of homeless<br />
people in families prior to entering emergency shelters or transitional housing. The patterns<br />
shown in these <strong>data</strong> reveal more clearly the effect of homeless families of the worsening<br />
economic situation. Previous research has shown that family homelessness is more sensitive<br />
than individual homelessness to business cycles, 28 which also may help explain why family<br />
homelessness increased in 2008 although individual homelessness did not. As shown in<br />
Exhibit 4-8, a smaller share of families were already homeless, either in a “place not meant<br />
for human habitation” or in a different shelter or transitional housing program: 25.9 percent<br />
in 2008, compared with 30.3 percent in 2007. The share of families coming from a “housed”<br />
situation rose to 61.5 percent, a 7.1 percentage-point increase between 2007 and 2008.<br />
While the percentage coming from a housing unit the family owned dropped somewhat and<br />
remained small, a much larger share came from a rented housing unit. This may reflect the<br />
initial effects of the foreclosure crisis on renters. In addition, larger shares than in 2007 said<br />
that they had been staying with family or with friends before becoming sheltered homeless.<br />
As was the case for individuals, an increasing percentage of adults in families—in this case a<br />
5 percentage point increase from 18.1 percent to 23.1 percent, said that they had been in the<br />
place they stayed the previous night a year or longer.<br />
28<br />
Culhane, Dennis P, Stephen R. Poulin, Lorlene M. Hoyt, and Stephen Metraux. 2003. The Impact of<br />
Welfare Reform on Public Shelter Utilization in Philadelphia: A Time-Series Analysis. Cityscape (6)2:<br />
173-185.<br />
Chapter 4: Trends in Sheltered Homelessness between 2007 and 2008 49
Exhibit 4-8: Change in Previous Living Situation of Adults in Families Using<br />
Homeless Residential Services, 2007-2008<br />
Living Arrangement the Night before<br />
Program Entry<br />
Percentage of<br />
Adults in<br />
Families 2007<br />
Percentage of<br />
Adults in<br />
Families 2008<br />
Change in<br />
Percentage<br />
Points<br />
Total Already Homeless 30.3% 25.9% -4.4<br />
Place not meant for human habitation 3.6% 4.0% 0.4<br />
Emergency shelter 23.3% 19.8% -3.5<br />
Transitional housing 3.4% 2.2% -1.2<br />
Total from Some Type of <strong>Housing</strong> 54.4% 61.5% 7.1<br />
Rented housing unit a 13.0% 16.8% 3.8<br />
Owned housing unit 3.8% 2.4% -1.4<br />
Staying with family 24.2% 27.8% 3.6<br />
Staying with friends 13.4% 14.5% 1.1<br />
Total from Institutional Settings 2.3% 2.4% 0.1<br />
Psychiatric facility, substance abuse<br />
center, or hospital<br />
1.9% 1.8% -0.1<br />
Jail, prison, or juvenile detention 0.4% 0.5% 0.1<br />
Foster care home 0.0% 0.1% 0.1<br />
Total from Other Situations 13.0% 10.0% -3.0<br />
Hotel, motel (no voucher) or “other” 13.0% 10.0% -3.0<br />
Total Homeless Adults in Families 179,401 203,199 --<br />
a<br />
Includes a small percentage in permanent supportive housing.<br />
Source: Homeless Management Information System <strong>data</strong>, 2007-2008<br />
4.3 Changing Use of the Residential System for Homeless<br />
People, 2007-2008<br />
Despite more frequently entering shelters or transitional housing from “housed” situations,<br />
people did not leave homeless residential programs more rapidly in 2008 compared to 2007.<br />
On the contrary, they had longer “stays” or total lengths of time spent in homeless programs<br />
during the 12-month period. As Exhibit 4-9 shows, the median length of stay increased by 4<br />
nights for individuals in emergency shelter, by 16 nights for individuals in transitional<br />
housing, and by 10 nights for families in transitional housing.<br />
50 Chapter 4: Trends in Sheltered Homelessness between 2007 and 2008
Exhibit 4-9: Change in Median Length of Stay, by Shelter and Household Type,<br />
2007-2008<br />
Household Type<br />
Emergency Shelters<br />
All Sheltered Homeless<br />
Persons in 2007<br />
Median Nights in Shelter<br />
All Sheltered Homeless<br />
Person in 2008<br />
Change in Median<br />
Nights in Shelter<br />
from 2007 to 2008<br />
Individuals 14 nights 18 nights + 4 nights<br />
Persons in Families 30 nights 30 nights No change<br />
Transitional <strong>Housing</strong><br />
Individuals 91 nights 107 nights + 16 nights<br />
Persons in Families 151 nights 161 nights + 10 nights<br />
Source: Homeless Management Information System <strong>data</strong>, 2007-2008<br />
Changes in Lengths of Stay in Emergency Shelter, 2007-2008<br />
Exhibit 4-10 shows the pattern of lengths of stay for individuals in emergency shelter in more<br />
detail. Fewer individuals were in shelter a week or less in 2008 than in 2007 (37 versus 42<br />
percent), and more had stays between one and six months. The inset in Exhibit 4-10 provides<br />
additional details on individuals who stayed in shelter for 6 months or more. The inset shows<br />
that, within this group of individuals, a larger fraction (although still just slightly more than 1<br />
percent) stayed in emergency shelter for the entire year for which AHAR <strong>data</strong> were<br />
collected. 29<br />
Longer stays for individuals in emergency shelter in 2008—in particular the decrease in<br />
those staying a week or less compared with 2007—could reflect the same phenomenon<br />
suggested by the increase in those coming out of jail, prison, or inpatient treatment facilities.<br />
It appears that fewer individuals entering emergency shelters are experiencing a very short<br />
and easily resolved housing crisis, and more need a few weeks to find an alternative<br />
arrangement.<br />
29<br />
Length of stay in a homeless residential facility is limited to the 12-month reporting period (October 1,<br />
2007 through September 30, 2008). The length of stay among persons who entered a facility before the<br />
start of the reporting period or who did not leave by the end of the reporting period was restricted to the<br />
time spent in the facility during the 12-month period. Thus, the maximum length of stay is 366 nights<br />
(2008 was a leap year).<br />
Chapter 4: Trends in Sheltered Homelessness between 2007 and 2008 51
Exhibit 4-10: Lengths of Stay in Emergency Shelter for Individuals<br />
in 2008 Compared with 2007<br />
Percentage of Individuals of 45.0%<br />
40.0%<br />
35.0%<br />
30.0%<br />
25.0%<br />
20.0%<br />
15.0%<br />
10.0%<br />
5.0%<br />
Percentage of Individuals<br />
1.2%<br />
1.0%<br />
0.8%<br />
0.6%<br />
0.4%<br />
0.2%<br />
0.0%<br />
6 to 7 months<br />
7 to 8 months<br />
8 to 9 months<br />
9 to 10 months<br />
10 to 11 months<br />
11 months to 1 year<br />
1 year<br />
0.0%<br />
1 week or less 1 week to 1<br />
month<br />
1-3 months 3-6 months 6-9 months 9 months to 1<br />
year<br />
Length of Stay Category<br />
2008 2007<br />
Source: Homeless Management Information System <strong>data</strong>, 2007-2008<br />
a<br />
b<br />
Exhibit 4-11: Individuals Who Stayed in Emergency Shelter More Than 180 Days,<br />
2007 and 2008<br />
Characteristics<br />
Percentage of<br />
Long-Stayers<br />
2007<br />
Percentage of<br />
Long-Stayers<br />
2008<br />
Change in<br />
Percentage Points<br />
Gender<br />
Male 73.5% 77.0% 3.5<br />
Female 26.5% 23.0% -3.5<br />
Race/Ethnicity<br />
White, non–Hispanic/Latino 31.9% 34.8% 2.9<br />
White, Hispanic/Latino 11.0% 12.8% 1.8<br />
Black or African American 49.9% 45.4% -4.5<br />
Other racial groups 7.3% 7.2% -0.1<br />
Age a<br />
18 to 30 12.6% 16.7% 4.1<br />
31 to 50 50.3% 51.9% 1.6<br />
51 and older 34.9% 30.6% -4.3<br />
Veteran (adults only) b -- 15.4% --<br />
Disabled (adults only) b -- 39.7% --<br />
Age categories do not sum to 100 percent because of the small numbers of people homeless alone who were under 18<br />
years of age.<br />
Because of the very different rates of missing <strong>data</strong> between 2007 and 2008 for veteran and disability status, the<br />
comparison to 2007 is not shown for these characteristics.<br />
Source: Homeless Management Information System <strong>data</strong>, 2007- 2008<br />
52 Chapter 4: Trends in Sheltered Homelessness between 2007 and 2008
Exhibit 4-11 focuses on those individuals who stayed in emergency shelter for six months or<br />
more, a group that makes up only 5 percent of all individuals using emergency shelters. The<br />
comparisons of demographic characteristics between 2007 and 2008 show that these heavy<br />
users of emergency shelters, while still predominately African American, are becoming<br />
somewhat more white and Hispanic.<br />
Heavy users of emergency shelter as individuals also were somewhat younger in 2008 than<br />
they were in 2007, although the percentage older than 50 (30.6 percent) remained<br />
substantially greater than the percentage of all individuals in emergency shelters who were in<br />
that age group (24.5 percent).<br />
The 30-day median length of stay for families in emergency shelter was the same in 2008 as<br />
in 2007, but the pattern changed somewhat, as illustrated in Exhibit 4-12. As the exhibit<br />
shows, the percentage of families with stays between a week and a month dropped<br />
somewhat, while the proportion staying between one and three months increased, now<br />
becoming the most common length of stay category. As was the case in 2007, a substantial<br />
number of families (23.5 percent in 2008) were able to resolve their housing crisis within a<br />
week. But among those unable to do so, a larger percentage in 2008 stayed in shelter for at<br />
4-12: Lengths of Stay in Emergency Shelter for Families in 2008<br />
Compared with 2007-2008<br />
30%<br />
25%<br />
Total Fam ilies<br />
20%<br />
15%<br />
10%<br />
5%<br />
2008<br />
2007<br />
0%<br />
1 w eek or<br />
less<br />
1 w eek to<br />
1 month<br />
1-3<br />
months<br />
3-6<br />
months<br />
6-9<br />
months<br />
9 months<br />
to
least a month.<br />
Families experiencing unusually long stays in emergency housing were particularly likely to<br />
be African American in 2008, 70.6 percent, compared with 50.9 percent of all sheltered<br />
homeless families. However, this percentage dropped by a startling 17.3 percentage points,<br />
from 87.9 percent in 2007 (see Exhibit 4-13). The proportional reduction is the result of both<br />
a raw decline in the numbers of African American families who stayed more than six months<br />
in emergency shelters (despite an increase in the overall number of African American<br />
families) and rising numbers of long-term stayers among Hispanics. The number of white,<br />
non-Hispanic families staying more than six months remained steady across the two years,<br />
despite rising overall numbers. This may also reflect a rise in families entering emergency<br />
shelter in the latter half of the year as the economic crisis deepened, and this may have<br />
prevented them from reaching the six-month stay mark within the study period.<br />
This apparent change between 2007 and 2008 in the racial and ethnic profile of families<br />
staying in emergency shelter for more than six months is difficult to interpret. It should be<br />
kept in mind that such heavy users of emergency shelters made up only 9.8 percent of all<br />
homeless persons in families who used emergency shelter in 2008 (see Exhibit 4-11 above).<br />
The shifting geography of family homelessness, with growth in the numbers and percentages<br />
of persons in families found in suburban and rural areas, may help explain both the decline in<br />
the percentage of all sheltered homeless family members who are African American (from<br />
55.2 to 50.9 percent) and an even steeper decline in the percentage of families with long stays<br />
in emergency shelter who are African American.<br />
Exhibit 4-13: Change in Persons in Families Who Stayed in Emergency Shelters<br />
More Than 180 Days, 2007-2008<br />
Characteristic<br />
Percentage of<br />
Long-Stayers<br />
2007<br />
Percentage of<br />
Long-Stayers<br />
2008<br />
Change in<br />
Percentage<br />
Points<br />
White, non–Hispanic/Latino 6.8% 8.0% +1.2<br />
White, Hispanic/Latino 2.6% 9.5% +6.9<br />
Black or African American 87.9% 70.6% -17.3<br />
Other single- and multi-race groups 2.7% 12.0% +9.3<br />
Source: Homeless Management Information System <strong>data</strong>, 2007-2008<br />
Changes in Lengths of Stay in Transitional <strong>Housing</strong>, 2007-2008<br />
Lengths of stay in transitional housing are much longer than lengths of stay in emergency<br />
shelter. Homeless persons are expected to remain in transitional housing long enough to<br />
complete a program that helps overcome barriers to obtaining and maintaining permanent<br />
housing. For transitional housing used by individuals, lengths of stay grew between 2007<br />
54 Chapter 4: Trends in Sheltered Homelessness between 2007 and 2008
and 2008, as shown separately for men and women in Exhibit 4-14. For men, the median<br />
length of stay in transitional housing grew from 89 days in 2007 to 101 days in 2008. For<br />
women, the median grew from 95 days in 2007 to 120 days in 2008. Women were more<br />
likely than men to be in transitional housing for at least the entire year (21 percent of women<br />
versus 14 percent of men), and these percentages also had increased from 2007, when only<br />
12 percent of women and 9 percent of men stayed a year or more in transitional housing.<br />
Longer stays in transitional housing among individuals could reflect the selection—or self<br />
referral—into transitional housing of a higher percentage of individuals who need more time<br />
to become ready for a permanent housing placement or who are more willing to cooperate<br />
with the requirements of the transitional housing program. Longer stays in transitional<br />
housing also could reflect the greater difficulty that individuals and programs have with<br />
finding subsidized supportive or affordable mainstream housing for an outplacement from<br />
the transitional program.<br />
Exhibit 4-14: Lengths of Stay in Transitional <strong>Housing</strong> for Individual Sheltered Men<br />
and Women, 2007 and 2008<br />
Length of Stay<br />
Percentage of Individuals in<br />
Transitional <strong>Housing</strong> 2007<br />
Percentage of Individuals in<br />
Transitional <strong>Housing</strong> 2008<br />
Male Female Male Female<br />
A week or less 7.7% 8.8% 6.0% 6.5%<br />
One week to one month 15.8% 15.2% 14.7% 13.7%<br />
One to 3 months 26.9% 24.7% 26.3% 23.1%<br />
3 to 6 months 22.2% 20.5% 20.7% 17.6%<br />
6 to 9 months 11.0% 11.6% 11.7% 10.2%<br />
More than 9 months but<br />
less than a year<br />
7.3% 7.6% 7.1% 8.1%<br />
A year or more a 8.9 % 11.6% 13.6% 20.8%<br />
Median shelter nights 89 days 95 days 107 days 120 days<br />
Total number of persons 127,515 72,907 130,306 76,066<br />
a<br />
Some individuals had lengths of stay longer than a year because they were in a program at the start of the <strong>data</strong><br />
collection period or remained in the program after the end of the <strong>data</strong> collection period.<br />
Source: Homeless Management Information System <strong>data</strong>, 2007-2008<br />
Families were somewhat more likely in 2008 than in 2007 to use transitional housing. The<br />
percentage of family members using transitional housing, either alone or together with<br />
emergency shelter, increased from 30.5 to 31.3 percent. The median length of stay for<br />
families in transitional housing grew from 151 days to 160 days between 2007 and 2008.<br />
Exhibit 4-15 provides more detail on lengths of stay in transitional housing. Most striking is<br />
the increase in families staying in transitional housing at least a full year, now more than a<br />
fifth of all families using transitional housing. This could reflect greater success of<br />
transitional housing programs in retaining families through a period needed to complete the<br />
Chapter 4: Trends in Sheltered Homelessness between 2007 and 2008 55
program, or it could reflect greater difficulty in finding appropriately-sized, subsidized or<br />
unsubsidized permanent housing for families.<br />
The economic downturn may make it more difficult for both persons in families and<br />
individuals to leave homelessness, if they cannot obtain employment that will enable them to<br />
sustain their own housing, and this may help account for longer lengths of stay in transitional<br />
housing.<br />
4-15: Lengths of Stay in Transitional <strong>Housing</strong> by Families in 2008 Compared with<br />
2007<br />
25%<br />
20%<br />
Total Families<br />
15%<br />
10%<br />
2008<br />
2007<br />
5%<br />
0%<br />
1 week or<br />
less<br />
1 week to<br />
1 month<br />
1-3<br />
months<br />
3-6<br />
months<br />
6-9<br />
months<br />
9 months<br />
to
The number of both individuals and family members in emergency shelter or<br />
transitional housing in principal cities dropped somewhat, and the numbers of both<br />
sheltered homeless populations increased substantially in suburban and rural areas.<br />
Between 2007 and 2008, the share of the sheltered homeless population in suburban<br />
and rural areas increased from 23 percent to 32 percent. The increase does not reflect<br />
increased capacity of residential programs in suburban and rural areas, but instead<br />
more intensive use of that capacity.<br />
There were early signs of the potential impact of the economic crisis on<br />
homelessness. Between 2007 and 2008, there was an increase in the share of people<br />
living with family or friends the night before staying at a homeless residential<br />
program, a decrease in the share who reported they were already homeless, and an<br />
increase in the percentage who reported they had been in the place they stayed the<br />
night before for a year or more. These trends probably reflect the effect of the<br />
economic downturn that began in December 2007 and intensified toward the end of<br />
the period defined as 2008 (October 2007-September 2008).<br />
People are using homeless residential shelters for a longer amount of time. The share<br />
using emergency shelters or transitional housing for more than a month during the<br />
one-year period increased from 44.3 percent in 2007 to 48.2 percent in 2008. A<br />
somewhat higher percentage used transitional housing, which accounts in part for the<br />
longer stays overall. At the same time, the median length of stay in transitional<br />
housing also increased from 2007 to 2008 by 16 nights for individuals and 10 nights<br />
for persons in families.<br />
The changing patterns of homelessness between 2007 and 2008 suggest that family<br />
homelessness may be sensitive to ups and downs in the national economy. In response to the<br />
economic crisis, homelessness grew among families, grew in suburban and rural areas, and<br />
became relatively more white and non-Hispanic. Many families were able to resolve their<br />
housing crisis quickly, spending short times in emergency shelter. But those who were not<br />
able to leave sheltered homelessness quickly had relatively longer stays in emergency shelter<br />
or transitional housing and were more likely to use transitional housing.<br />
In contrast, the changes between 2007 and 2008 suggest that individual sheltered homelessness<br />
may be characterized increasingly by people with relatively high needs, as the number of<br />
individuals in emergency shelter or transitional housing remained stable despite the economic<br />
crisis. Indications of an individual homeless population with relatively higher needs are the<br />
increase in the share of individual homeless people who were in institutional settings the night<br />
before they became homeless, the increase in the share of sheltered homeless adults who report<br />
that they have a disability, and a drop in the percentage of individual homeless people with<br />
very short stays in emergency shelter. It may also suggest that communities have achieved<br />
some success in preventing homelessness among individuals with less severe needs.<br />
Chapter 4: Trends in Sheltered Homelessness between 2007 and 2008 57
While the 2008 <strong>data</strong> collection period (October 2007-September 2008) was still fairly early in<br />
the economic downturn, the effects of the recession were becoming evident, especially for<br />
families, among whom a substantial percentage in 2008 compared with 2007 came from a<br />
“housed” situation before entering sheltered homelessness. While the small share of families<br />
coming from a housing unit they owned did not increase, the share coming from a unit they<br />
rented increased, as did the shares reporting that they had been staying with relatives or friends.<br />
58 Chapter 4: Trends in Sheltered Homelessness between 2007 and 2008
Chapter 5<br />
The Nationwide Capacity of Residential Programs for<br />
Homeless People<br />
This chapter describes the nation’s capacity to provide shelter or permanent supportive<br />
housing for homeless and formerly homeless people. The inventory of beds is reported for<br />
four types of residential programs: emergency shelters, transitional housing, permanent<br />
supportive housing, and safe havens. 30 The chapter presents information on:<br />
<br />
<br />
<br />
<br />
The 2008 inventory of beds by residential program type. The chapter also presents<br />
the total number of beds dedicated to serving individuals and persons in families, as<br />
well as specific homeless subpopulations—e.g., unaccompanied youth, veterans, and<br />
victims of domestic violence.<br />
The geographic location of beds in 2008, focusing on the total number of beds by<br />
state and the proportion of beds located in urban and suburban/rural areas.<br />
The frequency of bed use (or the bed utilization rate) for emergency shelters and<br />
transitional housing programs. Bed utilization rates are also reported by geographic<br />
location.<br />
Changes in the nation’s capacity to provide shelter or housing for homeless and<br />
formerly homeless persons from 2006 to 2008.<br />
With one exception, all of the information presented in this chapter was reported by CoCs in<br />
a bed inventory that is part of their annual applications for funding. The exception is that the<br />
bed utilization and turnover rates use one-year estimates of shelter users as well as bed<br />
inventory information, and thus are based on both HMIS <strong>data</strong> and CoC application <strong>data</strong>.<br />
5.1 Inventory of Residential Programs and Beds, 2008<br />
Total Number of Residential Programs and Beds<br />
The 2008 national inventory of residential programs and year-round beds 31 serving homeless and<br />
formerly homeless persons included an estimated 19,563 residential programs and an estimated<br />
30<br />
31<br />
HUD required CoCs to report safe haven programs separately in Exhibit 1 of the CoC application for the<br />
first time in 2008. See box below—“Types of Residential Programs”—for a definition of a safe haven.<br />
Year-round beds are available for use throughout the year and are considered part of the stable inventory of<br />
beds for homeless persons.<br />
Chapter 5: The Nationwide Capacity of Residential Programs for Homeless People 59
614,042 beds (see Exhibit 5-1). 32 The number of programs is divided almost evenly among<br />
emergency shelters, transitional housing, and permanent supportive housing, with about a third of<br />
beds located in each program type.<br />
Types of Residential Programs<br />
1. Emergency Shelter: A facility whose primary purpose is to provide temporary shelter<br />
for people who otherwise would be forced to stay in a place not fit for human habitation.<br />
2. Transitional <strong>Housing</strong>: A residential program intended to facilitate the movement of<br />
homeless individuals and families into permanent housing. Homeless persons may live in<br />
transitional housing for up to 24 months and receive services that prepare them to<br />
obtain and retain permanent housing.<br />
3. Permanent Supportive <strong>Housing</strong> (PSH): Long-term, subsidized housing with supportive<br />
services for formerly homeless persons with disabilities to enable them to live as<br />
independently as possible in a permanent setting.<br />
4. Safe Havens: A form of supportive housing that serves hard-to-reach homeless persons<br />
with severe mental illnesses who are on the streets and have been unable or unwilling to<br />
participate in supportive services.<br />
Types of Beds Reported in a CoC <strong>Housing</strong> Inventory<br />
1. Year-round beds: Beds available for use throughout the year and considered part of<br />
the stable inventory of beds for homeless persons.<br />
2. Seasonal beds: Beds usually available during particularly high-demand seasons (e.g.,<br />
winter months in northern regions or summer months in southern regions), but not<br />
available throughout the year.<br />
3. Overflow beds: Beds typically used during emergencies (e.g., a sudden drop in<br />
temperature or a natural disaster that displaces residents). Their availability is<br />
sporadic.<br />
4. Voucher beds: Beds made available, usually in a hotel or motel. They often function as<br />
overflow beds. Some communities, especially rural communities, use vouchers instead of<br />
fixed shelters, and thus these beds also can also be year-round beds.<br />
5. Family units: <strong>Housing</strong> units (e.g., apartments) that serve homeless families. Each family<br />
unit includes several beds.<br />
32<br />
The 2008 inventory includes beds that were reported by CoCs as part of their current and new inventories.<br />
The current inventory was available for occupancy on or before January 31, 2007. The new inventory was<br />
available for occupancy between February 1, 2007 and January 30, 2008.<br />
60 Chapter 5: The Nationwide Capacity of Residential Programs for Homeless People
Exhibit 5-1: National Inventory of Residential Programs and Year-Round Beds, 2008 a<br />
Program Type<br />
Programs<br />
Beds<br />
Number Percentage Number Percentage<br />
Emergency Shelter 6,076 31.1% 211,222 34.4%<br />
Transitional <strong>Housing</strong> 7,215 36.9% 205,062 33.4%<br />
Permanent Supportive <strong>Housing</strong> 6,146 31.4% 195,724 31.9%<br />
Safe Haven b 126 0.6% 2,034 0.3%<br />
Total Number 19,563 100% 614,042 100%<br />
a<br />
b<br />
Year-round beds are available for use throughout the year and are considered part of the stable inventory of beds for<br />
homeless persons. The bed inventory includes beds in Puerto Rico, the U.S. Territories of Guam and the Virgin Islands.<br />
The 2008 CoC application asked CoCs to report information on safe havens separately for the first time.<br />
Source:<br />
2008 Continuum of Care Application: Exhibit 1, CoC <strong>Housing</strong> Inventory<br />
The national bed inventory also includes safe haven programs. In 2008, CoCs were required to<br />
report safe haven programs separately on the CoC application for the first time. (In previous<br />
years, safe haven programs were reported as either emergency shelters or transitional housing.)<br />
Emergency Shelter and Transitional <strong>Housing</strong><br />
In 2008, the national inventory of year-round beds for homeless persons was split almost<br />
evenly between emergency shelter and transitional housing programs. Emergency shelters<br />
dedicated slightly more than half of their beds to homeless individuals, while transitional<br />
housing programs dedicated slightly more than half of their beds to homeless families (see<br />
Exhibit 5-2). Family beds are located within units—such as apartments or single rooms that<br />
are occupied by one family—and programs that served families had 65,587 family units with<br />
an average 3.2 beds per unit. Transitional housing programs provided more than half of all<br />
family units nationwide (54 percent), and the remaining units were provided through<br />
emergency shelters.<br />
In addition to their year-round beds, CoCs must report their inventory of seasonal and<br />
overflow or voucher beds in emergency shelters. These beds are typically used during<br />
inclement weather conditions or when demand for shelter services exceeds the year-round<br />
bed capacity. The 2008 national bed inventory included 20,413 seasonal beds and 37,141<br />
overflow or voucher beds. If these beds are added to the total number of year-round shelter<br />
beds in emergency shelters and transitional housing programs, the nation’s peak bed capacity<br />
for homeless persons in 2008 was 473,838 beds.<br />
Permanent Supportive <strong>Housing</strong><br />
For several years, one of HUD’s policy priorities has been the development of permanent<br />
supportive housing programs that provide a combination of housing and supportive services<br />
to formerly homeless people with disabilities. In 2008, the nation’s permanent supportive<br />
Chapter 5: The Nationwide Capacity of Residential Programs for Homeless People 61
housing inventory included nearly 196,000 beds (see Exhibit 5-3). About 61 percent of these<br />
beds (119,143) served unaccompanied individuals, with the remaining 39 percent serving<br />
families (76,581). The inventory of permanent supportive housing beds for families was<br />
distributed across approximately 27,000 family units, with an average of 2.9 beds per unit.<br />
Exhibit 5-2: Number of Emergency and Transitional Beds and Units in Homeless<br />
Assistance System Nationwide, 2008<br />
Emergency Shelters<br />
Total Year-<br />
Round<br />
Beds<br />
Year-Round Beds<br />
Family<br />
Beds<br />
Individual<br />
Beds<br />
Total Yr-<br />
Round<br />
Family<br />
Units<br />
Seasonal<br />
Other Beds<br />
Overflow<br />
or Voucher<br />
Current inventory 211,222 98,703 112,519 30,117 20,413 37,141<br />
Transitional <strong>Housing</strong><br />
Current inventory 205,062 110,973 94,089 35,470 N/A N/A<br />
Total<br />
Current inventory 416,284 209,676 206,608 65,587 20,413 37,141<br />
Source: 2008 Continuum of Care Application: Exhibit 1, CoC <strong>Housing</strong> Inventory<br />
Exhibit 5-3: Number of Permanent Supportive <strong>Housing</strong> Beds in Homeless<br />
Assistance System Nationwide, 2008<br />
Total Year-<br />
Round Beds<br />
Permanent Supportive <strong>Housing</strong> Programs<br />
Year-Round Beds<br />
Family Beds<br />
Individual Beds<br />
Total Yr-Round<br />
Family Units<br />
Current inventory 195,724 76,581 119,143 26,729<br />
Source:<br />
2008 Continuum of Care Application: Exhibit 1, CoC <strong>Housing</strong> Inventory<br />
Safe Havens<br />
HUD funds safe haven programs designed to serve people with severe mental illness. Safe<br />
haven programs resemble permanent housing in that homeless persons may reside in these<br />
24-hour residences for an unspecified duration in private or semi-private accommodations.<br />
Occupancy is limited to no more than 25 persons. The nation’s inventory of safe haven<br />
programs included 2,034 beds in 2008, less than one percent of the total bed inventory. All<br />
safe haven beds served homeless individuals. As CoCs continue to report on safe haven<br />
programs in their CoC applications, future AHAR reports will track changes in the safe<br />
haven bed inventory over time.<br />
62 Chapter 5: The Nationwide Capacity of Residential Programs for Homeless People
Inventory of Beds for Homeless Subpopulations<br />
Emergency shelter and transitional housing programs reserve a portion of their beds for a<br />
variety of homeless subpopulations with special characteristics and needs. In 2008, about 81<br />
percent of beds were available to the general homeless population, with the remainder of<br />
beds reserved for specific subpopulations: approximately 13 percent for victims of domestic<br />
violence; 3 percent for veterans; 2 percent for unaccompanied youth; and 2 percent for<br />
persons living with HIV/AIDS (see<br />
Exhibit 5-4). 33<br />
While both emergency shelters and<br />
transitional housing programs target<br />
about one-fifth of their beds for<br />
specific populations, the target<br />
population varies slightly by program<br />
type. A larger proportion of beds were<br />
available for victims of domestic<br />
violence in emergency shelters (16<br />
percent) than in transitional housing (9<br />
percent). Transitional housing<br />
programs reserved more beds for<br />
veterans (5 percent) and for persons<br />
living with HIV/AIDS (2 percent),<br />
compared to emergency shelters (0.8<br />
percent for both population types).<br />
The share of beds for unaccompanied<br />
youth was the same for both<br />
emergency shelters and transitional<br />
housing programs (2 percent).<br />
5.2 Geographic Location of Beds, 2008<br />
Distribution of Beds by State<br />
Exhibit 5-4: Year-Round Emergency Shelter<br />
and Transitional <strong>Housing</strong> Beds by<br />
Homeless Subpopulation, 2008<br />
80.9%<br />
12.8%<br />
Domestic violence victims only<br />
Veterans only<br />
Persons with HIV/AIDS<br />
Unaccompanied youth<br />
General population<br />
2.8%<br />
1.5%<br />
1.9%<br />
Source: 2008 Continuum of Care Application: Exhibit 1, CoC<br />
<strong>Housing</strong> Inventory<br />
Exhibit 5-5 shows the total number of beds by state. The exhibit also provides a beds per capita<br />
rate that is equal to the number of beds per 1,000 people in the state. Nationwide, there were 2 beds<br />
for homeless and formerly homeless persons per 1,000 people in the United States.<br />
33<br />
The CoC application reports beds dedicated to unaccompanied youth separately from beds dedicated to<br />
victims of domestic violence, veterans, or persons living with HIV/AIDS. The exhibit assumes that beds<br />
dedicated to unaccompanied youth are mutually exclusive from beds dedicated to these other<br />
subpopulations.<br />
Chapter 5: The Nationwide Capacity of Residential Programs for Homeless People 63
Exhibit 5-5: National Inventory of Year-Round Beds and Beds Per Capita<br />
Rate by State, 2008 1<br />
Rank State # of<br />
Beds<br />
Beds Per<br />
Capita<br />
Rate<br />
Rank State # of<br />
Beds<br />
Beds Per<br />
Capita<br />
Rate<br />
1 District of<br />
Columbia 8,858 15.0 New Hampshire 2,350 1.8<br />
2 New York 88,998 4.6 Ohio 20,240 1.8<br />
3 Oregon 14,215 3.8 29 Delaware 1,509 1.7<br />
4 Maine 4,718 3.6 Iowa 5,102 1.7<br />
Hawaii 4,600 3.6 Indiana 10,817 1.7<br />
6 Washington 23,123 3.5 Florida 31,026 1.7<br />
7 Massachusetts 22,339 3.4 Missouri 9,955 1.7<br />
8 Alaska 2,163 3.2 34 Louisiana 7,137 1.6<br />
9 Nevada 7,162 2.8 35 Wisconsin 8,255 1.5<br />
10 Minnesota 13,135 2.5 Wyoming 777 1.5<br />
11 Vermont 1,495 2.4 Montana 1,407 1.5<br />
12 Rhode Island 2,449 2.3 38 Alabama 6,752 1.4<br />
13 Connecticut 7,563 2.2 Georgia 13,936 1.4<br />
California 79,119 2.2 Idaho 2,188 1.4<br />
15 Arizona 13,321 2.0 Tennessee 8,885 1.4<br />
Pennsylvania 25,481 2.0 West Virginia 2,586 1.4<br />
South Dakota 1,636 2.0 43 North Carolina 11,998 1.3<br />
18 Nebraska 3,463 1.9 44 Virginia 9,542 1.2<br />
North Dakota 1,199 1.9 Arkansas 3,359 1.2<br />
Kentucky 7,950 1.9 46 Kansas 3,192 1.1<br />
New Mexico 3,685 1.9 South Carolina 4,958 1.1<br />
Michigan 18,561 1.9 Oklahoma 4,002 1.1<br />
23 Illinois 23,642 1.8 Texas 26,473 1.1<br />
Maryland 10,212 1.8 New Jersey 9,280 1.1<br />
Utah 4,931 1.8 51 Mississippi 2,044 0.7<br />
Colorado 8,849 1.8 Total 610,637 2.0<br />
1<br />
The beds per capita rate indicates the number of residential beds per 1,000 people in the state. Puerto<br />
Rico and U.S. Territories are not included: Guam (303 beds and 2.0 beds per capita), Virgin Islands (157<br />
beds and 1.4 beds per capita), and Puerto Rico (2,945 beds and 0.7 beds per capita).<br />
Sources: 2008 Continuum of Care Application: Exhibit 1, CoC <strong>Housing</strong> Inventory; 2007 American Community<br />
Survey<br />
The median number of beds per capita was 1.8. The District of Columbia has 8,858 beds, and its<br />
per capita rate surpassed all states, with 15 beds per 1,000 people. The State of New York had the<br />
largest inventory of beds in the country (88,998 beds) and the second highest per capita rate (4.6).<br />
California also had a very large bed inventory (79,119 beds), and its per capita rate was slightly<br />
above the national average (2.2). Among the five most populous states in the United States—<br />
California, Texas, New York, Florida, and Illinois—Texas had the lowest number of beds in<br />
64 Chapter 5: The Nationwide Capacity of Residential Programs for Homeless People
proportion to its population. Nonetheless, all populous states tended to have a large share of the<br />
total national bed inventory (see Exhibit 5-6).<br />
Exhibit 5-6 Percentage of the Nation’s Bed Inventory by State, 2008<br />
Source:<br />
2008 Continuum of Care Application: Exhibit 1, CoC <strong>Housing</strong> Inventory<br />
Distribution of Beds by Urban and Suburban/Rural Areas<br />
According to information submitted by CoCs in 2008, more than half of all programs and almost<br />
two-thirds of all beds are located in a principal city (see Exhibit 5-7). The distribution of<br />
programs and beds varies by program type. Transitional housing and permanent supportive<br />
housing programs follow a similar distribution as the nationwide inventory. But a large majority<br />
of safe haven programs and beds —about three-quarters—are located in principal cities. While<br />
about two-thirds of emergency shelter beds are located in principal cities, less than half of the<br />
programs are located in these areas. The seemingly inconsistent distribution of emergency<br />
shelter programs and beds is driven by the fact that emergency shelter programs tend to be larger<br />
in principal cities than in suburban and rural areas. The average size of an emergency shelter in<br />
principal cities was 52 beds, compared to 20 beds in suburban and rural areas.<br />
Chapter 5: The Nationwide Capacity of Residential Programs for Homeless People 65
Exhibit 5-7: Distribution of Bed Inventory by Geographic Area, 2008<br />
Type of Program<br />
Emergency Shelter<br />
Total Number<br />
Suburban<br />
Principal City and Rural<br />
Areas<br />
Percentage of Total<br />
Principal City<br />
Suburban and<br />
Rural Areas<br />
Number of programs 2,817 3,259 46.4% 53.6%<br />
Number of year-round beds 147,186 64,036 69.7% 30.3%<br />
Transitional <strong>Housing</strong><br />
Number of programs 3,991 3,224 55.3% 44.7%<br />
Number of year-round beds 126,826 78,236 61.9% 38.2%<br />
Permanent Supportive <strong>Housing</strong><br />
Number of programs 3,587 2,559 58.4% 41.6%<br />
Number of year-round beds 131,869 63,855 67.4% 32.65<br />
Safe Haven<br />
Number of programs 93 33 73.8% 26.25<br />
Number of year-round beds 1,536 498 75.5% 24.5%<br />
Total<br />
Number of programs 10,488 9,075 53.6% 46.4%<br />
Number of year-round beds 407,417 206,625 66.4% 33.6%<br />
Source:<br />
2008 Continuum of Care Application: Exhibit 1, CoC <strong>Housing</strong> Inventory<br />
5.3 Bed Utilization and Turnover Rates, 2008<br />
This section describes the average daily bed utilization and bed turnover rates by residential<br />
program type and geographic area. The bed utilization and turnover rates use one-year<br />
estimates of shelter users based on HMIS <strong>data</strong> as well as bed inventory information reported<br />
by CoCs in their annual applications. The HMIS <strong>data</strong> account for the total number of persons<br />
who used an emergency shelter or transitional housing facility at any point from October 1,<br />
2007 through September 30, 2008.<br />
Emergency Shelters<br />
Between October 2007 and September 2008, over 90 percent of emergency shelter beds were<br />
occupied on an average day (see Exhibit 5-8). Emergency shelter beds dedicated to<br />
individuals were near full capacity—around 94 percent occupied on an average day—<br />
whereas 86 percent of beds for persons in families were occupied on average. Emergency<br />
shelters also had high bed turnover rates, especially among homeless individuals. Seven<br />
homeless persons were served per bed each year, with a slightly higher turnover rate among<br />
individual beds and a lower rate among family beds.<br />
66 Chapter 5: The Nationwide Capacity of Residential Programs for Homeless People
Types of Bed Utilization Rates<br />
1. Average daily utilization rate: The percentage of available year-round equivalent beds<br />
occupied on an average night during the 12-month reporting period. Year-round equivalent<br />
beds include seasonal beds that have been pro-rated for the portion of the year that they<br />
are available.<br />
2. Turnover rate: The total number of people served per year-round bed during the 12-<br />
month reporting period.<br />
Emergency shelters located in principal cities had particularly high utilization rates but<br />
slightly lower bed turnover rates when compared to similar programs located in<br />
suburban/rural areas. About 93 percent of beds in principal cities were occupied on an<br />
average day compared to 86 percent of beds in suburban and rural areas. Beds dedicated to<br />
individuals in both principal cities and suburban/rural areas had higher utilization and<br />
turnover rates than those dedicated to persons in families.<br />
Exhibit 5-8: Average Daily Utilization and Turnover Rate of All Year-Round<br />
Equivalent Beds by Program and Household Type and by Geographic<br />
Area, 2008 a Emergency Shelters<br />
Transitional <strong>Housing</strong><br />
Rate a Total Individual Family Total Individual Family<br />
Overall<br />
Utilization rate 91.0% 94.3% 86.1% 82.7% 87.1% 78.4%<br />
Turnover rate 6.9 8.3 5.0 1.8 2.1 1.6<br />
Principal City<br />
Utilization rate 93.1% 95.2% 89.7% 81.8% 84.8% 78.2%<br />
Turnover rate 6.7 8.2 4.6 1.9 2.0 1.7<br />
Suburban and Rural Areas<br />
Utilization rate 85.8% 91.9% 78.3% 83.9% 91.4% 78.6%<br />
Turnover rate 7.3 8.7 5.7 1.8 2.3 1.5<br />
a<br />
b<br />
The rates reported in the exhibit are based on year-round equivalent beds. A year-round equivalent bed is equal to the<br />
total number of year-round beds plus the total number of seasonal beds in proportion to the amount of time these beds<br />
were available during the one-year reporting period.<br />
The exhibit provides two types of bed utilization rates—average daily bed utilization rates and bed turnover rates. The<br />
average daily bed utilization rate is calculated by dividing the average daily census during the study period by the total<br />
number of year-round beds in the current inventory and then converting it to a percentage. The turnover rate measures<br />
the number of persons served per available bed over the 12-month period. It is calculated by dividing the number of<br />
persons served by the number of year-round beds.<br />
Source: Homeless Management Information System <strong>data</strong>, 2008<br />
Chapter 5: The Nationwide Capacity of Residential Programs for Homeless People 67
Transitional <strong>Housing</strong><br />
Compared to emergency shelters, transitional housing programs have lower bed utilization<br />
and turnover rates. About 83 percent of transitional housing beds were occupied on an<br />
average day, and beds dedicated to individuals were again more likely to be occupied than<br />
those serving persons in families (87 percent versus 78 percent). Not surprisingly, bed<br />
turnover rates in transitional housing were much lower than those of emergency shelters.<br />
During the one-year reporting period, a transitional housing bed for either individuals or<br />
persons in families typically serves two people.<br />
Unlike emergency shelters, transitional housing programs located in suburban/rural areas<br />
have higher bed utilization rates than those located in principal cities. About 84 percent of<br />
transitional housing beds in suburban/rural areas are occupied on an average day compared to<br />
82 percent of beds in principal cities. There is little difference in bed turnover rates by<br />
geographic area for transitional housing programs.<br />
The 2008 <strong>data</strong> on bed use reinforced two patterns that have been consistently observed in<br />
other studies: (1) emergency shelters have higher average daily utilization rates and turnover<br />
rates than transitional housing programs, and (2) beds for unaccompanied individuals have<br />
higher average daily utilization rates and turnover rates than beds for persons in families. 34<br />
Duration in a shelter and frequency of bed use both affect turnover rates. The shorter the<br />
average length of stay and the faster a program can fill a vacant bed, the higher the turnover<br />
rate. These findings are consistent with the information reported in chapter 3, which shows<br />
that people who stay in emergency shelters had shorter lengths of stay than those who stay in<br />
transitional housing programs, and that individuals who stay in both program types had<br />
shorter lengths of stay than families.<br />
5.4 Changes in the National Inventory of Residential Programs and<br />
Beds, 2006-2008<br />
Changes in the Total Number of Residential Programs and Beds<br />
Since 2006, the total number of residential programs in the national inventory of programs serving<br />
homeless and formerly homeless persons has increased by 1,454 (see Exhibit 5-9). 35 The increase<br />
includes an additional 33 emergency shelters (0.5 percent increase since 2006), 199 transitional<br />
34<br />
35<br />
Burt, Martha and Sam Hall. 2008. Transforming the District of Columbia's Public Homeless Assistance<br />
System. Washington D.C.: Urban Institute.<br />
There were an additional 126 safe haven programs that were excluded from this analysis because 2008 was<br />
the first year in which these programs were reported separately and thus trend <strong>data</strong> is not available. If safe<br />
havens were included, there would be 1,580 more programs in 2008 than 2006.<br />
68 Chapter 5: The Nationwide Capacity of Residential Programs for Homeless People
housing programs (2.8 percent), and 1,096 permanent supportive housing programs (21.7<br />
percent).<br />
Exhibit 5-9: Change in the National Inventory of Homeless Residential<br />
Programs, 2006-2008<br />
8,000<br />
7,000<br />
6,000<br />
5,000<br />
4,000<br />
3,000<br />
2,000<br />
1,000<br />
0<br />
6,043<br />
7,016 7,275 7,215<br />
5,050 5,654<br />
6,140<br />
6,076<br />
2006 2007 2008<br />
Emergency shelter<br />
Transitional housing<br />
Permanent supportive housing<br />
6,146<br />
Source: Continuum of Care Application: Exhibit 1, CoC <strong>Housing</strong> Inventory, 2006-2008<br />
During the same 3-year period, the total number of beds available in residential programs<br />
throughout the United States increased by almost 31,000 beds (or 5 percent), reflecting an increase<br />
in beds across all program types (see Exhibit 5-10). The number of emergency shelter beds<br />
increased by 4,345 (2 percent), the number of transitional housing beds increased by 5,353 (3<br />
percent), and the number of permanent supportive housing beds increased by 18,894 (11 percent).<br />
The increase in the inventory of permanent supportive housing programs and beds is particularly<br />
noteworthy because it is consistent with HUD’s emphasis on expanding the stock of supportive<br />
housing. In collaboration with the Interagency Council on Homelessness, HUD has placed<br />
federal policy and funding behind local efforts to end homelessness through permanent<br />
supportive housing. Hundreds of city governments have responded by developing “10 year<br />
plans” that place a priority on expanding permanent supportive housing in their communities.<br />
HUD has also partnered with the Department of Veterans Affairs to administer jointly a new<br />
federal Veterans Affairs Supportive <strong>Housing</strong> (VASH) program. The HUD–VASH program<br />
combines rental assistance for homeless veterans with case management and clinical services<br />
provided by the Department of Veterans Affairs at its medical centers and in the community.<br />
As reported in chapter 2, the number of persons who were chronically homeless remained<br />
essentially the same from 2007 to 2008, despite adding nearly 19,000 permanent supportive<br />
Chapter 5: The Nationwide Capacity of Residential Programs for Homeless People 69
housing beds during this period. It is possible that the number of persons experiencing chronic<br />
homelessness kept pace with the new inventory—that is, the new inventory of permanent<br />
supportive housing beds offset increases in chronic homelessness—and in the absence of the new<br />
inventory, the number of chronically homeless persons would have increased. This finding may<br />
also suggest the need to target permanent supportive housing beds more effectively to persons<br />
experiencing chronic homelessness.<br />
Exhibit 5-10: Change in the National Inventory of Homeless Residential Year-<br />
Round Beds, 2006-2008<br />
220,000<br />
210,000<br />
200,000<br />
206,877<br />
211,451<br />
211,205<br />
211,222<br />
205,062<br />
190,000<br />
180,000<br />
199,709<br />
188,636<br />
195,724<br />
170,000<br />
176,830<br />
160,000<br />
150,000<br />
2006 2007 2008<br />
Emergency shelters<br />
Transitional housing<br />
Permanent supportive housing<br />
Source: Continuum of Care Application: Exhibit 1, CoC <strong>Housing</strong> Inventory, 2006-2008<br />
Changes in the Inventory of Beds for Homeless Subpopulations<br />
The overall proportion of beds dedicated to homeless individuals and persons in families has<br />
remained fairly constant since 2006. The percentage of beds dedicated to homeless persons in<br />
families has remained level in emergency shelters, at about 46 percent, and also in transitional<br />
housing, at about 53 percent (see Exhibit 5-11). The percentage of permanent supportive housing<br />
beds for families has decreased slightly since 2006, from 44 percent to 39 percent in 2008, likely<br />
reflecting the increased number of new units resulting from an emphasis on ending chronic<br />
homelessness through permanent supportive housing programs (by definition, all chronically<br />
homeless persons are individuals).<br />
70 Chapter 5: The Nationwide Capacity of Residential Programs for Homeless People
Exhibit 5-11: Change in the Percentage of Beds Dedicated to Persons in<br />
Families by Program Type, 2006-2008<br />
60%<br />
52%<br />
53%<br />
54%<br />
50%<br />
40%<br />
30%<br />
46%<br />
44%<br />
38%<br />
46%<br />
39%<br />
47%<br />
20%<br />
10%<br />
0%<br />
2006 2007 2008<br />
Emergency shelter<br />
Transitional housing<br />
Permanent supportive housing<br />
Source: Continuum of Care Application: Exhibit 1, CoC <strong>Housing</strong> Inventory, 2006-2008<br />
Changes in Average Daily Utilization and Turnover Rates<br />
Average daily utilization and turnover rates increased from 2007 to 2008 (see Exhibit 5-<br />
12). 36 Overall, utilization rates among emergency shelters and transitional housing programs<br />
increased 2.5 and 5.8 percentage points, respectively. Bed turnover rates for both program<br />
types changed little from 2007 to 2008.<br />
Changes in bed utilization patterns, however, varied depending on the geographic location of<br />
programs and beds. Use of emergency shelters on an average day increased in principal<br />
cities (5.5 percentage points), but decreased in suburban and rural areas (5.6 percentage<br />
points). The decrease was attributed to a large decrease among emergency shelters that<br />
served families (from 93.9 percent in 2007 to 78.3 percent in 2008), which offset a slight<br />
increase among emergency shelters that served individuals (from 89.7 percent in 2007 to<br />
91.9 percent in 2008). Bed turnover rates declined very slightly.<br />
36<br />
The rates reported in the 2008 AHAR were based on year-round equivalent beds. A year-round equivalent<br />
bed is equal to the total number of year-round beds plus the total number of seasonal beds in proportion to<br />
the amount of time these beds were available during the one-year reporting period. In previous AHARs,<br />
both the average daily utilization and turnover rates were based on year-round beds. Rates based on yearround<br />
equivalent beds are more precise in that these rates account for seasonal beds, which, in some<br />
communities, represent a large percentage of their total bed inventory.<br />
Chapter 5: The Nationwide Capacity of Residential Programs for Homeless People 71
Exhibit 5-12: Average Daily Utilization and Turnover Rate of All Year-Round<br />
Equivalent Beds by Program Type and by Geographic Area, 2007-<br />
2008 a Total Principal City Suburban/Rural<br />
Rates b 2007 2008 2007 2008 2007 2008<br />
Average Daily Utilization Rate<br />
Emergency Shelter 88.5% 91.0% 87.6% 93.1% 91.4% 85.8%<br />
Transitional <strong>Housing</strong> 76.9% 82.7% 78.6% 81.8% 73.7% 83.9%<br />
Turnover Rate<br />
Emergency Shelter 7.3 6.9 7.5 6.7 6.6 7.3<br />
Transitional <strong>Housing</strong> 1.8 1.8 2.0 1.8 1.5 1.8<br />
a<br />
b<br />
The rates reported in the exhibit were based on year-round equivalent beds. A year-round equivalent bed is equal<br />
to the total number of year-round beds plus the total number of seasonal beds in proportion to the amount of time<br />
these beds were available during the one-year reporting period. The rates reported for 2007 will not match the<br />
rates reported in the 2007 AHAR because previous AHARs calculated utilization rates based on year-round beds.<br />
Rates based on year-round equivalent beds are more precise in that these rates account for seasonal beds, which, in<br />
some communities, represent a large percentage of their total bed inventory.<br />
The exhibit provides two types of bed utilization rates—average daily bed utilization rates and bed turnover rates.<br />
The average daily bed utilization rate is calculated by dividing the average daily census during the study period by<br />
the total number of year-round beds in the current inventory and then converting it to a percentage. The turnover<br />
rate measures the number of persons served per available bed over the 12-month period. It is calculated by<br />
dividing the number of persons served by the number of year-round beds.<br />
Source: Homeless Management Information System <strong>data</strong>, 2007 – 2008<br />
5.5 Summary of the Nationwide Capacity of Residential Programs for<br />
Homeless People<br />
Use of transitional housing programs increased in principal cities and surged in<br />
suburban/rural areas. The increase in principal cities (3.2 percentage points) included an<br />
increase in bed use among both individuals (4.1 percentage points) and persons in families<br />
(2.1 percentage points). In suburban/rural areas, the use of beds in transitional housing<br />
programs increased by 10.3 percentage points, which was consistent across programs serving<br />
individuals and families. These findings were consistent with the sizable increase in<br />
suburban/rural homelessness that was reported in chapter 3.<br />
In sum, the bed inventory <strong>data</strong> reported by CoCs show that:<br />
<br />
<br />
The 2008 national inventory of residential programs and year-round beds serving<br />
homeless and formerly homeless persons included an estimated 19,563 residential<br />
programs and an estimated 614,042 beds.<br />
The 2008 national bed inventory included 20,413 seasonal beds and 37,141 overflow<br />
or voucher beds. If these beds are added to the total number of year-round shelter<br />
72 Chapter 5: The Nationwide Capacity of Residential Programs for Homeless People
eds in emergency shelters and transitional housing programs, the nation’s peak bed<br />
capacity for homeless persons in 2008 was 473,838 beds.<br />
The increase in the nationwide inventory of programs between 2006 and 2008 for<br />
homeless and formerly homeless persons was driven almost entirely by the 22 percent<br />
increase in the inventory of permanent supportive housing programs.<br />
Between 2006 through 2008, the total number of beds available in residential<br />
programs throughout the United States increased by almost 31,000 (5 percent),<br />
reflecting an increase in beds across all program types.<br />
Between 2007 and 2008, the average daily bed utilization rate increased overall, but<br />
surged by 10 percentage points among transitional housing programs in suburban and<br />
rural areas.<br />
Chapter 5: The Nationwide Capacity of Residential Programs for Homeless People 73
Chapter 6<br />
Looking Ahead<br />
The 2008 AHAR is the first report to provide year-to-year trend information on the<br />
prevalence of homelessness nationwide, the demographic characteristics of homeless people,<br />
and the way homeless people use the residential services system. The trend information is<br />
based on HMIS <strong>data</strong> collected at the local level and covers a two-year period, from October<br />
1, 2006-September 30, 2007 and October 1, 2007-September 30, 2008. It is also the first<br />
report to compare PIT estimates reported by CoCs across multiple years.<br />
The trends observed in this report reinforce some of the findings from previous AHARs.<br />
Namely, homelessness remains predominately an urban phenomenon and most people are<br />
homeless as individuals rather than as members of families. But trends in the 2008 AHAR<br />
also provide an early indication of how homelessness may be changing over time and<br />
whether the current economic and foreclosure crisis has led to higher rates of homelessness.<br />
Overall, the number of sheltered homeless persons has remained relatively unchanged from<br />
2007 to 2008, at about 1.6 million people over the course of the year, but the composition of<br />
the sheltered homeless population has shifted appreciably. During the two-year period, the<br />
number of sheltered persons in families increased by 9 percent, and families now represent<br />
nearly one-third of the entire sheltered population, up from 29 percent in 2007. This shift has<br />
occurred simultaneously with another important shift: between 2007 and 2008, the share of<br />
the overall sheltered homeless population living in suburban and rural areas increased from<br />
23 percent to 32 percent.<br />
So far there is little evidence to suggest that the early months of the economic recession have<br />
created a surge in the number of sheltered homeless persons, but the early signs of the<br />
recession’s impact are present. In fact, it may be premature to expect these changes in the<br />
2008 AHAR because the impact of the crisis continues to unfold and the <strong>data</strong> collection<br />
period for the 2008 AHAR ended on September 30, 2008, just as the crisis was accelerating.<br />
Also, there is an expected time delay between the moment someone loses her job or home<br />
and the moment she enters the shelter system. People typically would rely on other housing<br />
options—such as family and friends—before resorting to the shelter system. Data in the<br />
2008 AHAR reinforce this point. Between 2007 and 2008, there was an increase in the share<br />
of people coming to shelters who were living with family or friends the night before entering<br />
a homeless residential facility, as well as an increase in the percentage that were staying in a<br />
place for one year or more before becoming homeless. These trends probably reflect the<br />
early signs of the economic downturn.<br />
Chapter 6: Looking Ahead 75
6.1 The 2009 AHAR<br />
The 2009 AHAR will continue to provide Congress and the nation with updated counts of<br />
homelessness nationwide, including counts of individuals, persons in families, and special<br />
population groups such as chronically homeless people and persons with disabilities. The<br />
next report will also use trend <strong>data</strong> for three years (2007-2009) to explore changes in the<br />
demographic profile of homelessness; where people use emergency shelter and transitional<br />
housing; where people were just before they entered a residential program; how much time<br />
they spend in shelters over the course of a year; and the size and use of the U.S inventory of<br />
residential programs for homeless people.<br />
These topics will be explored using <strong>data</strong> from an ever-expanding group of communities that<br />
participate in the AHAR. Between 2007 and 2008, the number of communities that provided<br />
useable <strong>data</strong> to the AHAR increased from 98 to 222, the largest increase since HUD first<br />
began collecting <strong>data</strong> for the AHAR. HUD expects this trend to continue, and future AHARs<br />
will soon be reflecting <strong>data</strong> collected by the majority of Continuums of Care nationwide. As<br />
a result, the precision of the national estimates are expected to improve with each successive<br />
report.<br />
The 2009 AHAR will also feature two important additions: a special chapter on homeless<br />
veterans and <strong>data</strong> on HUD’s efforts to prevent homelessness and re-house homeless people<br />
through the Homelessness Prevention and Rapid Re-<strong>Housing</strong> Program (HPRP). The chapter<br />
on homeless veterans comes at a time when many service men and women are returning from<br />
active duty in Iraq and being deployed to Afghanistan. Thus, the chapter will provide an<br />
important baseline understanding of homelessness among veterans that, in turn, can be used<br />
to assess how homelessness among veterans may change over time.<br />
In addition, as part of the American Recovery and Reinvestment Act of 2009, Congress<br />
allocated $1.5 billion for a Homelessness Prevention Fund, which supports HPRP. The<br />
purpose of HPRP is to provide homelessness prevention assistance to households who would<br />
otherwise become homeless—many due to the economic crisis—and to provide assistance to<br />
rapidly re-house persons who are homeless. HUD will begin collecting <strong>data</strong> from HPRP<br />
programs nationwide and report this information in the 2009 AHAR.<br />
HUD continues to view the AHAR as the primary resource for up-to-date information about<br />
homelessness based on locally-derived HMIS <strong>data</strong> and is exploring ways to make these <strong>data</strong><br />
readily accessible to states, localities, and the general public. Based on the AHAR,<br />
policymakers and practitioners alike will be able to better understand homelessness in their<br />
communities, allocate local homeless assistance funds effectively, improve program<br />
operations, and work toward the ultimate goal of ending homelessness.<br />
76 Chapter 6: Looking Ahead
Appendix A: List of 2008 AHAR Sample Sites and<br />
Contributing Communities<br />
Appendix A A-1
A-2 Appendix A
Appendix A A-3
A-4 Appendix A
Appendix A A-5
A-6 Appendix A
Appendix A A-7
A-8 Appendix A
Appendix A A-9
A-10 Appendix A
Appendix A A-11
A-12 Appendix A
Appendix A A-13
A-14 Appendix A
Appendix A A-15
Appendix B: Data Collection and Analysis<br />
Methodology<br />
Appendix B B-1
B.1 Introduction<br />
This document summarizes the methodology for producing the 2008 Annual Homeless<br />
Assessment Report (AHAR). Abt Associates and the University of Pennsylvania Center for<br />
Mental Health Policy and Services Research (the AHAR research team) developed the<br />
methodology.<br />
The 2008 AHAR is based on two primary sources of <strong>data</strong>:<br />
1. Homeless Management Information Systems (HMIS). The HMIS <strong>data</strong> were collected<br />
from a nationally representative sample of communities 1 and cover a one-year reporting<br />
period, October 1, 2007 to September 30, 2008. The <strong>data</strong> contain information on<br />
homeless persons who used emergency shelters or transitional housing at any point<br />
during this time period. Data are unduplicated at the community-level and reported in the<br />
aggregate. HMIS <strong>data</strong> include information on the number, characteristics, and serviceuse<br />
patterns of homeless persons. Each AHAR incorporates HMIS <strong>data</strong> for the most<br />
recent, one-year reporting period and compares these <strong>data</strong> to previous findings. The<br />
2008 AHAR provides comparisons of HMIS <strong>data</strong> from 2006-2007 (first reported in<br />
the 2007 AHAR) to <strong>data</strong> from 2007-2008.<br />
2. Continuum of Care (CoC) applications. The CoC application <strong>data</strong> were collected<br />
from all CoCs in 2008, and the 2008 AHAR compares these <strong>data</strong> to <strong>data</strong> from the<br />
previous two years. The CoC application <strong>data</strong> complement the HMIS-based <strong>data</strong> by<br />
including an estimate of the number of unsheltered homeless persons on a single<br />
night in January. They also include an estimate of the number and basic demographic<br />
characteristics of sheltered homeless persons on that night and the number of<br />
emergency shelter and transitional housing beds available to serve homeless persons.<br />
The information comes from the CoC applications that all CoCs must complete to be<br />
eligible for HUD McKinney-Vento Act funding.<br />
The remainder of this appendix describes the AHAR sample <strong>data</strong> in more detail. Section B-2<br />
discusses the population represented by the AHAR sample and the information collected<br />
about persons experiencing homelessness. Section B-3 describes how the nationally<br />
representative sample was selected and the number of communities that were able to<br />
contribute local HMIS <strong>data</strong> to the AHAR. Section B-4 presents the results of the <strong>data</strong><br />
cleaning process and describes how usable <strong>data</strong> were identified for the final AHAR analysis<br />
1<br />
Data from AHAR sample sites is supplemented with <strong>data</strong> from other Continuums of Care that were not<br />
selected as part of the original sample but chose to contribute their HMIS <strong>data</strong> for the AHAR. These<br />
communities are called ‘contributing communities’; unlike AHAR sample sites, contributing communities<br />
only represent themselves in the national estimates, meaning their <strong>data</strong> is not weighted to represent other<br />
communities to produce the national estimate.<br />
B-2 Appendix B
file. Section B-5 describes the process for developing the analysis weights for each site to<br />
produce nationally representative estimates.<br />
B.2 Data and AHAR Reporting Categories<br />
This section describes the target population for inclusion in the AHAR sample, the source of<br />
<strong>data</strong>, and the <strong>data</strong> collection process.<br />
Target Population for the AHAR Sample<br />
The HMIS-based <strong>data</strong> in the AHAR sample includes information on all persons experiencing<br />
homelessness who used an emergency shelter or transitional housing facility at any time<br />
during a one-year period, from October 1, 2007 through September 30, 2008.<br />
The sample does not include individuals who are homeless but live in an area not within a<br />
Continuum of Care, or individuals who live in a CoC community but do not use an<br />
emergency shelter or transitional housing program. However, given that CoCs cover 97<br />
percent of the U.S. population, including all areas thought to face a high rate of<br />
homelessness, few homeless persons are likely to live outside CoC communities. The target<br />
population also excludes CoCs in Puerto Rico and other U.S. Territories. Hence, the<br />
estimates represent the 50 states and the District of Columbia. The unsheltered homeless<br />
population—persons who live on the streets or other places not meant for human<br />
habitation—is not represented by the HMIS <strong>data</strong> in the sample if such persons do not use an<br />
emergency shelter or transitional housing facility at any time during the one-year <strong>data</strong><br />
collection period.<br />
One caveat associated with the use of HMIS <strong>data</strong> for national reporting is that an important<br />
subset of homeless service providers is not permitted to participate fully in <strong>data</strong> collection.<br />
The 2005 Violence against Women and Department of Justice Reauthorization Act prohibits<br />
“victim service providers” 2 from entering personally identifying information into an HMIS.<br />
Even though CoCs were required to include these programs as part of their housing inventory<br />
in their funding application, we excluded their beds from our extrapolations; thus, the<br />
national estimate of the sheltered homeless population does not include persons using<br />
residential “victim service” providers.<br />
2<br />
The term victim service provider is defined as “a nonprofit, nongovernmental organization, including rape<br />
crisis centers, battered women’s shelters, domestic violence transitional housing programs, and other<br />
programs whose primary mission is to provide services to victims of domestic violence, dating violence,<br />
sexual assault, or stalking” (72 FR 5056, March 16, 2007).<br />
Appendix B B-3
Homeless Management Information System Data<br />
The information on homeless persons in the AHAR sample is based on HMIS <strong>data</strong> collected<br />
by local homeless assistance providers. HMIS are computerized <strong>data</strong> collection applications<br />
operated by CoCs that store <strong>data</strong> on homeless individuals and families who use homelessness<br />
assistance services.<br />
HMIS <strong>data</strong> have some important features. First, they have been standardized nationally in<br />
accordance with HUD’s National HMIS Data and Technical Standards Notice (Data Standards). 3<br />
All HUD McKinney-Vento–funded homeless programs are required to collect 14 universal <strong>data</strong><br />
elements from every client served. 4 The Data Standards define each <strong>data</strong> element. The universal<br />
<strong>data</strong> elements include information on a client’s demographic characteristics (e.g., date of birth,<br />
ethnicity and race, gender, veteran status, and disability status) and recent residential history (e.g.,<br />
residence before program entry, program entry and exit dates, and zip code of last permanent<br />
address). The <strong>data</strong> are essential to obtaining an accurate picture of the extent, characteristics, and<br />
patterns of service use of the local homeless population.<br />
Second, HMIS <strong>data</strong> include personally identifying information that allows local communities to<br />
produce an accurate de-duplicated count of homeless persons in their communities, including a<br />
client’s full name, date of birth and Social Security Number. The personally identifying<br />
information may be used in combination with other client-level information to calculate the<br />
number of unique users of homeless services and to identify persons who use several types of<br />
services.<br />
Third, HMIS <strong>data</strong> may be manipulated to produce a more comprehensive picture of homelessness<br />
when compared to older <strong>data</strong> collection systems (e.g., paper records). Given that the <strong>data</strong> are<br />
stored electronically in sophisticated software applications, <strong>data</strong> users may produce crosstabulations<br />
and other outputs that were impractical or impossible before the advent of HMIS. As<br />
a result, HMIS <strong>data</strong> offer new opportunities to study the nature and extent of homelessness.<br />
AHAR Reporting Categories<br />
To facilitate the AHAR reporting process, the AHAR research team developed five reporting<br />
categories that are used to collect information from participating communities. All of the<br />
information required in the reporting categories is based on the universal <strong>data</strong> elements<br />
specified in the HMIS Data Standards. The five reporting categories are:<br />
1. Individuals served by emergency shelters (ES-IND)<br />
3<br />
4<br />
69 FR 45888, July 30, 2004.<br />
Two of the universal <strong>data</strong> elements (Veterans Status and Disabling Condition) are asked of adults only; two<br />
other <strong>data</strong> elements (Residence Prior to Program Entry and Zip Code of Last Permanent Address) are asked<br />
of adults and unaccompanied youth only.<br />
B-4 Appendix B
2. Individuals served by transitional housing facilities (TH-IND)<br />
3. Families served by emergency shelters (ES-FAM)<br />
4. Families served by transitional housing facilities (TH-FAM)<br />
5. A summary table<br />
Reporting categories 1 through 4 contain several sections. The first section is an extrapolation<br />
worksheet for estimating the total number of individuals or persons in families that used an<br />
emergency shelter or transitional housing facility during the <strong>data</strong> collection period. This<br />
section guides the community through a process for estimating the number of individuals or<br />
persons in families served by providers participating in HMIS as well as by nonparticipating<br />
providers. A limited amount of <strong>data</strong> from the HMIS and communities’ bed inventory is<br />
required to complete the extrapolation. The remaining sections in each set of reporting<br />
categories are designed to capture information about the homeless population in the<br />
community. Each set of reporting categories is designed with embedded codes to check for<br />
<strong>data</strong> errors, such as missing values or inconsistent information. A summary sheet of <strong>data</strong> errors<br />
is automatically generated as communities complete the reporting categories, prompting<br />
communities to review and correct any errors.<br />
The final set of reporting categories —the summary tables—is designed to save time and<br />
increase <strong>data</strong> accuracy. The tables provide estimates of the total unduplicated count of<br />
persons who used a participating and nonparticipating emergency shelter or transitional<br />
housing program in each jurisdiction during the <strong>data</strong> collection period. The summary tables<br />
also show estimates of the demographic characteristics of the service-using population,<br />
patterns of program use, and the average daily utilization rate among persons accessing<br />
shelters and transitional housing. The summary tables automate many calculations and are<br />
designed with embedded <strong>data</strong> quality checks that list error messages when inconsistent<br />
information is entered.<br />
The <strong>data</strong> submission process is channeled through the AHAR Exchange, a web-based <strong>data</strong><br />
collection instrument designed specifically for the AHAR. Communities login to the AHAR<br />
Exchange using a unique username and password and submit the <strong>data</strong> by either typing the<br />
aggregate <strong>data</strong> into each reporting category or by uploading all their <strong>data</strong> via an XML<br />
schema into the appropriate reporting category. Each community is assigned a <strong>data</strong> quality<br />
reviewer (a member of the research team) who reviews each submission and works<br />
collaboratively with representatives from the community to fix any <strong>data</strong> quality issues. A<br />
public version of the AHAR Exchange is available for viewing and local use:<br />
http://sandbox.hmis.info/.<br />
Appendix B B-5
B.3 Sample Selection<br />
This section describes the procedures for selecting a nationally representative sample of 102<br />
jurisdictions for the AHAR. 5<br />
CDBG Jurisdictions Are the Primary Sampling Units<br />
The AHAR uses the geographic areas defined for the allocation of CDBG funds as the<br />
primary sampling unit. The four types of CDBG jurisdictions are:<br />
Principal cities 6<br />
<br />
<br />
<br />
Cities with 50,000 or more persons (that are not principal cities)<br />
Urban counties<br />
Rural areas or non-entitlement jurisdictions<br />
CDBG jurisdictions constitute the basic building blocks of CoCs. In some cases, the CDBG<br />
jurisdiction and the CoC represent the same geographic area (e.g., principal cities are often a<br />
single CoC), but, in other situations, the CDBG jurisdiction is a geographic subunit of the<br />
CoC (e.g., a small city with 50,000 or more persons may be a subunit of a countywide CoC).<br />
The selection of 102 CDBG jurisdictions ensures the inclusion of a wide range of sites in the<br />
AHAR as well as the reasonably precise measurement of the characteristics of homeless<br />
persons and their patterns of service use.<br />
The U.S. Department of <strong>Housing</strong> and Urban Development provided a sampling frame for the<br />
selection of CDBG jurisdictions. The sampling frame is a list of all 3,142 CDBG<br />
5<br />
6<br />
The initial AHAR sample consisted of 80 jurisdictions. Some jurisdictions from the original sample—<br />
especially jurisdictions representing rural areas—were unable to provide <strong>data</strong> to the AHAR because of<br />
HMIS implementation issues or other <strong>data</strong> quality concerns. In addition, several of the rural sample sites<br />
did not have any homeless residential service providers located in their jurisdiction. As a result, we were<br />
unable to report <strong>data</strong> by geography. In an effort to improve the scope and quality of <strong>data</strong> from rural<br />
jurisdictions, 22 additional rural jurisdictions were added to the AHAR sample. Thus, there are now 102<br />
AHAR sample sites.<br />
The original file from which the sample was selected used the category of “central city” for CDBG<br />
jurisdictions rather than “principal city.” However, the CDBG program moved to designation of principal<br />
city rather than central city following the OMB guidance, and the definition of central city and principal<br />
city are slightly different (see 24 CFR Part 570). Of the 482 CDBG central city jurisdictions that existed<br />
both before and after the definition change, 327 central city jurisdictions (68%) became principle cities<br />
with the definition change. A small number of non-central cities (85 out of 2,501) in the original file were<br />
categorized as principal cities in the 2007 CDBG file. In our analysis by CDBG jurisdiction and in<br />
procedures for adjusting the sampling weights, we used the community’s current CDBG jurisdiction to<br />
ensure that our results accurately represented the current system for designating CDBG jurisdictions.<br />
B-6 Appendix B
jurisdictions within the 430 CoCs in the 50 states as of 2002. 7 The next section describes the<br />
decision to stratify the sites based on geographic type, along with the procedures for selecting<br />
certainty and non-certainty sites.<br />
Stratifying the Sample by Type of Geographic Area<br />
A CDBG jurisdiction may be a large principal city of a metropolitan area, a smaller city with a<br />
population of 50,000 or more, one or more suburban or urban fringe counties, or a rural area. As<br />
such, the number of homeless persons in each jurisdiction varies considerably.<br />
Using the relative size of the homeless population in each CDBG jurisdiction to select a sample<br />
may increase the precision of the estimates for any particular sample size. However, with the<br />
number of homeless persons in each CDBG jurisdiction unknown, the study team assumed that<br />
the total population in each CDBG jurisdiction provided a measure of relative size of the<br />
homeless population for purposes of sample selection. The study team premised the assumption<br />
on the likelihood that the number of homeless persons is correlated with the total population in<br />
the area served by the CDBG jurisdiction. The team further refined the assumption by dividing<br />
the sample into strata based on the expected rate of homelessness. 8<br />
Earlier research on homelessness indicates that the rate of homelessness varies by type of<br />
geographic area. For example, Burt (2001) found that 71 percent of the homeless persons<br />
using homeless-related services are located in principal cities but that only 30 percent of the<br />
total U.S. population lives in principal cities. 9 By contrast, rural areas account for 9 percent of<br />
the homeless population, but 20 percent of the overall population. Further, suburban/urban<br />
fringe areas represent 21 percent of homeless persons, but 50 percent of the overall population.<br />
These findings suggest that, before using the total population as a proxy for the relative size of<br />
the homeless population, the CDBG jurisdictions should be stratified by type of geographic<br />
7<br />
8<br />
9<br />
HUD provided a file called “COC_GeoAreasInfo.xls” with a list of 3,219 CDBG jurisdictions, jurisdiction<br />
type, and population of each jurisdiction. Geographic areas in the U.S Territories and Puerto Rico and<br />
three duplicate records were eliminated, resulting in a sampling frame of 3,142 CDBG jurisdictions. In<br />
addition, four CDBG areas in Massachusetts and one in New Hampshire included overlapping geographic<br />
areas and double-counted the population; therefore, the population was evenly divided across the<br />
overlapping CDBG jurisdictions before sampling.<br />
Sampling based on the expected rate of homelessness is an attempt to obtain more precise estimates than<br />
those yielded by a simple random sample. If the proxy for the expected rate of homelessness is not<br />
correlated with the actual rate of homelessness, the resulting estimates will still be unbiased; however, the<br />
extra precision gains go unrealized.<br />
Burt, Martha. 2001. Homeless Families, Singles, and Others: Findings from the 1996 National Survey of<br />
Homeless Assistance Providers and Clients. <strong>Housing</strong> Policy Debate, V12 (4), 737-780. This report presents the<br />
share of the homeless population by urban/rural status. The share of the population in each type of geographic<br />
area comes from the author’s calculations based on March 1996 Current Population Survey <strong>data</strong>. The results<br />
from the Burt study were based on central cities rather than principal cities, but we refer to them as principal<br />
cities here because of the high degree of overlap and to make the discussion easier to follow.<br />
Appendix B B-7
area to account for the fact that the ratio of homeless persons to the population varies across<br />
geographic areas. Hence, the study team divided the CDBG jurisdictions into four groups<br />
based on their classification for the allocation of CDBG funds: principal cities, other cities<br />
larger than 50,000, urban counties, and rural areas (i.e., counties that are part of nonentitlement<br />
areas). Such stratification increases the precision of estimates.<br />
Very Large CDBG Jurisdictions Selected with Certainty<br />
Given that the size of the population across CDBG jurisdictions is skewed by a few very<br />
large jurisdictions covering areas with several million residents, a useful strategy for<br />
reducing sampling variability in the estimated number and characteristics of homeless<br />
persons is to select very large jurisdictions in the sample with certainty. Selecting a CDBG<br />
jurisdiction with certainty means that the CDBG jurisdiction represents only itself in the<br />
sample estimates but ensures that the sample does not exclude the largest jurisdictions, whose<br />
number and characteristics of the homeless population could substantially affect national<br />
estimates. Exhibit B-1 lists the 18 CDBG jurisdictions selected with certainty.<br />
For selecting the certainty sites, the study team divided the CDBG jurisdictions into the four<br />
geographic-type strata. Assuming the rate of homelessness was the same in each area within each<br />
stratum, the study team calculated the standard deviation (square root of the variance) of the number<br />
of homeless persons for the entire stratum. The team then recalculated the standard deviation by<br />
excluding the largest site (as if that site were taken with certainty) to obtain a relative estimate of the<br />
reduction in the variance of the estimates that would occur if that site were selected with certainty.<br />
In the event of substantial reduction in the variance due to the selection of the certainty unit, the<br />
overall variance of the sample estimates will be smaller as the variance contribution to the estimate<br />
from the certainty sites is zero. The process of selecting the next-largest site as a certainty site<br />
continued until the reduction of the variance or standard deviation was small or marginal. The<br />
process resulted in the identification of 11 certainty sites consisting of eight principal cities, one<br />
other city larger than 50,000, and two urban counties (but no non-entitlement areas).<br />
Based on earlier research findings showing that homeless persons are disproportionately<br />
located in principal cities, the study team identified 7 additional principal cities as certainty<br />
sites, for a total of 15 principal cities in the certainty sample (and 18 certainty sites in total).<br />
The team selected the 7 additional principal cities with certainty because the cities had<br />
among the largest populations of persons living in emergency and transitional shelters in the<br />
1990 and 2000 Census counts. 10 All 7 certainty sites had one of the 10 largest counts in<br />
10<br />
For 1990 counts, see U.S. Department of <strong>Housing</strong> and Urban Development. “Allocating Homeless<br />
Assistance by Formula.” A Report to Congress, 1992. For 2000 counts, see U.S. Census Bureau.<br />
“Emergency and Transitional Shelter Population: 2000.” A Census 2000 Special Report.<br />
B-8 Appendix B
either 1990 or 2000. 11 Given that so many homeless persons live in these cities, it is<br />
important to include them with certainty in a nationally representative sample.<br />
Exhibit B-1: Geographic Characteristics and Population of 18 Certainty Sites<br />
Geographic Area<br />
Type of<br />
CDBG Entity<br />
Size of<br />
Housed<br />
Population<br />
Census<br />
Region<br />
CoC Name<br />
1 NEW YORK CITY Principal City 8,008,278 Northeast New York City<br />
<strong>Coalition</strong>/CoC<br />
2 LOS ANGELES Principal City 3,694,820 West County of Los Angeles, CA<br />
3 CHICAGO Principal City 2,896,016 Midwest Chicago CoC<br />
4 HOUSTON Principal City 1,953,631 South Houston/Harris County<br />
5 PHILADELPHIA Principal City 1,517,550 Northeast City of Philadelphia<br />
6 PHOENIX Principal City 1,321,045 West Maricopa CoC<br />
7 SAN DIEGO Principal City 1,223,400 West City of San Diego<br />
Consortium<br />
8 DALLAS Principal City 1,188,580 South Dallas Homeless CoC<br />
9 DETROIT Principal City 951,270 Midwest City of Detroit CoC<br />
10 SAN FRANCISCO Principal City 776733 West City and County of San<br />
Francisco<br />
11 BOSTON Principal City 589,141 Northeast City of Boston<br />
12 WASHINGTON,<br />
DC<br />
Principal City 572,059 South District of Columbia<br />
Homeless Services<br />
13 SEATTLE Principal City 563,374 West Seattle-King County CoC<br />
14 CLEVELAND Principal City 478,403 Midwest Cuyahoga<br />
County/Cleveland CoC<br />
15 ATLANTA Principal City 416,474 South Atlanta Tri- Jurisdictional<br />
16 LOS ANGELES<br />
COUNTY<br />
Urban County 2,205,851 West County of Los Angeles, CA<br />
17 COOK COUNTY Urban County 1,712,784 Midwest Cook County CoC<br />
18 ISLIP TOWN City >50,000 322,612 Northeast Suffolk County CoC Group<br />
11<br />
The other 8 certainty sites in principal cities were all ranked in the top 15 in the 1990 or 2000 Census<br />
counts.<br />
Appendix B B-9
Selection of Non-Certainty Sample<br />
The selection of the non-certainty sites occurred in two phases. Phase one was completed in 2005<br />
and included 62 non-certainty sites. The 62 non-certainty sites and the 18 certainty sites (80 total<br />
sample sites) constituted the original sample for the 2005, 2006, and 2007 AHARs. Phase 2 was<br />
completed for the 2008 AHAR and added 22 non-certainty sites to the original sample.<br />
Phase 1: Selecting 62 Non-Certainty Sites. To select the 62 non-certainty sites for the original<br />
sample, the study team divided the 3,124 CDBG jurisdictions into 16 strata based on the four<br />
types of geographic areas and Census regions. As discussed earlier, the team divided the sample<br />
into strata based on the type of geographic area because earlier research indicated that the rate of<br />
homelessness is higher in principal cities than in other areas. The team further divided the<br />
sample into Census regions because business cycles might affect regions differently and result in<br />
variation in rates of and trends in homelessness across regions. Dividing the sample into strata<br />
that are more similar in terms of the rate of homelessness and the characteristics of homeless<br />
persons than the overall population reduces the variance of the sample estimates for a particular<br />
sample size. Stratified sampling also eliminates the possibility of some undesirable samples. For<br />
example, with a simple random sample, one possible sample might include sites only in rural<br />
areas or sites only in the Northeast, both of which are undesirable samples.<br />
One possibility considered for the non-certainty sample was allocation of the sample to the<br />
stratum in proportion to the population in each stratum. However, such an approach ignores<br />
the research indicating that a disproportionate share of the homeless is located in principal<br />
cites. Ignoring information on the location of the homeless population would lead to a<br />
relatively high degree of imprecision in national estimates such that 20 of the 62 noncertainty<br />
sites would be allocated to principal cities, 6 to non– principal cities, 16 to urban<br />
counties, and 20 to rural areas. The same number of rural areas as principal cities would be<br />
selected even though earlier research suggests that only 9 percent of the homeless population<br />
lives in rural areas whereas 70 percent lives in principal cities.<br />
Another possibility under consideration for the non-certainty sample was allocation of the<br />
total non-certainty sample of 62 CDBG jurisdictions to each of the 16 strata in proportion to<br />
the adjusted population in each stratum, where the adjustment accounts for different rates of<br />
homelessness across geographic areas. This allocation method produces the highest degree<br />
of precision of national estimates for a given sample size. The adjusted population is the<br />
population of persons living in an area multiplied by an adjustment factor for the expected<br />
rate of homelessness in that area. With the rate of homelessness in principal cities roughly<br />
five times that of other areas, the study team multiplied the population in principal cities by<br />
five so that the adjusted populations would reflect the relative number of homeless persons<br />
B-10 Appendix B
expected in each stratum. 12 If the adjusted population were used to allocate the non-certainty<br />
sites across the strata, 39 of the 62 original non-certainty sample sites would have been<br />
allocated to principal cities, 4 to non– principal cities, 8 to urban counties, and 11 to rural<br />
areas. While optimal for national estimates, the number of sites in the non–principal city<br />
stratum was too small for subnational estimates.<br />
The sampling allocation procedure ultimately used for AHAR <strong>data</strong> collection strikes a<br />
balance between the most precise national estimates possible with a sample of 62 noncertainty<br />
sites and reasonably sized samples from each of the four types of geographic areas.<br />
The study team allocated the 62 original non-certainty sample sites across the 16 strata based<br />
on the square root of the adjusted population. The result is a sample allocation between the<br />
allocation in proportion to the population and the allocation in proportion to the adjusted<br />
population. Accordingly, 27 of the 62 original non-certainty sites are in principal cities, 8 are<br />
in non– principal cities, 13 are in urban counties, and 14 are in rural areas. The allocation<br />
means lower variances of the estimates than either simple random sampling or sampling in<br />
direct proportion to the population and provides better representation of non– principal city<br />
areas than the allocation in proportion to the adjusted population.<br />
To select the non-certainty sites in each stratum, the study team divided the sites into groups<br />
based on size and then randomly selected one site from each group. The number of noncertainty<br />
sites allocated to each stratum determined the number of groups, and each group in<br />
a stratum contained the same number of sites. Sampling from groups based on population<br />
size is beneficial in that it ensures that the sample has a similar distribution of CDBG<br />
jurisdiction sizes as the population. Given that the size of the homeless population is<br />
expected to correlate with the total population within strata, similarity in distribution is an<br />
important feature of the sample.<br />
Phase 2: Adding 22 Rural Non-Certainty Sites. The <strong>data</strong> collection results from the 2005-<br />
2007 AHAR reports indicated that many rural communities (or non-entitlement CDBG areas)<br />
did not have emergency shelters or transitional housing programs located in these<br />
jurisdictions. Among the few rural sample sites that did have emergency shelters and/or<br />
transitional housing programs, many of those programs were not entering <strong>data</strong> into an HMIS.<br />
As a result, previous AHAR reports did not capture information from many rural<br />
jurisdictions, and the lack of <strong>data</strong> increased the variance of the AHAR estimates and made<br />
the analysis of rural/suburban versus urban homelessness less reliable.<br />
12<br />
The ratio was determined as follows. Burt (2001) found that 71 percent of the homeless population lived in<br />
central cities in 1996. At the same time, Current Population Survey <strong>data</strong> indicate that only 30 percent of<br />
the overall population lived in central cities at that time. The ratio of the share of the homeless population<br />
to the share of the overall population in central cities is 2.36. The ratio is 0.42 for non– principal city<br />
portions of Metropolitan Statistical Areas and 0.46 for rural areas. Dividing the principal city ratio by the<br />
rural ratio (2.36/0.46) equal 5.1, suggesting that the rate of homelessness is about five times higher in<br />
central cities than in rural areas.<br />
Appendix B B-11
In 2008, 22 new rural communities were added to the AHAR sample, increasing the total<br />
number of rural jurisdiction to 36 and the total number of AHAR sample sites to 102. The<br />
new AHAR sample sites were selected in the same manner as the original non-certainty<br />
sample sites. The original 2002 sampling frame of 3,142 CDBG jurisdictions within the 430<br />
CoCs in the 50 states was used to select the new rural communities. However, the original<br />
file was compared with an updated 2006 CDBG list of jurisdictions to remove from the<br />
sampling frame jurisdictions that had either merged with other jurisdictions since 2002 or<br />
had changed their status from non-entitlement (rural) areas to entitlement areas.<br />
The sample was stratified to ensure that each of the four census regions was represented. The<br />
goal was to select at least three rural communities from each census region that had at least<br />
one emergency shelter or transitional housing program. In some cases, more than three<br />
communities for a particular region were selected if inventory information reported by CoC<br />
suggested that the communities did not have any emergency shelters or transitional housing<br />
programs. That is, from each region, we randomly selected rural jurisdictions until we had at<br />
least three rural jurisdictions with at least one emergency shelter or transitional housing<br />
program. In total, 22 new rural sample sites were added; three from the Northeast region;<br />
seven from the South region; seven from the Midwest region; and five from the West region.<br />
The final AHAR sample contains 102 sample sites, and Exhibit B-2 shows the total number<br />
of certainty and non-certainty sites selected from each region-CDBG type stratum. The<br />
sample sites contain over 40 million persons, or approximately 16 percent of the population<br />
living within CoC communities and 14 percent of the U.S. population. The expectation is that<br />
the sample will contain an even higher proportion of the U.S. homeless population because the<br />
selection procedures intentionally oversampled areas with a high rate of homelessness (i.e.,<br />
principal cities). About two-fifths of the selected sites (42 sites) are principal cities, even though<br />
only one-third of the total population lives there. The other 60 sample sites were distributed<br />
across the three remaining CDBG jurisdictions: non– principal cities with a population over<br />
50,000 (9 sites), urban counties (15 sites), and nonentitlement/rural areas (36 sites). Appendix A<br />
lists all CDBG jurisdictions in the sample.<br />
B-12 Appendix B
Stratum<br />
Exhibit B-2: Number of Sites in Universe and Sample by Region-CDBG Type<br />
Number of<br />
Geographic Areas<br />
in Universe<br />
Number of<br />
Certainty Sites<br />
in Sample<br />
Number of<br />
Noncertainty<br />
Sites<br />
in Sample<br />
Total<br />
Sample<br />
Northeast Principal City 86 3 5 8<br />
South Principal City 151 4 8 12<br />
Midwest Principal City 124 3 7 10<br />
West Principal City 106 5 7 12<br />
Northeast City >50,000 81 1 2 3<br />
South City >50,000 48 0 2 2<br />
Midwest City >50,000 55 0 1 1<br />
West City >50,000 114 0 3 3<br />
Northeast Urban County 33 0 3 3<br />
South Urban County 54 0 4 4<br />
Midwest Urban County 33 1 3 4<br />
West Urban County 34 1 3 4<br />
Northeast Non-entitlement<br />
County<br />
148 0 6 6<br />
South Non-entitlement County 812 0 11 11<br />
Midwest Non-entitlement<br />
County<br />
890 0 11 11<br />
West Non-entitlement County 373 0 8 8<br />
Total 3,142 18 84 102<br />
Addition of Contributing Sites<br />
In addition to the 102 sample sites selected for the study, many other communities<br />
nationwide volunteered to provide <strong>data</strong> for the report to help produce more precise national<br />
estimates. The additional communities are entire Continuums of Care and are termed<br />
“contributing sites.” In the 2008 AHAR, 135 contributing communities provided <strong>data</strong> for use<br />
in the AHAR report. As with the sites selected with certainty, <strong>data</strong> from the contributing<br />
sites represent themselves in the national estimates. Appendix A lists the contributing<br />
communities in the 2008 AHAR.<br />
B.4 AHAR Data Cleaning<br />
This section presents the <strong>data</strong> cleaning results for the AHAR. For each AHAR sample site<br />
and contributing community, the study team reviewed each reporting category (e.g., ES-IND)<br />
for reporting irregularities, focusing on three indicators:<br />
<br />
HMIS-bed coverage rate<br />
Appendix B B-13
Average daily bed utilization rate<br />
Proportion of missing variables<br />
Bed Coverage Rate<br />
HMIS-bed coverage rate refers to the proportion of beds in a community that participate in<br />
HMIS. The HMIS-bed coverage rate is equal to the total number of HMIS-participating beds<br />
divided by the total number of beds in a community. The indicator is important because the<br />
accuracy of the extrapolation technique depends on obtaining reasonably high bed coverage<br />
rates. 13 The study team evaluated each reporting category on its own merits—that is,<br />
calculated an HMIS-bed coverage rate for ES-IND, ES-FAM, TH-IND, and TH-FAM<br />
separately—and excluded from the final AHAR analysis any reporting category with an<br />
HMIS-bed coverage rate below 50 percent.<br />
Average Daily Bed Utilization Rate<br />
Average daily bed utilization rate refers to the frequency of bed use on an average day. It is<br />
equal to the number of homeless persons who use a program on an average day during a<br />
specified period divided by the total number of year-round equivalent beds 14 in the current<br />
inventory during the same period. Utilization rates above 100 percent typically indicated<br />
missing exit dates in the HMIS; unusually low utilization rates often suggested that providers<br />
did not enter <strong>data</strong> on all clients served into HMIS. In situations where unusually high or low<br />
utilization rates could not be explained or confirmed as accurate by the community, the study<br />
team excluded from analysis all <strong>data</strong> from the reporting category.<br />
Proportion of Missing Variables<br />
Missing <strong>data</strong> limit the ability to present a complete picture of homelessness. Exhibit B-3<br />
presents the proportion of missing values for the weighted 2008 AHAR <strong>data</strong>. The <strong>data</strong><br />
element most constrained by missing values was disability status, which was missing for 22<br />
percent of adult clients. Though still a high rate, 2008’s rate of missing disability status is<br />
13<br />
14<br />
Before releasing the AHAR reporting requirements, the study team tested the extrapolation procedures with<br />
<strong>data</strong> from Philadelphia and Massachusetts under a variety of coverage rate assumptions, taking a random<br />
sample of providers (to match 50, 75, and 90 percent HMIS bed-coverage rates) and comparing the<br />
extrapolated estimates to the true population counts for these jurisdictions. The findings show that<br />
extrapolation estimates were accurate for HMIS bed-coverage rates above 50 percent and were more<br />
precise with higher coverage rates. The threshold of an HMIS bed-coverage rate of 50 percent was as<br />
representative as possible of a set of participating sample sites. (See 2004 National HMIS Conference<br />
Breakout Session Materials “Extrapolation Methods” for more information on the extrapolation testing,<br />
available at www.hmis.info.)<br />
A year-round equivalent bed counts seasonal beds as partial beds in direct proportion to the length of the<br />
covered period for which the provider makes the bed available. For example, a bed from a provider with a<br />
seasonal bed open in January, February, and March would count as one-fourth of a bed if the covered<br />
period were 12 months.<br />
B-14 Appendix B
considerably lower than the missing disability rate in the 2007 AHAR (32.4 percent). The<br />
missing <strong>data</strong> rates for veteran status (7.5 percent) and ethnicity (3.4 percent) were less than<br />
half the rate in earlier AHARs. Missing rates have also declined for most other <strong>data</strong> elements<br />
but still remain high for <strong>data</strong> that communities were not required to collect before release of<br />
HUD’s Data Standards: living arrangement before program entry (21.3 percent), length of<br />
stay in earlier living arrangement (28.9 percent), and ZIP code of last permanent address<br />
(27.1 percent).<br />
Exhibit B-3: Proportion of Missing Values across All AHAR Reporting Categories<br />
weighted <strong>data</strong>), 2008<br />
Variable<br />
Percentage<br />
Missing<br />
Variable<br />
Percentage<br />
Missing<br />
1. Gender of adults 0.3 8. Disability status 22.0<br />
2. Gender of children 0.4 9. Household type 0.5<br />
3. Ethnicity 3.4 10. Living arrangement before program entry 21.3<br />
4. Race 7.7 11. Length of stay in earlier living arrangement 28.9<br />
5. Age 1.0 12. ZIP code of last permanent address 27.1<br />
6. Household size 0.5 13. Number of nights in program (adult males) 3.2<br />
7. Veteran status 7.5 14. Number of nights in program (adult females) 2.3<br />
The study team did not exclude reporting categories from the AHAR analysis file because of<br />
missing <strong>data</strong>. Instead, the estimates are based on non-missing <strong>data</strong>, and the team has marked<br />
estimates in the AHAR report based on <strong>data</strong> elements with missing rates over 20 percent.<br />
Based on the <strong>data</strong>-quality indicators, the study team classified all sample sites and the<br />
contributing communities into five categories describing the usability of their AHAR <strong>data</strong>.<br />
Exhibit B-4 summarizes the findings. Overall, 222 communities participated in the AHAR,<br />
including 87 sample sites and 135 contributing communities. Overall, 80 communities (33<br />
sample sites and 47 contributing communities) provided usable <strong>data</strong> across all four reporting<br />
categories; 113 communities (25 sample sites and 88 contributing communities) submitted<br />
usable <strong>data</strong> for only some of their reporting categories; and 29 had no emergency shelter or<br />
transitional housing providers located within the sample site. 15<br />
15<br />
These sites still contribute to the national count of homelessness because they represent other communities<br />
with no providers.<br />
Appendix B B-15
Exhibit B-4: Communities Participating in the 2008 AHAR by Participation Status<br />
Status<br />
Participating in the AHAR<br />
Total<br />
Percentage<br />
Number<br />
Number of<br />
Sample Sites<br />
Number of<br />
Contributing<br />
Communities<br />
All table shells 20 80 33 47<br />
Partial table shells 28 113 25 88<br />
Complete Zero Providers 7 29 29 -<br />
Subtotal 55 222 87 135<br />
Not Participating in the AHAR<br />
Submitted unusable <strong>data</strong> 6 24 5 19<br />
No <strong>data</strong> submitted 39 155 10 145<br />
Subtotal 45 179 15 164<br />
Total 100 401 102 299<br />
In total, 15 of the 102 sample sites (15 percent) were unable to participate in the AHAR, in<br />
most cases because implementation issues prevented the site from producing information<br />
from their HMIS. A few of the sites were far enough along to submit <strong>data</strong> but were still<br />
working through implementation problems or had recently made major changes to their<br />
system that raised questions about the <strong>data</strong> quality. The study team judged <strong>data</strong> to be<br />
unusable if the bed coverage rate was below 50 percent; if the bed utilization rates were<br />
unreasonably high/low and could not be properly explained; if the community contact<br />
expressed concern over <strong>data</strong> accuracy; or if the other quality control procedures raised issues<br />
that site staff could not rectify.<br />
More than twice as many contributing communities (from 98 to 222) provided <strong>data</strong> for this<br />
report than for the previous AHAR report, an increase of 127 percent. Moreover, the number<br />
of usable reporting categories increased from 233 in the 2007 AHAR to 507 in the 2008<br />
AHAR. (Exhibit B-5 shows the number of usable reporting categories for the 2008 AHAR.)<br />
In total, there were 427,201 person-records reported across the AHAR reporting categories<br />
and used to generate the national estimates.<br />
Exhibit B-5: Number of Communities Providing Data by Reporting Category, 2008<br />
Program-Household Type Total Sample Sites<br />
Contributing<br />
Communities<br />
Emergency shelters for individuals 113 32 81<br />
Transitional housing for individuals 122 35 87<br />
Emergency shelters for families 121 39 82<br />
Transitional housing for families 151 47 104<br />
Total 507 153 354<br />
Note: The tallies include only the reporting categories where the site has providers in a given category and provides usable<br />
<strong>data</strong>. The table does not include the 29 complete zero provider sites.<br />
B-16 Appendix B
B.5 AHAR Weighting and Analysis Procedures<br />
This section describes the process of obtaining national estimates from the raw HMIS <strong>data</strong><br />
submitted by participating communities. The estimates of the number and characteristics of<br />
the homeless population using homelessness services are based on weighted <strong>data</strong>. The study<br />
team designed the sampling weights to produce nationally representative estimates from the<br />
sites that provided <strong>data</strong>. The steps for obtaining the final estimate are listed here and<br />
described in more detail below.<br />
<br />
<br />
<br />
<br />
<br />
<br />
<br />
<br />
Step 1: Staff from the AHAR sample sites filled out reporting categories with<br />
information (raw <strong>data</strong>) from emergency shelters and transitional housing providers<br />
that had entered <strong>data</strong> into their local HMIS.<br />
Step 2: The raw <strong>data</strong> were adjusted by reporting category within each site to account<br />
for providers that did not participate in the site’s HMIS.<br />
Step 3: Base sampling weights were developed for all selected sites based on the<br />
assumption that 100 percent of the AHAR sample sites provided information.<br />
Step 4: Base sampling weights were adjusted to account for contributing sites.<br />
Step 5: Weights were adjusted for nonresponse to determine the preliminary analysis<br />
weights.<br />
Step 6: Based on national totals of emergency and transitional housing beds, a poststratification<br />
adjustment was made to arrive at the final analysis weights.<br />
Step 7: A final adjustment factor was derived to account for people who used more<br />
than one type of homeless service provider.<br />
Step 8: National estimates were calculated by using the final weight (Step 6) and the<br />
final adjustment factor (Step 7).<br />
Step 1:<br />
Staff from AHAR sites filled out reporting categories with information from emergency<br />
shelters and transitional housing providers that had entered <strong>data</strong> into their local HMIS.<br />
Participating communities logged into the AHAR Exchange—the web-based <strong>data</strong> collection<br />
tool designed for the AHAR—and entered the information (raw <strong>data</strong>) on the number of<br />
homeless persons, their characteristics, and their patterns of service use. The information<br />
was reported separately for each reporting category: individuals using emergency shelters<br />
(ES-IND); persons in families using emergency shelters (ES-FAM); individuals using<br />
transitional housing (TH-IND); and persons in families using transitional housing (TH-<br />
FAM). The information was then aggregated into a fifth set of tables, the summary tables, to<br />
provide total cross-program estimates for the site. A public version of the AHAR Exchange<br />
is available for viewing and local use: http://sandbox.hmis.info/.<br />
Appendix B B-17
Step 2:<br />
The raw <strong>data</strong> were adjusted by reporting category within each site to account for<br />
providers that did not participate in the site’s HMIS.<br />
Where participation in the HMIS was less than 100 percent, the raw <strong>data</strong> at each site were<br />
upwardly adjusted to account for nonparticipating providers (i.e., providers that did not<br />
submit <strong>data</strong> to HMIS). This adjustment, or extrapolation, was carried out separately by<br />
reporting category within each site. The extrapolation technique assumes that<br />
nonparticipating providers serve the same number of unique persons per available bed as<br />
participating providers during the study period. It makes a small adjustment for the overlap<br />
between users of participating and nonparticipating providers. 16<br />
The post-extrapolation results for each site are estimates of the homeless population served<br />
by each reporting category and the total sheltered homeless population at all emergency<br />
shelters and transitional housing in the entire site during the study period.<br />
Step 3:<br />
Base sampling weights were developed on the assumption that 100 percent of the<br />
AHAR sample sites provided information.<br />
The study team selected the largest sites (i.e., the CDBG jurisdictions with the largest<br />
populations) with certainty. As such, each site’s base sampling weight is 1.0, meaning that<br />
each respective site’s <strong>data</strong> represent only that site. The study team divided the noncertainty<br />
sites into 16 strata based on the four Census regions (East, West, Midwest, and South) and four<br />
CDBG types (three types of entitlement communities—principal city, urban county, other city<br />
with population greater than 50,000—and one type of nonentitlement community). The base<br />
sampling weights for the noncertainty sites are the inverse of the probability of selection. For<br />
example, if 1 out of 100 sites was selected in a stratum, the base sampling weight for selected<br />
sites in that stratum would be 100 (the inverse of 1/100 = 100). Each noncertainty site in a<br />
stratum had the same chance of being selected; therefore, each has the same weight.<br />
If all the sample sites provided full AHAR <strong>data</strong> (in the absence of contributing sites), national<br />
estimates of the homeless population would be calculated by multiplying each site’s base<br />
sampling weight by the extrapolated number of persons with each characteristic at the site<br />
and then aggregating across sites.<br />
Step 4:<br />
Base sample weights were adjusted to account for contributing sites.<br />
One hundred and thirty-five communities volunteered to provide their HMIS-based <strong>data</strong> for<br />
the 2008 AHAR. The <strong>data</strong> from these communities—or contributing communities—increase<br />
the reliability of the AHAR estimates. The 135 CoCs that are contributing communities<br />
16<br />
Given that <strong>data</strong> from nonparticipating providers were not available, it is impossible to verify this<br />
assumption. However, it is the most reasonable assumption in that it is accurate when nonparticipating<br />
providers are missing at random or at least not systematically missing in a way correlated with the number<br />
of people they serve per available bed.<br />
B-18 Appendix B
epresent 725 CDBG jurisdictions. 17 The study team treated all of these sites as certainty<br />
sites and assigned them a weight of 1.0 such that each site would represent only itself in the<br />
national estimates. The study team adjusted the base sampling weights of the noncertainty<br />
sites downward to represent only the noncontributing sites in their respective stratum. For<br />
example, assume that there were two sample sites in a stratum and that both originally had a<br />
base weight of 100. If the contributing sites represented 10 CDBG jurisdictions in that<br />
stratum, the sample weight for each sample site would be downwardly adjusted to 95. In<br />
other words, the two sample sites originally represented 200 sites in their stratum, but, with<br />
the contributing sites now representing 10 of those 200 sites, the sample site needs to<br />
represent 190 sites. The addition of the contributing sites did not affect the base sampling<br />
weights of the certainty sites.<br />
If all the sample sites and contributing sites provided full AHAR <strong>data</strong>, the study team would<br />
calculate national estimates of the homeless population by multiplying each site’s base<br />
weight by the extrapolated number of persons with each characteristic at the site and then<br />
aggregating across sites.<br />
Step 5:<br />
The base weights were adjusted for nonresponse to derive the preliminary analysis<br />
weights.<br />
The above base weights assume that all the sample and contributing sites provided <strong>data</strong> for<br />
all four reporting categories except for those for which they have no providers in their<br />
jurisdiction. Unfortunately, 15 sample sites were not able to provide any usable <strong>data</strong>, and 25<br />
other sample sites were unable to provide <strong>data</strong> for all their reporting categories (i.e., they<br />
provided partial <strong>data</strong>). Eighty-eight contributing sites also provided only partial <strong>data</strong>. In<br />
addition, 29 sample sites had no providers (i.e., no emergency shelters or transitional housing<br />
programs). The ‘zero provider sites’ are part of the estimate (because they represent<br />
themselves and all nonsample zero provider sites in the population) but need to be treated<br />
differently from the other sites. Once the study team confirmed that the site had no<br />
providers, it needed no further information. Given that the zero provider sites did not have<br />
any information for the AHAR reporting categories, none of them was a nonrespondent.<br />
Recognizing that some participating sites provided only partial <strong>data</strong> (i.e., <strong>data</strong> on some but<br />
not all of their reporting categories) and that the <strong>data</strong> proved useful for the AHAR report, the<br />
study team carried out the nonresponse adjustment to the weights separately for each of the<br />
four reporting categories. That is, each site contributing <strong>data</strong> to the AHAR has four analytic<br />
weights—one for each reporting category. However, for any reporting category for which a<br />
17<br />
The AHAR sample consists of CDBG jurisdictions that are either the same as the CoC or part of the area<br />
covered by the COC. CDBG jurisdictions are the building blocks of the CoC. The contributing sites<br />
volunteered as CoCs. For example, the Iowa State COC represents 104 CDBG jurisdictions: 96<br />
nonentitlement communities and 8 principal cities. Most other contributing sites represent between 1 and 7<br />
CDBG jurisdictions.<br />
Appendix B B-19
site was not able to provide <strong>data</strong>, the analytic weight is zero. The respondent sites for that<br />
reporting category represent the site. (Step 8 describes the procedure for aggregating across<br />
reporting categories to arrive at national estimates.)<br />
Below is a description of how the weight for each type of site was adjusted for nonresponse<br />
to derive the final analysis weights.<br />
a) The weights of the contributing sites did not change; each contributing site continued<br />
to represent itself with an analytic weight of 1.0 for each program-household type for<br />
which it provided <strong>data</strong>.<br />
b) The weights of the no-provider sites did not change. Their weight remained the base<br />
weight calculated in Step 4 because all zero provider sites in the sample are<br />
considered respondents. In essence, the no-provider sites produced a response of 100<br />
percent. Stated differently, since none of the non-response sites has no providers, the<br />
no-provider sites would not appropriately represent them.<br />
c) For the certainty sites providing <strong>data</strong>, base weights were adjusted so that the analytic<br />
weights represented all certainty sites. The adjustment was made separately for each<br />
program-household type within four weighting classes based on region: North, South,<br />
East, and Midwest. 18 The nonresponse adjustment was based on the relative number of<br />
shelter beds in the nonrespondent sites and accounts for the possibility of a high degree<br />
of size variation among certainty sites. The nonresponse adjustment formula follows:<br />
Total number of beds within a<br />
reporting category at certainty<br />
sites in region<br />
÷<br />
Number of beds within reporting<br />
category at respondent certainty<br />
sites in region<br />
For example, assume that six of the seven certainty sites in the West provided TH-<br />
IND <strong>data</strong> and that one site did not. If the nonrespondent certainty site had 1,000 TH-<br />
IND beds and the six participating certainty sites had 5,000 beds, the weight of the<br />
six participating certainty sites would be multiplied by 6/5 (6,000 divided by 5,000).<br />
The adjustment assumes that the nonrespondent certainty sites would serve<br />
approximately the same number of persons per bed as the participating certainty<br />
sites. The nonresponse adjustment for certainty sites was derived separately by<br />
region based on the judgment that homeless providers in principal cities in the same<br />
region were more likely than principal cities overall to serve persons with similar<br />
characteristics.<br />
18<br />
Fifteen of the 18 certainty sites are principal cities; therefore, the nonresponse adjustment essentially occurs<br />
within CDBG type.<br />
B-20 Appendix B
d) For the noncertainty sites, the weights of the participating sites were upwardly adjusted<br />
to represent all the sites meant to be represented by the nonrespondent sample sites.<br />
The adjustment was carried out separately for each program-household type within 16<br />
weighting classes based on type of CDBG jurisdiction and region: (1) principal city, (2)<br />
city with greater than 50,000 population, (3) urban counties, and (4) and nonentitlement<br />
areas. The nonresponse adjustment was the same as that used for certainty sites--the<br />
ratio of total number of beds in the weighting class divided by number of beds in<br />
participating sites.<br />
Step 6:<br />
A post-stratification adjustment was carried out to create final analysis weights.<br />
A post-stratification adjustment based on national totals of emergency and transitional<br />
housing beds accounted for new CDBG jurisdictions added since 2002 as well as for any<br />
differences in the average size of sample and nonsample sites. This final adjustment to the<br />
analysis weights applied only to noncertainty sample sites. The preliminary analysis weight<br />
(from Step 5) is the final analysis weight for certainty sites, no-provider sites, and<br />
contributing sites.<br />
The initial AHAR sample was drawn from the number of CDBG jurisdictions in existence in<br />
2002. Since that time, however, the number of CDBG jurisdictions has increased from 3,142<br />
to 4,115. 19 Therefore, the study team adjusted the analysis weights to account for the<br />
expansion. The increase in CDBG jurisdictions was not evenly distributed; most of the<br />
growth occurred in the South, particularly in the rural South. Thus, we adjusted the weights<br />
separately for each of the 16 strata. The adjustment factor was the ratio of total number of<br />
beds in the strata in 2008 (after excluding beds from certainty and contributing communities)<br />
to the weighted number of beds in the noncertainty sample sites in the strata providing usable<br />
<strong>data</strong>. 20 The number of beds for the adjustment was based on the housing inventory chart<br />
submitted as part of the 2008 CoC application.<br />
The adjustment both corrected for the difference in the number of CDBG jurisdictions in<br />
CoCs between 2002 and 2008 and adjusted for any differences in the number of beds per<br />
CDBG sample site and CDBG nonsample site in the same stratum.<br />
The Step 6 weights are the final analysis weights for use with the sample and <strong>data</strong> provided<br />
to produce separate national estimates of the homeless population for each reporting<br />
19<br />
20<br />
The 4,115 CDBG jurisdictions also include nonfunded CDBG jurisdictions not part of the original<br />
sampling frame.<br />
Several hundred beds on the 2008 CoC application (less than 1 percent of all beds) did not match a known<br />
geocode, making unclear the CDBG jurisdiction in which the beds were located--even after manual review.<br />
We assigned the beds to CDBG type within each region in the same proportion as the beds with valid<br />
geocodes.<br />
Appendix B B-21
category. However, to aggregate the <strong>data</strong> across reporting categories, a further adjustment is<br />
needed to account for persons who used more than one program type during the study period.<br />
Step 7:<br />
Final adjustment factor was derived to account for users of several program types.<br />
To calculate national estimates that require <strong>data</strong> aggregation across the four reporting c<br />
categories, an adjustment is needed for persons who used more than one program-household<br />
type during the study period. That is, if a person used an emergency shelter for individuals<br />
and then a transitional housing program for individuals, the person will appear in more than<br />
one set of reporting categories for the study period; aggregation of the numbers from the four<br />
reporting categories would double count that person. The needed adjustment is the same type<br />
of adjustment embedded in the AHAR summary table for sites providing <strong>data</strong> on all four<br />
reporting categories. For the 80 participating sites (33 sample sites and 47 contributing<br />
communities) providing <strong>data</strong> on all four reporting categories, the adjustment factor was the<br />
actual adjustment factor calculated from how much overlap the sites reported with their<br />
HMIS <strong>data</strong>. However, for the 113 participating sites that provided only partial <strong>data</strong>, it was<br />
not possible to calculate the overlap adjustment factor from their <strong>data</strong>. Instead, for all partial<br />
reporting sites, the study team used the average overlap adjustment factor from the 80 sites<br />
providing full <strong>data</strong>. Thus, for partial reporting sites, the overlap adjustment factor was<br />
assumed to be 0.9622.<br />
The overlap adjustment factor was calculated as follows:<br />
Total unduplicated number of persons<br />
served at the full-reporting sites<br />
÷<br />
Total number of persons served at the fullreporting<br />
sites before accounting for persons<br />
served by more than one program-household type<br />
Step 8:<br />
Calculate national estimates.<br />
To calculate national estimates, the study team first calculated the total number of persons<br />
with each characteristic within each of the four reporting categories. Then, within each<br />
reporting category, the team multiplied the final analysis weight (from Step 7) for each site by<br />
the number of persons with that characteristic in that site’s reporting category. Next, the team<br />
summed the number of persons in each site across sites to arrive at the estimated number of<br />
persons with that characteristic who were served in that reporting category. For estimates of<br />
the number of persons served by all four reporting categories, the team summed totals across<br />
the four reporting categories and then multiplied by the adjustment factor from Step 7.<br />
Percentage calculations followed the same procedures by calculating both the numerator and<br />
denominator of the desired percentage.<br />
B-22 Appendix B
Appendix C: Continuum of Care Point-in-Time<br />
Counts of Homeless Persons<br />
Appendix C C-1
C1: Changes in Point-In-Time Estimates of Homeless Population by State, 2007-2008<br />
2008 Total<br />
Homeless<br />
Population<br />
2007 Total<br />
Homeless<br />
Population<br />
2008-2007 Total<br />
State<br />
Change<br />
Alabama 5,387 5,452 -65 -1.19%<br />
Alaska 1,646 1,642 4 0.24%<br />
Arizona 12,488 14,646 -2,158 -14.73%<br />
Arkansas 3,255 3,836 -581 -15.15%<br />
California 157,277 159,732 -2,455 -1.54%<br />
Colorado 14,747 14,225 522 3.67%<br />
Connecticut 4,627 4,482 145 3.24%<br />
Delaware 933 1,061 -128 -12.06%<br />
District of Columbia 6,044 5,320 724 13.61%<br />
Florida 50,158 48,069 2,089 4.35%<br />
Georgia 19,095 19,639 -544 -2.77%<br />
Guam 725 725 0 0.00%<br />
Hawaii 6,061 6,070 -9 -0.15%<br />
Idaho 1,464 1,749 -285 -16.30%<br />
Illinois 14,724 15,487 -763 -4.93%<br />
Indiana 7,395 7,358 37 0.50%<br />
Iowa 3,346 2,734 612 22.38%<br />
Kansas 1,738 2,111 -373 -17.67%<br />
Kentucky 8,137 8,061 76 0.94%<br />
Louisiana 5,481 5,494 -13 -0.24%<br />
Maine 2,632 2,638 -6 -0.23%<br />
Maryland 9,219 9,628 -409 -4.25%<br />
Massachusetts 14,506 15,127 -621 -4.11%<br />
Michigan 28,248 28,295 -47 -0.17%<br />
Minnesota 7,644 7,323 321 4.38%<br />
Mississippi 1,961 1,377 584 42.41%<br />
Missouri 7,687 6,247 1,440 23.05%<br />
Montana 1,417 1,150 267 23.22%<br />
Nebraska 3,985 3,531 454 12.86%<br />
Nevada 12,610 12,526 84 0.67%<br />
New Hampshire 2,019 2,248 -229 -10.19%<br />
New Jersey 13,832 17,314 -3,482 -20.11%<br />
New Mexico 3,015 3,015 0 0.00%<br />
New York 61,125 62,601 -1,476 -2.36%<br />
North Carolina 12,411 11,802 609 5.16%<br />
North Dakota 615 636 -21 -3.30%<br />
Ohio 12,912 11,264 1,648 14.63%<br />
Oklahoma 3,846 4,221 -375 -8.88%<br />
Oregon 20,653 17,590 3,063 17.41%<br />
Pennsylvania 15,378 16,220 -842 -5.19%<br />
Puerto Rico 3,012 4,309 -1,297 -30.10%<br />
Rhode Island 1,196 1,372 -176 -12.83%<br />
South Carolina 5,660 5,660 0 0.00%<br />
South Dakota 579 579 0 0.00%<br />
2008-2007<br />
Percent Change<br />
C-2 Appendix C
C1: Changes in Point-In-Time Estimates of Homeless Population by State, 2007-2008<br />
2008 Total<br />
Homeless<br />
Population<br />
2007 Total<br />
Homeless<br />
Population<br />
2008-2007 Total<br />
State<br />
Change<br />
Tennessee 9,705 11,210 -1,505 -13.43%<br />
Texas 40,190 39,788 402 1.01%<br />
Utah 3,434 3,011 423 14.05%<br />
Vermont 954 1,035 -81 -7.83%<br />
Virgin Islands 602 559 43 7.69%<br />
Virginia 8,469 9,746 -1,277 -13.10%<br />
Washington 21,954 23,379 -1,425 -6.10%<br />
West Virginia 2,016 2,409 -393 -16.31%<br />
Wisconsin 5,449 5,648 -199 -3.52%<br />
Wyoming 751 537 214 39.85%<br />
TOTAL 664,414 671,888 -7,474 -1.11%<br />
2008-2007<br />
Percent Change<br />
Appendix C C-3
C2: Point-In-Time Estimates from January 2008 of Homeless Population by State<br />
Total<br />
Sheltered<br />
Population<br />
Total<br />
Unsheltered<br />
Population<br />
Total<br />
Homeless<br />
Population<br />
State Homeless<br />
State<br />
Population Rate<br />
Alabama 3,843 1,544 5,387 4,661,900 0.12%<br />
Alaska 1,452 194 1,646 686,293 0.24%<br />
Arizona 6,970 5,518 12,488 6,500,180 0.19%<br />
Arkansas 2,020 1,235 3,255 2,855,390 0.11%<br />
California 46,965 110,312 157,277 36,756,666 0.43%<br />
Colorado 6,877 7,870 14,747 4,939,456 0.30%<br />
Connecticut 4,020 607 4,627 3,501,252 0.13%<br />
Delaware 862 71 933 873,092 0.11%<br />
District of Columbia 5,666 378 6,044 591,833 1.02%<br />
Florida 20,724 29,434 50,158 18,328,340 0.27%<br />
Georgia 8,865 10,230 19,095 9,685,744 0.20%<br />
Guam 103 622 725 154,805 0.47%<br />
Hawaii 2,703 3,358 6,061 1,288,198 0.47%<br />
Idaho 1,250 214 1,464 1,523,816 0.10%<br />
Illinois 11,480 3,244 14,724 12,901,563 0.11%<br />
Indiana 5,923 1,472 7,395 6,376,792 0.12%<br />
Iowa 3,087 259 3,346 3,002,555 0.11%<br />
Kansas 1,500 238 1,738 2,802,134 0.06%<br />
Kentucky 6,195 1,942 8,137 4,269,245 0.19%<br />
Louisiana 3,700 1,781 5,481 4,410,796 0.12%<br />
Maine 2,588 44 2,632 1,316,456 0.20%<br />
Maryland 6,054 3,165 9,219 5,633,597 0.16%<br />
Massachusetts 13,437 1,069 14,506 6,497,967 0.22%<br />
Michigan 11,781 16,467 28,248 10,003,422 0.28%<br />
Minnesota 6,270 1,374 7,644 5,220,393 0.15%<br />
Mississippi 1,206 755 1,961 2,938,618 0.07%<br />
Missouri 5,607 2,080 7,687 5,911,605 0.13%<br />
Montana 1,007 410 1,417 967,440 0.15%<br />
Nebraska 3,227 758 3,985 1,783,432 0.22%<br />
Nevada 4,863 7,747 12,610 2,600,167 0.48%<br />
New Hampshire 1,535 484 2,019 1,315,809 0.15%<br />
New Jersey 11,860 1,972 13,832 8,682,661 0.16%<br />
New Mexico 1,748 1,267 3,015 1,984,356 0.15%<br />
New York 56,516 4,609 61,125 19,490,297 0.31%<br />
North Carolina 8,025 4,386 12,411 9,222,414 0.13%<br />
North Dakota 596 19 615 641,481 0.10%<br />
Ohio 10,377 2,535 12,912 11,485,910 0.11%<br />
Oklahoma 2,803 1,043 3,846 3,642,361 0.11%<br />
Oregon 9,946 10,707 20,653 3,790,060 0.54%<br />
Pennsylvania 14,079 1,299 15,378 12,448,279 0.12%<br />
Puerto Rico 810 2,202 3,012 3,954,037 0.08%<br />
Rhode Island 1,142 54 1,196 1,050,788 0.11%<br />
South Carolina 3,086 2,574 5,660 4,479,800 0.13%<br />
South Dakota 538 41 579 804,194 0.07%<br />
C-4 Appendix C
C2: Point-In-Time Estimates from January 2008 of Homeless Population by State<br />
Total<br />
Sheltered<br />
Population<br />
Total<br />
Unsheltered<br />
Population<br />
Total<br />
Homeless<br />
Population<br />
State Homeless<br />
State<br />
Population Rate<br />
Tennessee 5,660 4,045 9,705 6,214,888 0.16%<br />
Texas 24,080 16,110 40,190 24,326,974 0.17%<br />
Utah 3,178 256 3,434 2,736,424 0.13%<br />
Vermont 696 258 954 621,270 0.15%<br />
Virgin Islands 115 487 602 108,612 0.55%<br />
Virginia 6,895 1,574 8,469 7,769,089 0.11%<br />
Washington 15,456 6,498 21,954 6,549,224 0.34%<br />
West Virginia 1,422 594 2,016 1,814,468 0.11%<br />
Wisconsin 4,934 515 5,449 5,627,967 0.10%<br />
Wyoming 619 132 751 532,668 0.14%<br />
TOTAL 386,361 278,053 664,414 308,277,178 0.22%<br />
Appendix C C-5
Appendix C-3<br />
C-6 Appendix C
Appendix C C-7
C-8 Appendix C
Appendix C C-9
C-10 Appendix C
Appendix C C-11
C-12 Appendix C
Appendix C C-13
C-14 Appendix C
Appendix C C-15
C-16 Appendix C
Appendix C C-17
Appendix D: Counts of Homeless Sheltered<br />
Persons Using HMIS Data<br />
Appendix D D-1
Appendix D-1: Estimate of Sheltered Homeless Individuals and Families during a<br />
One-Year Period, October 2007–September 2008<br />
Number of Sheltered Persons<br />
Household Type Number Percent<br />
All Sheltered Persons… 1,593,794 100.0<br />
…in emergency shelters only 1,228,224 77.1<br />
…in transitional housing only 280,877 17.6<br />
…in both emergency shelters and transitional housing 84,693 5.3<br />
Individuals… 1,092,612 67.9<br />
…in emergency shelters only 885,402 55.0<br />
…in transitional housing only 146,298 9.1<br />
…in both emergency shelters and transitional housing 60,911 3.8<br />
Persons in Families… 516,724 32.1<br />
…in emergency shelters only 354,997 22.1<br />
…in transitional housing only 134,678 8.4<br />
…in both emergency shelters and transitional housing 27,050 1.7<br />
Households with Children 159,142 100.0<br />
Note: Counts may not add up to total because of rounding.<br />
Source: Homeless Management Information System <strong>data</strong>, October 2007–September 2008.<br />
Appendix D-2: Sheltered Homeless Persons by Household Type, October<br />
2007–September 2008<br />
Number<br />
Household Type Number Percent<br />
Number of Homeless Persons 1,593,794 100.0<br />
Individuals 1,092,612<br />
Single adult male households 765,153 47.8<br />
Single adult female households 281,900 17.6<br />
Unaccompanied youth and several-children households 21,705 1.4<br />
Several-adult households 20,488 1.3<br />
Unknown 3,365 --<br />
Persons in Families 516,724<br />
Adults in households with children 203,199 12.7<br />
Children in households with adults 309,259 19.3<br />
Unknown 4,266 --<br />
Note: Counts may not add up to total because of rounding.<br />
Source: Homeless Management Information System <strong>data</strong>, October 2007–September 2008.<br />
D-2 Appendix D
Appendix D-3: Seasonal Point-in-Time Count of Sheltered Homeless Persons<br />
by Household Type, October 2007–September 2008<br />
Number of Sheltered<br />
All Sheltered<br />
Individuals<br />
Persons in Families<br />
Homeless Persons<br />
Persons Number Percent Number Percent<br />
On a single night in<br />
October 2007 323,836 180,416 55.7 143,420 44.3<br />
January 2008 348,855 204,117 58.5 144,737 41.5<br />
April 2008 336,124 188,962 56.2 147,161 43.8<br />
July 2008 328,296 181,532 55.3 146,764 44.7<br />
On an average night 338,910 192,999 57.0 145,911 43.1<br />
Note: Counts may not add up to total because of rounding.<br />
Source: Homeless Management Information System <strong>data</strong>, October 2007–September 2008.<br />
Appendix D D-3
Appendix D-4: Demographic Characteristics of Sheltered Homeless Persons by<br />
Household Type, October 2007–September 2008<br />
All Sheltered Persons Individuals Persons in Families<br />
Characteristics # % # % # %<br />
Number of Homeless Persons 1,593,794 100.0 1,092,612 100.0 516,724 100.0<br />
Gender of Adults 1,261,391 1,070,543 203,199<br />
Female 452,820 36.0 293,338 27.5 163,942 80.9<br />
Male 805,164 64.0 774,205 72.5 38,836 19.2<br />
Unknown 3,407 -- 3,000 -- 421 --<br />
Gender of Children 328,027 21,909 309,259<br />
Female 163,669 50.1 10,011 46.5 155,223 50.4<br />
Male 163,032 49.9 11,534 53.5 153,060 49.7<br />
Unknown 1,326 -- 364 -- 976 --<br />
Ethnicity<br />
Non–Hispanic/non–Latino 1,240,191 80.5 878,655 83.0 370,716 74.6<br />
Hispanic/Latino 300,058 19.5 179,945 17.0 126,212 25.4<br />
Unknown 53,544 -- 34,011 -- 19,797 --<br />
Race<br />
White, non–Hispanic/non–Latino 558,238 37.9 447,677 44.6 117,724 24.4<br />
White, Hispanic/Latino 170,002 11.6 110,790 11.0 63,037 13.1<br />
Black or African American 614,024 41.7 371,413 37.0 245,081 50.9<br />
Asian 12,181 0.8 7,985 0.8 4,364 0.9<br />
American Indian or Alaska<br />
Native 28,137 1.9 16,964 1.7 11,546 2.4<br />
Native Hawaiian or other Pacific<br />
Islander 10,378 0.7 3,392 0.3 7,125 1.5<br />
Several races 78,765 5.4 46,681 4.7 32,829 6.8<br />
Unknown 122,069 -- 87,709 -- 35,019 --<br />
Age<br />
Under 1 35,113 2.2 3,082 0.3 32,425 6.3<br />
1 to 5 127,184 8.1 3,452 0.3 124,925 24.4<br />
6 to 12 107,287 6.8 3,201 0.3 105,060 20.5<br />
13 to 17 58,018 3.7 12,149 1.1 46,462 9.1<br />
18 to 30 350,274 22.2 243,609 22.5 110,197 21.5<br />
31 to 50 636,651 40.3 556,949 51.5 85,330 16.7<br />
51 to 61 220,374 14.0 216,283 20.0 6,427 1.3<br />
62 and older 43,450 2.8 43,129 4.0 1,093 0.2<br />
Unknown 15,444 -- 10,757 -- 4,806 --<br />
Persons by Household Size<br />
1 person 1,057,947 66.7 1,068,352 97.8 0 0.0<br />
2 people 146,697 9.3 21,010 1.9 127,059 25.0<br />
3 people 150,983 9.5 2,054 0.2 150,564 29.6<br />
4 people 110,754 7.0 989 0.1 110,818 21.8<br />
5 or more people 119,498 7.5 204 0.0 120,342 23.7<br />
Unknown 7,915 -- 2 -- 7,941 --<br />
D-4 Appendix D
Appendix D-4: Demographic Characteristics of Sheltered Homeless Persons by<br />
Household Type, October 2007–September 2008<br />
Characteristics All Sheltered Persons Individuals Persons in Families<br />
# % # % # %<br />
Veteran (adults only)<br />
Yes 135,583 11.6 133,431 13.4 3,647 2.0<br />
No 1,031,798 88.4 866,235 86.7 175,798 98.0<br />
Unknown 94,011 -- 70,877 -- 23,755 --<br />
Disabled (adults only)<br />
Yes 421,246 42.8 397,807 47.1 27,182 18.4<br />
No 562,560 57.2 447,766 53.0 120,701 81.6<br />
Unknown 277,586 -- 224,970 -- 55,316 --<br />
Note: Counts may not add up to total because of rounding.<br />
Source: Homeless Management Information System <strong>data</strong>, October 2007–September 2008.<br />
Appendix D D-5
Appendix D-5: Demographic Characteristics of Sheltered Homeless Persons in<br />
Emergency Shelters, October 2007–September 2008<br />
Persons in Emergency<br />
Shelters Individuals Persons in Families<br />
Characteristics # % # % # %<br />
Number of Homeless Persons 1,312,917 100.0 946,313 100.0 382,046 100.0<br />
Gender of Adults 1,070,999 931,866 151,957<br />
Female 354,126 33.1 236,997 25.5 121,365 80.0<br />
Male 714,317 66.9 692,522 74.5 30,363 20.0<br />
Unknown 2,556 -- 2,347 -- 229 --<br />
Gender of Children 240,024 14,255 228,363<br />
Female 119,685 50.1 6,818 49.2 114,152 50.2<br />
Male 119,105 49.9 7,042 50.8 113,357 49.8<br />
Unknown 1,234 -- 395 -- 854 --<br />
Ethnicity<br />
Non–Hispanic/non–Latino 1,012,782 79.1 752,236 81.3 271,293 73.2<br />
Hispanic/Latino 267,697 20.9 172,555 18.7 99,509 26.8<br />
Unknown 32,438 -- 21,522 -- 11,244 --<br />
Race<br />
White, non–Hispanic/non–<br />
441,171<br />
371,810<br />
74,367<br />
Latino<br />
36.3<br />
42.8<br />
20.5<br />
White, Hispanic/Latino 156,366 12.9 108,068 12.4 51,095 14.1<br />
Black or African American 514,698 42.3 325,264 37.4 195,055 53.8<br />
Asian 10,187 0.8 7,080 0.8 3,228 0.9<br />
American Indian or Alaska<br />
Native<br />
21,838<br />
1.8<br />
13,316<br />
1.5<br />
8,776<br />
2.4<br />
Native Hawaiian or other<br />
Pacific Islander<br />
8,250<br />
0.7<br />
2,660<br />
0.3<br />
5,689<br />
1.6<br />
Several races 64,132 5.3 40,587 4.7 24,295 6.7<br />
Unknown 96,274 -- 77,529 -- 19,542 --<br />
Age<br />
Under 1 25,249 1.9 2,108 0.2 23,440 6.2<br />
1 to 5 93,735 7.2 1,788 0.2 92,941 24.5<br />
6 to 12 79,330 6.1 2,692 0.3 77,497 20.4<br />
13 to 17 41,357 3.2 7,666 0.8 34,128 9.0<br />
18 to 30 285,183 21.9 206,371 22.1 82,205 21.6<br />
31 to 50 543,199 41.8 486,098 51.9 63,527 16.7<br />
51 to 61 191,503 14.7 188,639 20.2 5,264 1.4<br />
62 and older 41,061 3.2 40,770 4.4 868 0.2<br />
Unknown 12,301 -- 10,180 -- 2,176 --<br />
Persons by Household Size<br />
1 person 913,337 69.8 924,277 97.7 0 0.0<br />
2 people 110,682 8.5 19,465 2.1 92,584 24.5<br />
3 people 111,049 8.5 1,645 0.2 110,587 29.2<br />
4 people 81,906 6.3 766 0.1 82,051 21.7<br />
5 or more people 92,429 7.1 161 0.0 93,277 24.6<br />
Unknown 3,515 -- 0 -- 3,548 --<br />
D-6 Appendix D
Appendix D-5: Demographic Characteristics of Sheltered Homeless Persons in<br />
Emergency Shelters, October 2007–September 2008<br />
Persons in Emergency<br />
Shelters Individuals Persons in Families<br />
Characteristics # % # % # %<br />
Veteran (adults only)<br />
Yes 113,092 11.4 111,650 12.8 2,807 2.1<br />
No 882,950 88.7 760,664 87.2 132,945 97.9<br />
Unknown 74,957 -- 59,551 -- 16,205 --<br />
Disabled (adults only)<br />
Yes 323,440 39.1 307,386 42.4 20,393 17.9<br />
No 503,512 60.9 416,857 57.6 93,332 82.1<br />
Unknown 244,047 -- 207,623 -- 38,232 --<br />
Note: Counts may not add up to total because of rounding.<br />
Source: Homeless Management Information System <strong>data</strong>, October 2007–September 2008.<br />
Appendix D D-7
Appendix D-6: Demographic Characteristics of Sheltered Homeless Persons in<br />
Transitional <strong>Housing</strong>, October 2007–September 2008<br />
Persons in<br />
Transitional<br />
Characteristics<br />
<strong>Housing</strong> Individuals Persons in Families<br />
# % # % # %<br />
Number of Homeless Persons 365,570 100.0 207,209 100.0 161,728 100.0<br />
Gender of Adults 258,138 198,449 62,020<br />
Female 122,585 47.7 72,400 36.6 51,268 82.9<br />
Male 134,530 52.3 125,226 63.4 10,542 17.1<br />
Unknown 1,023 -- 823 -- 210 --<br />
Gender of Children 104,772 8,760 97,038<br />
Female 52,260 50.0 3,666 41.9 49,147 50.7<br />
Male 52,317 50.0 5,080 58.1 47,708 49.3<br />
Unknown 195 -- 14 -- 183 --<br />
Ethnicity<br />
Non–Hispanic/non–Latino 289,211 84.8 173,637 90.2 118,090 77.7<br />
Hispanic/Latino 51,999 15.2 18,778 9.8 33,849 22.3<br />
Unknown 24,360 -- 14,794 -- 9,788 --<br />
Race<br />
White, non–Hispanic/non–Latino 145,806 43.6 98,278 50.9 48,837 33.8<br />
White, Hispanic/Latino 25,818 7.7 10,130 5.3 16,109 11.1<br />
Black or African American 131,064 39.2 69,665 36.1 62,473 43.2<br />
Asian 2,771 0.8 1,414 0.7 1,380 1.0<br />
American Indian or Alaska Native 7,612 2.3 4,258 2.2 3,396 2.4<br />
Native Hawaiian or other Pacific<br />
Islander 2,800 0.8 974 0.5 1,855 1.3<br />
Several races 18,551 5.6 8,225 4.3 10,547 7.3<br />
Unknown 31,147 -- 14,265 -- 17,131 --<br />
Age<br />
Under 1 11,724 3.2 1,180 0.6 10,690 6.7<br />
1 to 5 39,955 11.0 1,845 0.9 38,475 24.2<br />
6 to 12 33,432 9.2 652 0.3 33,081 20.8<br />
13 to 17 19,573 5.4 5,054 2.5 14,735 9.3<br />
18 to 30 83,205 23.0 50,197 24.3 33,633 21.2<br />
31 to 50 127,701 35.3 102,481 49.7 26,426 16.6<br />
51 to 61 41,393 11.4 40,229 19.5 1,592 1.0<br />
62 and older 4,965 1.4 4,731 2.3 295 0.2<br />
Unknown 3,622 -- 840 -- 2,802 --<br />
Persons by Household Size<br />
1 person 201,512 55.8 203,393 98.2 0 0.0<br />
2 people 43,707 12.1 2,933 1.4 41,288 26.3<br />
3 people 47,774 13.2 551 0.3 47,602 30.3<br />
4 people 34,556 9.6 269 0.1 34,559 22.0<br />
5 or more people 33,340 9.2 61 0.0 33,547 21.4<br />
Unknown 4,681 -- 2 -- 4,731 --<br />
D-8 Appendix D
Appendix D-6: Demographic Characteristics of Sheltered Homeless Persons in<br />
Transitional <strong>Housing</strong>, October 2007–September 2008<br />
Persons in<br />
Transitional<br />
Characteristics<br />
<strong>Housing</strong> Individuals Persons in Families<br />
# % # % # %<br />
Veteran (adults only)<br />
Yes 29,465 12.6 28,757 15.8 1,060 2.0<br />
No 203,748 87.4 153,105 84.2 52,435 98.0<br />
Unknown 24,924 -- 16,587 -- 8,526 --<br />
Disabled (adults only)<br />
Yes 122,972 58.1 115,784 67.6 8,267 19.5<br />
No 88,872 42.0 55,624 32.5 34,164 80.5<br />
Unknown 46,294 -- 27,041 -- 19,588 --<br />
Note: Counts may not add up to total because of rounding.<br />
Source: Homeless Management Information System <strong>data</strong>, October 2007–September 2008.<br />
Appendix D D-9
Appendix D-7: Demographic Characteristics of Sheltered Homeless Persons by<br />
Location, October 2007–September 2008<br />
Suburban and<br />
Principal Cities<br />
Rural Areas<br />
Characteristics Number Percent Number Percent<br />
Number of Homeless Persons 1,084,335 100.0 509,459 100.0<br />
Gender of Adults 880,382 381,010<br />
Female 293,155 33.4 159,665 42.0<br />
Male 584,790 66.6 220,374 58.0<br />
Unknown 2,437 -- 971 --<br />
Gender of Children 202,034 125,995<br />
Female 99,136 49.2 64,533 51.6<br />
Male 102,400 50.8 60,633 48.4<br />
Unknown 498 -- 829 --<br />
Ethnicity<br />
Non–Hispanic/non–Latino 813,303 77.7 426,888 86.5<br />
Hispanic/Latino 233,369 22.3 66,689 13.5<br />
Unknown 37,663 -- 15,881 --<br />
Race<br />
White, non–Hispanic/non–Latino 322,604 32.8 235,634 48.4<br />
White, Hispanic/Latino 131,768 13.4 38,324 7.8<br />
Black or African American 447,238 45.4 166,785 34.2<br />
Asian 8,344 0.9 3,837 0.8<br />
American Indian or Alaska Native 16,180 1.6 11,957 2.5<br />
Native Hawaiian or other Pacific<br />
Islander 5,789 0.6 4,589 0.9<br />
Several races 52,425 5.3 26,340 5.4<br />
Unknown 99,987 -- 22,082 --<br />
Age<br />
Under 1 22,671 2.1 12,443 2.5<br />
1 to 5 78,865 7.4 48,320 9.6<br />
6 to 12 66,228 6.2 41,059 8.1<br />
13 to 17 33,864 3.2 24,155 4.8<br />
18 to 30 226,577 21.1 123,697 24.5<br />
31 to 50 451,666 42.1 184,985 36.6<br />
51 to 61 158,169 14.7 62,204 12.3<br />
62 and older 34,854 3.3 8,596 1.7<br />
Unknown 11,442 -- 4,001 --<br />
Persons by Household Size<br />
1 person 750,464 69.7 307,483 60.4<br />
2 people 95,577 8.9 51,121 10.0<br />
3 people 91,909 8.5 59,073 11.6<br />
4 people 67,734 6.3 43,019 8.5<br />
5 or more people 71,098 6.6 48,400 9.5<br />
Unknown 7,553 -- 363 --<br />
D-10 Appendix D
Appendix D-7: Demographic Characteristics of Sheltered Homeless Persons by<br />
Location, October 2007–September 2008<br />
Suburban and<br />
Principal Cities<br />
Rural Areas<br />
Characteristics Number Percent Number Percent<br />
Veteran (adults only)<br />
Yes 101,194 12.3 34,389 10.1<br />
No 724,409 87.7 307,389 89.9<br />
Unknown 54,779 -- 39,232 --<br />
Disabled (adults only)<br />
Yes 245,537 38.0 175,709 52.2<br />
No 401,331 62.0 161,229 47.9<br />
Unknown 233,514 -- 44,072 --<br />
Note: Counts may not add up to total because of rounding.<br />
Source: Homeless Management Information System <strong>data</strong>, October 2007–September 2008.<br />
Appendix D D-11
Appendix D-8: Earlier Living Situation of Persons Using Homeless Residential<br />
Services by Household Type, October 2007–September 2008<br />
All Sheltered<br />
Adults Individual Adults Adults in Families<br />
Earlier Living Situation # % # % # %<br />
Number of Homeless Adults 1,283,272 100.0 1,092,612 100.0 203,199 100.0<br />
Living Arrangement the Night before<br />
Program Entry<br />
Place not meant for human habitation 129,804 12.9 125,330 14.7 6,671 4.0<br />
Emergency shelter 219,057 21.7 187,812 22.0 33,352 19.8<br />
Transitional housing 26,824 2.7 23,232 2.7 3,774 2.2<br />
Permanent supportive housing 3,078 0.3 2,598 0.3 507 0.3<br />
Psychiatric facility 14,691 1.5 14,677 1.7 218 0.1<br />
Substance abuse treatment center or<br />
detox 40,005 4.0 37,818 4.4 2,385 1.4<br />
Hospital (nonpsychiatric) 12,629 1.3 12,397 1.5 361 0.2<br />
Jail, prison, or juvenile detention 47,993 4.8 47,387 5.6 920 0.5<br />
Rented housing unit 101,735 10.1 75,588 8.9 27,881 16.5<br />
Owned housing unit 20,942 2.1 17,021 2.0 4.118 2.4<br />
Staying with family 165,839 16.4 120,981 14.2 46,873 27.8<br />
Staying with friends 122,005 12.1 99,231 11.6 24,481 14.5<br />
Hotel or motel (no voucher) 33,443 3.3 24,083 2.8 9,783 5.8<br />
Foster care home 3,897 0.4 3,821 0.5 132 0.1<br />
Other living arrangement 68,027 6.7 60,722 7.1 7,417 4.4<br />
Unknown 273,303 -- 239,914 -- 34,327 --<br />
Stability of Previous Night’s Living<br />
Arrangement<br />
Stayed 1 week or less 187,886 20.6 163,851 21.3 26,803 17.3<br />
Stayed more than 1 week, but less than<br />
a month 140,522 15.4 116,940 15.2 25,370 16.3<br />
Stayed 1 to 3 months 196,519 21.6 163,432 21.3 35,520 22.9<br />
Stayed more than 3 months, but less<br />
than a year 146,024 16.0 116,195 15.1 31,657 20.4<br />
Stayed 1 year or longer 241,002 26.4 207,438 27.0 35,939 23.1<br />
Unknown 371,319 -- 324,755 -- 47,911 --<br />
ZIP Code of Last Permanent Address<br />
Same jurisdiction as program location 584,514 62.5 465,919 60.0 125,013 73.1<br />
Different jurisdiction than program<br />
location 351,476 37.6 310,367 40.0 46,020 26.9<br />
Unknown 347,281 -- 316,325 -- 32,167 --<br />
Note: Counts may not add up to total because of rounding. Number of adults is equal to the number of adults in families and<br />
individuals, including unaccompanied youth.<br />
Source:<br />
Homeless Management Information System<br />
<strong>data</strong>, October 2007–September 2008.<br />
D-12 Appendix D
Appendix D-9: Earlier Living Situation of Persons Using Homeless Residential<br />
Services in Emergency Shelters, October 2007–September 2008<br />
Adults in<br />
Emergency Shelters Individual Adults Adults in Families<br />
Earlier Living Situation # % # % # %<br />
Number of Homeless Adults 1,085,286 100.0 946,313 100.0 151,956 100.0<br />
Living Arrangement the Night before<br />
Program Entry<br />
Place not meant for human<br />
habitation 117,429 14.1 114,380 15.8 5,047 4.1<br />
Emergency shelter 164,657 19.7 151,306 20.9 15,280 12.5<br />
Transitional housing 13,276 1.6 12,524 1.7 924 0.8<br />
Permanent supportive housing 2,382 0.3 2,006 0.3 408 0.3<br />
Psychiatric facility 10,512 1.3 10,443 1.4 224 0.2<br />
Substance abuse treatment center<br />
or detox 17,560 2.1 17,175 2.4 580 0.5<br />
Hospital (nonpsychiatric) 11,759 1.4 11,603 1.6 315 0.3<br />
Jail, prison, or juvenile detention 36,671 4.4 36,607 5.1 577 0.5<br />
Rented housing unit 95,417 11.4 73,489 10.2 23,354 19.1<br />
Owned housing unit 19,262 2.3 16,130 2.2 3,363 2.8<br />
Staying with family 138,600 16.6 102,959 14.2 37,486 30.7<br />
Staying with friends 112,735 13.5 93,532 12.9 20,744 17.0<br />
Hotel or motel (no voucher) 29,402 3.5 21,496 3.0 8,253 6.8<br />
Foster care home 2,273 0.3 2,199 0.3 109 0.1<br />
Other living arrangement 62,727 7.5 57,902 8.0 5,595 4.6<br />
Unknown 250,623 -- 22,562 -- 29,698 --<br />
Stability of Previous Night’s Living<br />
Arrangement<br />
Stayed 1 week or less 175,380 23.1 153,611 23.5 24,191 20.8<br />
Stayed more than 1 week, but less<br />
than a month 108,363 14.3 90,369 13.9 19,522 16.8<br />
Stayed 1 to 3 months 149,836 19.8 129,855 19.9 22,084 19.0<br />
Stayed more than 3 months, but<br />
less than a year 112,757 14.9 91,981 14.1 22,291 19.2<br />
Stayed 1 year or longer 211,958 28.0 186,832 28.6 28,285 24.3<br />
Unknown 326,992 -- 293,665 -- 35,583 --<br />
ZIP Code of Last Permanent Address<br />
Same jurisdiction as program<br />
location 489,234 61.0 400,306 58.7 95,468 72.9<br />
Different jurisdiction than program<br />
location 313,026 39.0 281,762 41.3 35,557 27.1<br />
Unknown 283,026 -- 264,245 -- 20,931 --<br />
Note: Counts may not add up to total because of rounding. Number of adults is equal to the number of adults in families and<br />
individuals, including unaccompanied youth<br />
Source: Homeless Management Information System <strong>data</strong>, October 2007–September 2008.<br />
Appendix D D-13
Appendix D-10: Earlier Living Situation of Persons Using Homeless Residential<br />
Services in Transitional <strong>Housing</strong>, October 2007–September 2008<br />
All Adults in<br />
Transitional<br />
Earlier Living Situation<br />
<strong>Housing</strong> Individual Adults Adults in Families<br />
# % # % # %<br />
Number of Homeless Adults 266,713 100.0 207,209 100.0 62,020 100.0<br />
Living Arrangement the Night before<br />
Program Entry<br />
Place not meant for human habitation 21,627 9.3 19,806 11.1 2,062 3.7<br />
Emergency shelter 66,338 28.6 47,069 26.3 19,929 35.7<br />
Transitional housing 15,249 6.6 12,293 6.9 3,102 5.6<br />
Permanent supportive housing 880 0.4 761 0.4 120 0.2<br />
Psychiatric facility 4,998 2.2 5,005 2.8 14 0.0<br />
Substance abuse treatment center or<br />
detox 24,866 10.7 23,134 12.9 1,931 3.5<br />
Hospital (nonpsychiatric) 1,589 0.7 1,551 0.9 59 0.1<br />
Jail, prison, or juvenile detention 14,092 6.1 13,840 7.7 405 0.7<br />
Rented housing unit 12,151 5.2 6,290 3.5 5,989 10.7<br />
Owned housing unit 2,879 1.2 1,914 1.1 994 1.8<br />
Staying with family 35,705 15.4 24,163 13.5 11,815 21.2<br />
Staying with friends 15,528 6.7 10,648 6.0 5,043 9.0<br />
Hotel or motel (no voucher) 5,508 2.4 3,486 2.0 2,073 3.7<br />
Foster care home 1,805 0.8 1,796 1.0 33 0.1<br />
Other living arrangement 9,080 3.9 6,979 3.9 2,202 4.0<br />
Unknown 34,416 -- 28,474 -- 6,249 --<br />
Stability of Previous Night’s Living<br />
Arrangement<br />
Stayed 1 week or less 22,272 10.8 18,572 11.5 3,951 8.3<br />
Stayed more than 1 week, but less than<br />
a month 40,589 19.6 33,777 21.0 7,211 15.2<br />
Stayed 1 to 3 months 57,707 27.9 42,671 26.5 15,626 33.0<br />
Stayed more than 3 months, but less<br />
than a year 41,851 20.3 31,198 19.4 11,055 23.3<br />
Stayed 1 year or longer 44,202 21.4 35,019 21.7 9,566 20.2<br />
Unknown 60,092 -- 45,972 -- 14,612 --<br />
ZIP Code of Last Permanent Address<br />
Same jurisdiction as program location 130,130 69.5 94,837 67.9 36,560 74.1<br />
Different jurisdiction than program<br />
location 57,060 30.5 44,874 32.1 12,757 25.9<br />
Unknown 79,523 -- 67,498 -- 12,703 --<br />
Note: Counts may not add up to total because of rounding. Number of adults is equal to the number of adults in families<br />
and individuals, including unaccompanied youth.<br />
Source: Homeless Management Information System <strong>data</strong>, October 2007–September 2008.<br />
D-14 Appendix D
Appendix D-11: Earlier Living Situation of Persons Using Homeless Residential<br />
Services by Location, October 2007–September 2008<br />
Earlier Living Situation Principal Cities Suburban and Rural Areas<br />
Number Percent Number Percent<br />
Number of Homeless Adults 893,780 100.0 389,492 100.0<br />
Living Arrangement the Night before<br />
Program Entry<br />
Place not meant for human habitation 94,432 14.0 35,371 10.6<br />
Emergency shelter 157,620 23.4 61,437 18.3<br />
Transitional housing 18,544 2.8 8,280 2.5<br />
Permanent supportive housing 1,891 0.3 1,186 0.4<br />
Psychiatric facility 8,865 1.3 5,826 1.7<br />
Substance abuse treatment center or<br />
detox 21,783 3.2 18,222 5.4<br />
Hospital (nonpsychiatric) 8,089 1.2 4,540 1.4<br />
Jail, prison, or juvenile detention 30,327 4.5 17,666 5.3<br />
Rented housing unit 72,437 10.7 29,299 8.7<br />
Owned housing unit 12,095 1.8 8,846 2.6<br />
Staying with family 104,946 15.6 60,893 18.2<br />
Staying with friends 76,029 11.3 45,976 13.7<br />
Hotel or motel (no voucher) 15,662 2.3 17,781 5.3<br />
Foster care home 2,733 0.4 1,164 0.4<br />
Other living arrangement 49,192 7.3 18,835 5.6<br />
Unknown 219,135 -- 54,168 --<br />
Stability of Previous Night’s Living<br />
Arrangement<br />
Stayed 1 week or less 107,472 17.9 80,414 25.7<br />
Stayed more than 1 week, but less<br />
than a month 85,759 14.3 54,763 17.5<br />
Stayed 1 to 3 months 133,313 22.2 63,206 20.2<br />
Stayed more than 3 months, but less<br />
than a year 93,539 15.6 52,485 16.8<br />
Stayed 1 year or longer 179,430 29.9 61,573 19.7<br />
Unknown 294,267 -- 77,051 --<br />
ZIP Code of Last Permanent Address<br />
Same jurisdiction as program location 404,082 64.8 180,433 57.8<br />
Different jurisdiction than program<br />
location 219,880 35.2 131,596 42.2<br />
Unknown 269,817 -- 77,463 --<br />
Note: Counts may not add up to total because of rounding. Number of adults is equal to the number of adults in families<br />
and individuals, including unaccompanied youth.<br />
Source: Homeless Management Information System <strong>data</strong>, October 2007–September 2008.<br />
Appendix D D-15
Appendix D-12: Length of Stay in Emergency Shelters by Household Type, October<br />
2007–September 2008: Counts<br />
Persons in<br />
Individuals<br />
Length of Stay<br />
Emergency<br />
Shelters All Male Female<br />
Persons in<br />
Families<br />
Number of Homeless Persons 1,311,023 946,121 699,564 243,815 380,320<br />
Length of Stay 1,311,026 946,121 699,563 243,815 380,319<br />
1 week or less 425,896 342,647 256,323 84,920 88,145<br />
1 week to 1 month 350,960 255,118 190,723 63,659 100,159<br />
1 to 2 months 197,580 129,736 91,588 38,087 70,131<br />
2 to 3 months 99,071 63,419 44,309 18,977 36,808<br />
3 to 4 months 61,862 41,585 30,635 10,942 21,064<br />
4 to 5 months 36,603 22,741 16,918 5,465 14,342<br />
5 to 6 months 24,345 15,467 11,536 3,923 9,213<br />
6 to 7 months 16,854 10,292 8,024 2,264 6,789<br />
7 to 8 months 13,087 7,761 6,002 1,757 5,514<br />
8 to 9 months 9,381 5,295 4,008 1,283 4,220<br />
9 to 10 months 6,934 4,195 3,161 1,032 2,841<br />
10 to 11 months 7,175 4,174 3,372 803 3,101<br />
11 months to 1 year 6,937 4,195 3,265 930 2,846<br />
1 year 20,649 10,442 7,843 2,587 10,482<br />
Unknown 33,692 29,054 21,856 7,186 4,664<br />
Note: Counts may not add up to total because of rounding. Total homeless persons may not add up to the sum of the length-of-stay counts<br />
because length of stay was not collected for persons who could not be designated as adult or children.<br />
Source: Homeless Management Information System <strong>data</strong>, October 2007–September 2008.<br />
Appendix D-12: Length of Stay in Emergency Shelters by Household Type, October<br />
2007–September 2008: Percentages<br />
Persons in<br />
Individuals<br />
Length of Stay<br />
Emergency<br />
Shelters All Male Female<br />
Persons in<br />
Families<br />
Number of Homeless Persons 100.0 100.0 100.0 100.0 100.0<br />
Length of Stay<br />
1 week or less 33.3 37.4 37.8 35.9 23.5<br />
1 week to 1 month 27.5 27.8 28.1 26.9 26.7<br />
1 to 2 months 15.5 14.2 13.5 16.1 18.7<br />
2 to 3 months 7.8 6.9 6.5 8.0 9.8<br />
3 to 4 months 4.8 4.5 4.5 4.6 5.6<br />
4 to 5 months 2.9 2.5 2.5 2.3 3.8<br />
5 to 6 months 1.9 1.7 1.7 1.7 2.5<br />
6 to 7 months 1.3 1.1 1.2 1.0 1.8<br />
7 to 8 months 1.0 0.9 0.9 0.7 1.5<br />
8 to 9 months 0.7 0.6 0.6 0.5 1.1<br />
9 to 10 months 0.5 0.5 0.5 0.4 0.8<br />
10 to 11 months 0.6 0.5 0.5 0.3 0.8<br />
11 months to 1 year 0.5 0.5 0.5 0.4 0.8<br />
1 year 1.6 1.1 1.2 1.1 2.8<br />
Unknown -- -- -- -- --<br />
Note: Counts may not add up to total because of rounding. Total homeless persons may not add up to the sum of the length-of-stay counts<br />
because length of stay was not collected for persons who could not be designated as adult or children.<br />
Source: Homeless Management Information System <strong>data</strong>, October 2007–September 2008.<br />
D-16 Appendix D
Appendix D-13: Length of Stay in Transitional <strong>Housing</strong> by Household Type, October<br />
2007–September 2008: Counts<br />
Persons in<br />
Individuals<br />
Length of Stay<br />
Transitional<br />
<strong>Housing</strong> All Male Female<br />
Persons in<br />
Families<br />
Number of Homeless Persons 362,910 207,209 130,306 76,066 159,058<br />
Length of Stay 362,908 207,210 130,304 76,066 159,058<br />
1 week or less 20,270 12,551 7,610 4,905 7,940<br />
1 week to 1 month 44,476 28,991 18,544 10,380 15,911<br />
1 to 2 months 48,068 32,914 20,918 11,925 15,614<br />
2 to 3 months 29,263 17,915 12,228 5,627 11,664<br />
3 to 4 months 27,294 16,420 11,161 5,189 11,156<br />
4 to 5 months 23,776 12,774 7,867 4,870 11,242<br />
5 to 6 months 20,144 10,527 7,227 3,265 9,790<br />
6 to 7 months 19,179 9,892 6,281 3,578 9,466<br />
7 to 8 months 14,149 6,921 4,459 2,439 7,357<br />
8 to 9 months 11,833 5,742 3,989 1,733 6,202<br />
9 to 10 months 10,074 4,744 3,006 1,715 5,413<br />
10 to 11 months 10,753 4,920 3,263 1,637 5,947<br />
11 months to 1 year 10,779 5,348 2,585 2,752 5,528<br />
1 year 63,762 33,235 17,169 15,748 30,959<br />
Unknown 9,088 4,316 3,997 303 4,869<br />
Note: Counts may not add up to total because of rounding. Total homeless persons may not add up to the sum of the length-of-stay counts<br />
because length of stay was not collected for persons who could not be designated as adult or children.<br />
Source: Homeless Management Information System <strong>data</strong>, October 2007–September 2008.<br />
Appendix D-13: Length of Stay in Transitional <strong>Housing</strong> by Household Type, October<br />
2007–September 2008: Percentages<br />
Persons in<br />
Individuals<br />
Length of Stay<br />
Transitional<br />
<strong>Housing</strong> All Male Female<br />
Persons in<br />
Families<br />
Number of Homeless Persons 100.0 100.0 100.0 100.0 100.0<br />
Length of Stay<br />
1 week or less 5.7 6.2 6.0 6.5 5.2<br />
1 week to 1 month 12.6 14.3 14.7 13.7 10.3<br />
1 to 2 months 13.6 16.2 16.6 15.7 10.1<br />
2 to 3 months 8.3 8.8 9.7 7.4 7.6<br />
3 to 4 months 7.7 8.1 8.8 6.9 7.2<br />
4 to 5 months 6.7 6.3 6.2 6.4 7.3<br />
5 to 6 months 5.7 5.2 5.7 4.3 6.4<br />
6 to 7 months 5.4 4.9 5.0 4.7 6.1<br />
7 to 8 months 4.0 3.4 3.5 3.2 4.8<br />
8 to 9 months 3.3 2.8 3.2 2.3 4.0<br />
9 to 10 months 2.9 2.3 2.4 2.3 3.5<br />
10 to 11 months 3.0 2.4 2.6 2.2 3.9<br />
11 months to 1 year 3.1 2.6 2.1 3.6 3.6<br />
1 year 18.0 16.4 13.6 20.8 20.1<br />
Unknown -- -- -- -- --<br />
Note: Counts may not add up to total because of rounding. Total homeless persons may not add up to the sum of the length-of-stay counts<br />
because length of stay was not collected for persons who could not be designated as adult or children.<br />
Source: Homeless Management Information System <strong>data</strong>, October 2007–September 2008.<br />
Appendix D D-17