My PhD thesis - Condensed Matter Theory - Imperial College London
My PhD thesis - Condensed Matter Theory - Imperial College London
My PhD thesis - Condensed Matter Theory - Imperial College London

Create successful ePaper yourself
Turn your PDF publications into a flip-book with our unique Google optimized e-Paper software.
CHAPTER 9.<br />
ENERGY<br />
A NEW CALCULATION OF THE JELLIUM SURFACE<br />
0.2<br />
0<br />
0<br />
Potential<br />
-0.2<br />
-0.4<br />
V KS<br />
(no image tail)<br />
V KS<br />
(z 0<br />
=0.72)<br />
V KS<br />
(z 0<br />
=1.49)<br />
V XC<br />
(no image tail)<br />
V XC<br />
(z 0<br />
=0.72)<br />
V XC<br />
(z 0<br />
=1.49)<br />
electron density<br />
-0.05<br />
n(z)<br />
s/2 s<br />
z<br />
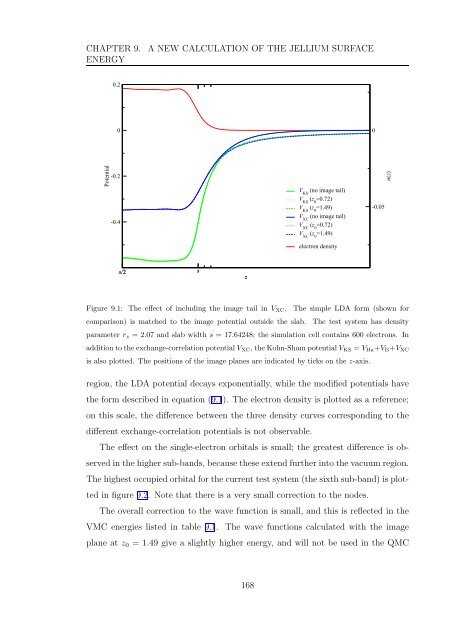
Figure 9.1: The effect of including the image tail in V XC . The simple LDA form (shown for<br />
comparison) is matched to the image potential outside the slab. The test system has density<br />
parameter r s = 2.07 and slab width s = 17.64248; the simulation cell contains 600 electrons. In<br />
addition to the exchange-correlation potential V XC , the Kohn-Sham potential V KS = V Ha +V B +V XC<br />
is also plotted. The positions of the image planes are indicated by ticks on the z-axis.<br />
region, the LDA potential decays exponentially, while the modified potentials have<br />
the form described in equation (9.1). The electron density is plotted as a reference;<br />
on this scale, the difference between the three density curves corresponding to the<br />
different exchange-correlation potentials is not observable.<br />
The effect on the single-electron orbitals is small; the greatest difference is observed<br />
in the higher sub-bands, because these extend further into the vacuum region.<br />
The highest occupied orbital for the current test system (the sixth sub-band) is plotted<br />
in figure 9.2. Note that there is a very small correction to the nodes.<br />
The overall correction to the wave function is small, and this is reflected in the<br />
VMC energies listed in table 9.1. The wave functions calculated with the image<br />
plane at z 0 = 1.49 give a slightly higher energy, and will not be used in the QMC<br />
168