QBE European Operations plc
QBE European Operations plc
QBE European Operations plc

You also want an ePaper? Increase the reach of your titles
YUMPU automatically turns print PDFs into web optimized ePapers that Google loves.
<strong>QBE</strong> <strong>European</strong> <strong>Operations</strong> <strong>plc</strong> Annual report 2011<br />
73<br />
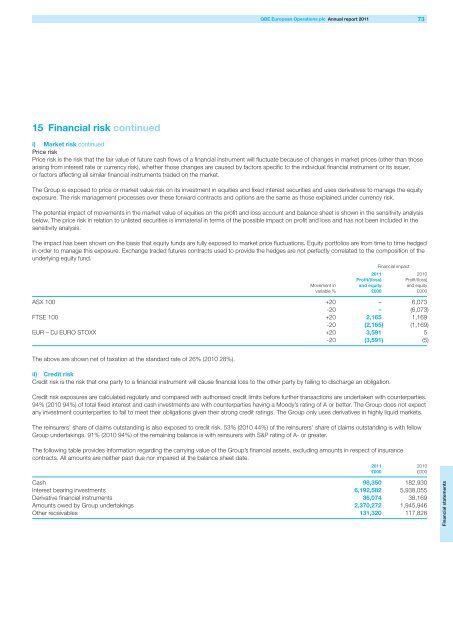
15 Financial risk continued<br />
i) Market risk continued<br />
Price risk<br />
Price risk is the risk that the fair value of future cash flows of a financial instrument will fluctuate because of changes in market prices (other than those<br />
arising from interest rate or currency risk), whether those changes are caused by factors specific to the individual financial instrument or its issuer,<br />
or factors affecting all similar financial instruments traded on the market.<br />
The Group is exposed to price or market value risk on its investment in equities and fixed interest securities and uses derivatives to manage the equity<br />
exposure. The risk management processes over these forward contracts and options are the same as those explained under currency risk.<br />
The potential impact of movements in the market value of equities on the profit and loss account and balance sheet is shown in the sensitivity analysis<br />
below. The price risk in relation to unlisted securities is immaterial in terms of the possible impact on profit and loss and has not been included in the<br />
sensitivity analysis.<br />
The impact has been shown on the basis that equity funds are fully exposed to market price fluctuations. Equity portfolios are from time to time hedged<br />
in order to manage this exposure. Exchange traded futures contracts used to provide the hedges are not perfectly correlated to the composition of the<br />
underlying equity fund.<br />
Financial impact<br />
2011 2010<br />
Profit/(loss)<br />
Profit/(loss)<br />
Movement in and equity and equity<br />
variable % £000 £000<br />
ASX 100 +20 – 6,073<br />
-20 – (6,073)<br />
FTSE 100 +20 2,165 1,169<br />
-20 (2,165) (1,169)<br />
EUR – DJ EURO STOXX +20 3,591 5<br />
-20 (3,591) (5)<br />
The above are shown net of taxation at the standard rate of 26% (2010 28%).<br />
ii) Credit risk<br />
Credit risk is the risk that one party to a financial instrument will cause financial loss to the other party by failing to discharge an obligation.<br />
Credit risk exposures are calculated regularly and compared with authorised credit limits before further transactions are undertaken with counterparties.<br />
94% (2010 94%) of total fixed interest and cash investments are with counterparties having a Moody’s rating of A or better. The Group does not expect<br />
any investment counterparties to fail to meet their obligations given their strong credit ratings. The Group only uses derivatives in highly liquid markets.<br />
The reinsurers’ share of claims outstanding is also exposed to credit risk. 53% (2010 44%) of the reinsurers’ share of claims outstanding is with fellow<br />
Group undertakings. 91% (2010 94%) of the remaining balance is with reinsurers with S&P rating of A- or greater.<br />
The following table provides information regarding the carrying value of the Group’s financial assets, excluding amounts in respect of insurance<br />
contracts. All amounts are neither past due nor impaired at the balance sheet date.<br />
2011 2010<br />
£000 £000<br />
Cash 98,350 182,930<br />
Interest bearing investments 6,192,582 5,938,055<br />
Derivative financial instruments 36,074 38,169<br />
Amounts owed by Group undertakings 2,370,272 1,945,946<br />
Other receivables 131,320 117,828<br />
Financial statements