

PDF: 4209 KB - Bureau of Infrastructure, Transport and Regional ...
PDF: 4209 KB - Bureau of Infrastructure, Transport and Regional ...
PDF: 4209 KB - Bureau of Infrastructure, Transport and Regional ...

You also want an ePaper? Increase the reach of your titles
YUMPU automatically turns print PDFs into web optimized ePapers that Google loves.
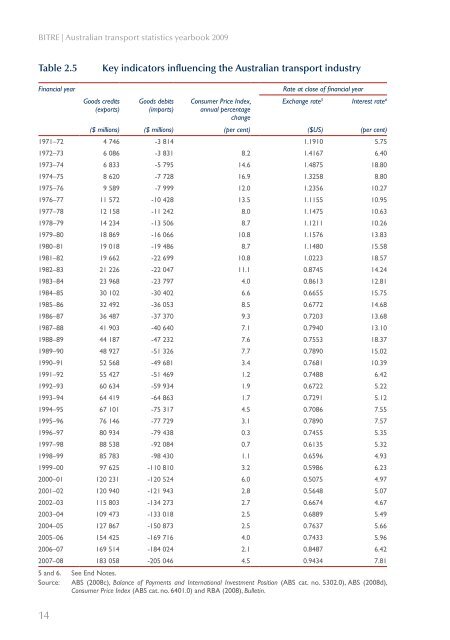
BITRE | Australian transport statistics yearbook 2009<br />
Table 2.5<br />
Key indicators influencing the Australian transport industry<br />
Financial year<br />
Goods credits<br />
(exports)<br />
Goods debits<br />
(imports)<br />
Consumer Price Index,<br />
annual percentage<br />
change<br />
Rate at close <strong>of</strong> financial year<br />
Exchange rate 5 Interest rate 6<br />
($ millions) ($ millions) (per cent) ($US) (per cent)<br />
1971–72 4 746 -3 814 1.1910 5.75<br />
1972–73 6 086 -3 831 8.2 1.4167 6.40<br />
1973–74 6 833 -5 795 14.6 1.4875 18.80<br />
1974–75 8 620 -7 728 16.9 1.3258 8.80<br />
1975–76 9 589 -7 999 12.0 1.2356 10.27<br />
1976–77 11 572 -10 428 13.5 1.1155 10.95<br />
1977–78 12 158 -11 242 8.0 1.1475 10.63<br />
1978–79 14 234 -13 506 8.7 1.1211 10.26<br />
1979–80 18 869 -16 066 10.8 1.1576 13.83<br />
1980–81 19 018 -19 486 8.7 1.1480 15.58<br />
1981–82 19 662 -22 699 10.8 1.0223 18.57<br />
1982–83 21 226 -22 047 11.1 0.8745 14.24<br />
1983–84 23 968 -23 797 4.0 0.8613 12.81<br />
1984–85 30 102 -30 402 6.6 0.6655 15.75<br />
1985–86 32 492 -36 053 8.5 0.6772 14.68<br />
1986–87 36 487 -37 370 9.3 0.7203 13.68<br />
1987–88 41 903 -40 640 7.1 0.7940 13.10<br />
1988–89 44 187 -47 232 7.6 0.7553 18.37<br />
1989–90 48 927 -51 326 7.7 0.7890 15.02<br />
1990–91 52 568 -49 681 3.4 0.7681 10.39<br />
1991–92 55 427 -51 469 1.2 0.7488 6.42<br />
1992–93 60 634 -59 934 1.9 0.6722 5.22<br />
1993–94 64 419 -64 863 1.7 0.7291 5.12<br />
1994–95 67 101 -75 317 4.5 0.7086 7.55<br />
1995–96 76 146 -77 729 3.1 0.7890 7.57<br />
1996–97 80 934 -79 438 0.3 0.7455 5.35<br />
1997–98 88 538 -92 084 0.7 0.6135 5.32<br />
1998–99 85 783 -98 430 1.1 0.6596 4.93<br />
1999–00 97 625 -110 810 3.2 0.5986 6.23<br />
2000–01 120 231 -120 524 6.0 0.5075 4.97<br />
2001–02 120 940 -121 943 2.8 0.5648 5.07<br />
2002–03 115 803 -134 273 2.7 0.6674 4.67<br />
2003–04 109 473 -133 018 2.5 0.6889 5.49<br />
2004–05 127 867 -150 873 2.5 0.7637 5.66<br />
2005–06 154 425 -169 716 4.0 0.7433 5.96<br />
2006–07 169 514 -184 024 2.1 0.8487 6.42<br />
2007–08 183 058 -205 046 4.5 0.9434 7.81<br />
5 <strong>and</strong> 6. See End Notes.<br />
Source: ABS (2008c), Balance <strong>of</strong> Payments <strong>and</strong> International Investment Position (ABS cat. no. 5302.0), ABS (2008d),<br />
Consumer Price Index (ABS cat. no. 6401.0) <strong>and</strong> RBA (2008), Bulletin.<br />
14


